SlideShare a Scribd company logo
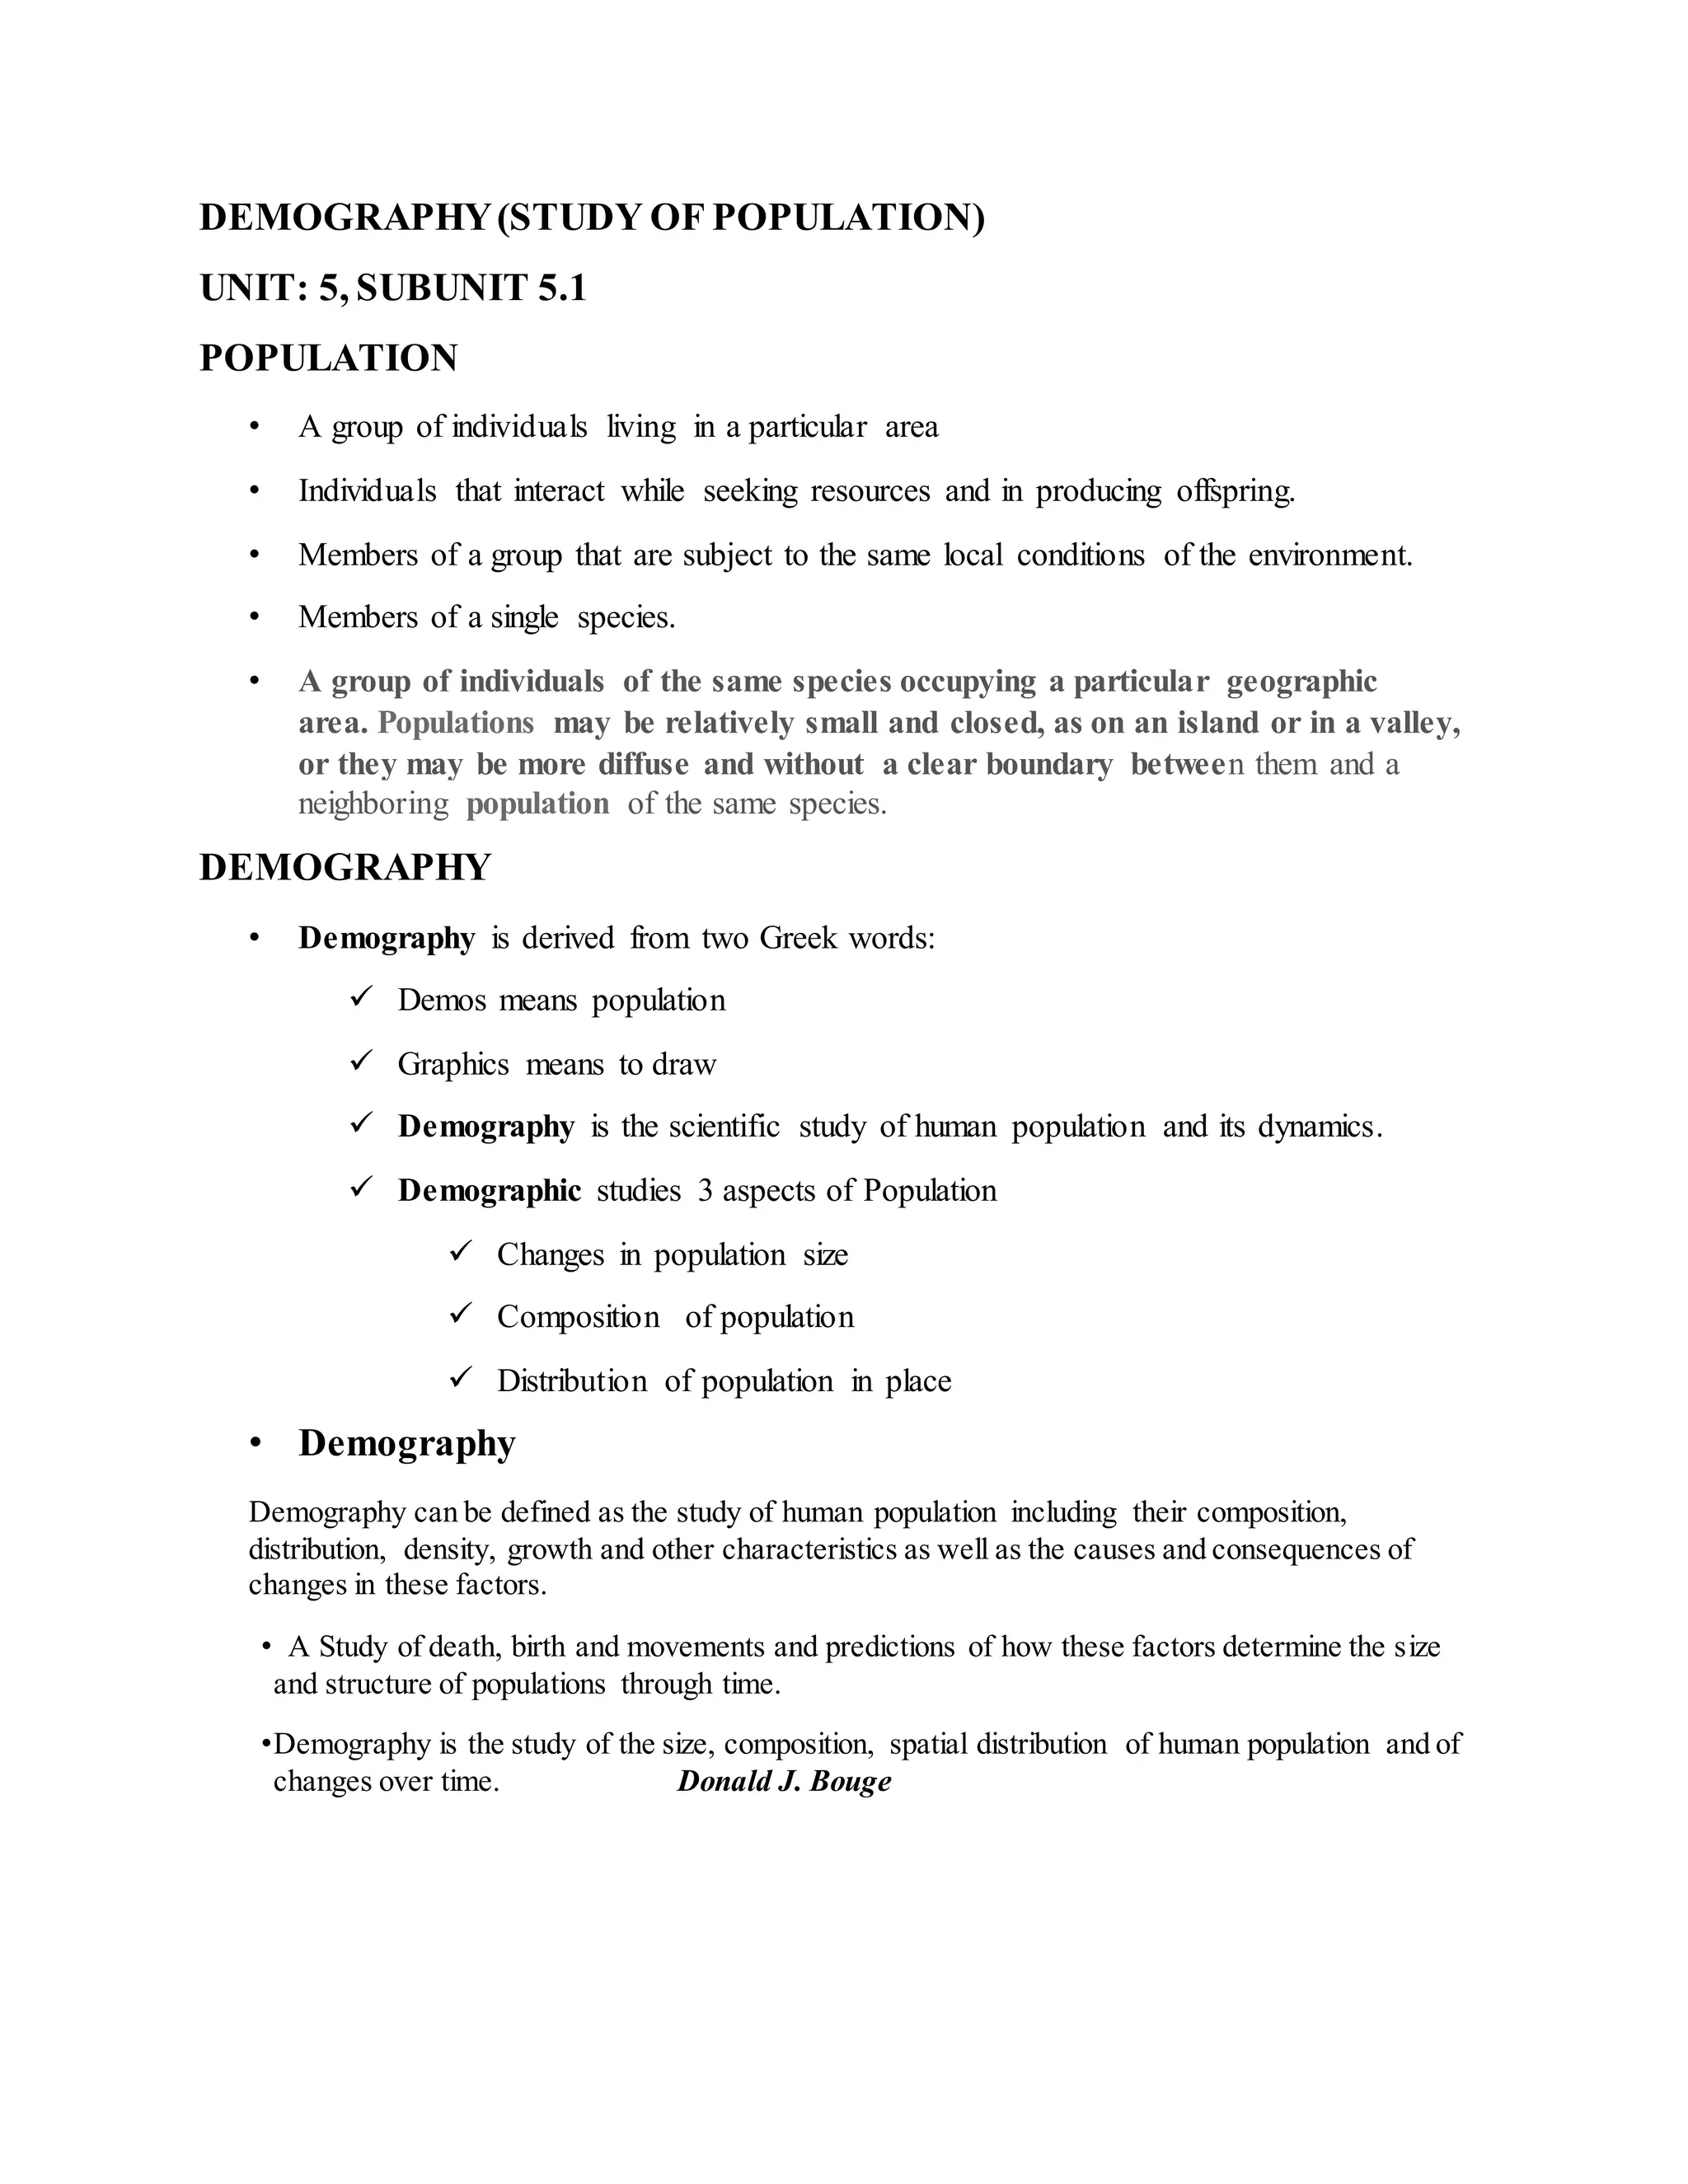
DEMOGRAPHY(STUDY OF POPULATION)
UNIT: 5, SUBUNIT 5.1
POPULATION
• A group of individuals living in a particular area
• Individuals that interact while seeking resources and in producing offspring.
• Members of a group that are subject to the same local conditions of the environment.
• Members of a single species.
• A group of individuals of the same species occupying a particular geographic
area. Populations may be relatively small and closed, as on an island or in a valley,
or they may be more diffuse and without a clear boundary between them and a
neighboring population of the same species.
DEMOGRAPHY
• Demography is derived from two Greek words:
 Demos means population
 Graphics means to draw
 Demography is the scientific study of human population and its dynamics.
 Demographic studies 3 aspects of Population
 Changes in population size
 Composition of population
 Distribution of population in place
• Demography
Demography can be defined as the study of human population including their composition,
distribution, density, growth and other characteristics as well as the causes and consequences of
changes in these factors.
• A Study of death, birth and movements and predictions of how these factors determine the size
and structure of populations through time.
•Demography is the study of the size, composition, spatial distribution of human population and of
changes over time. Donald J. Bouge
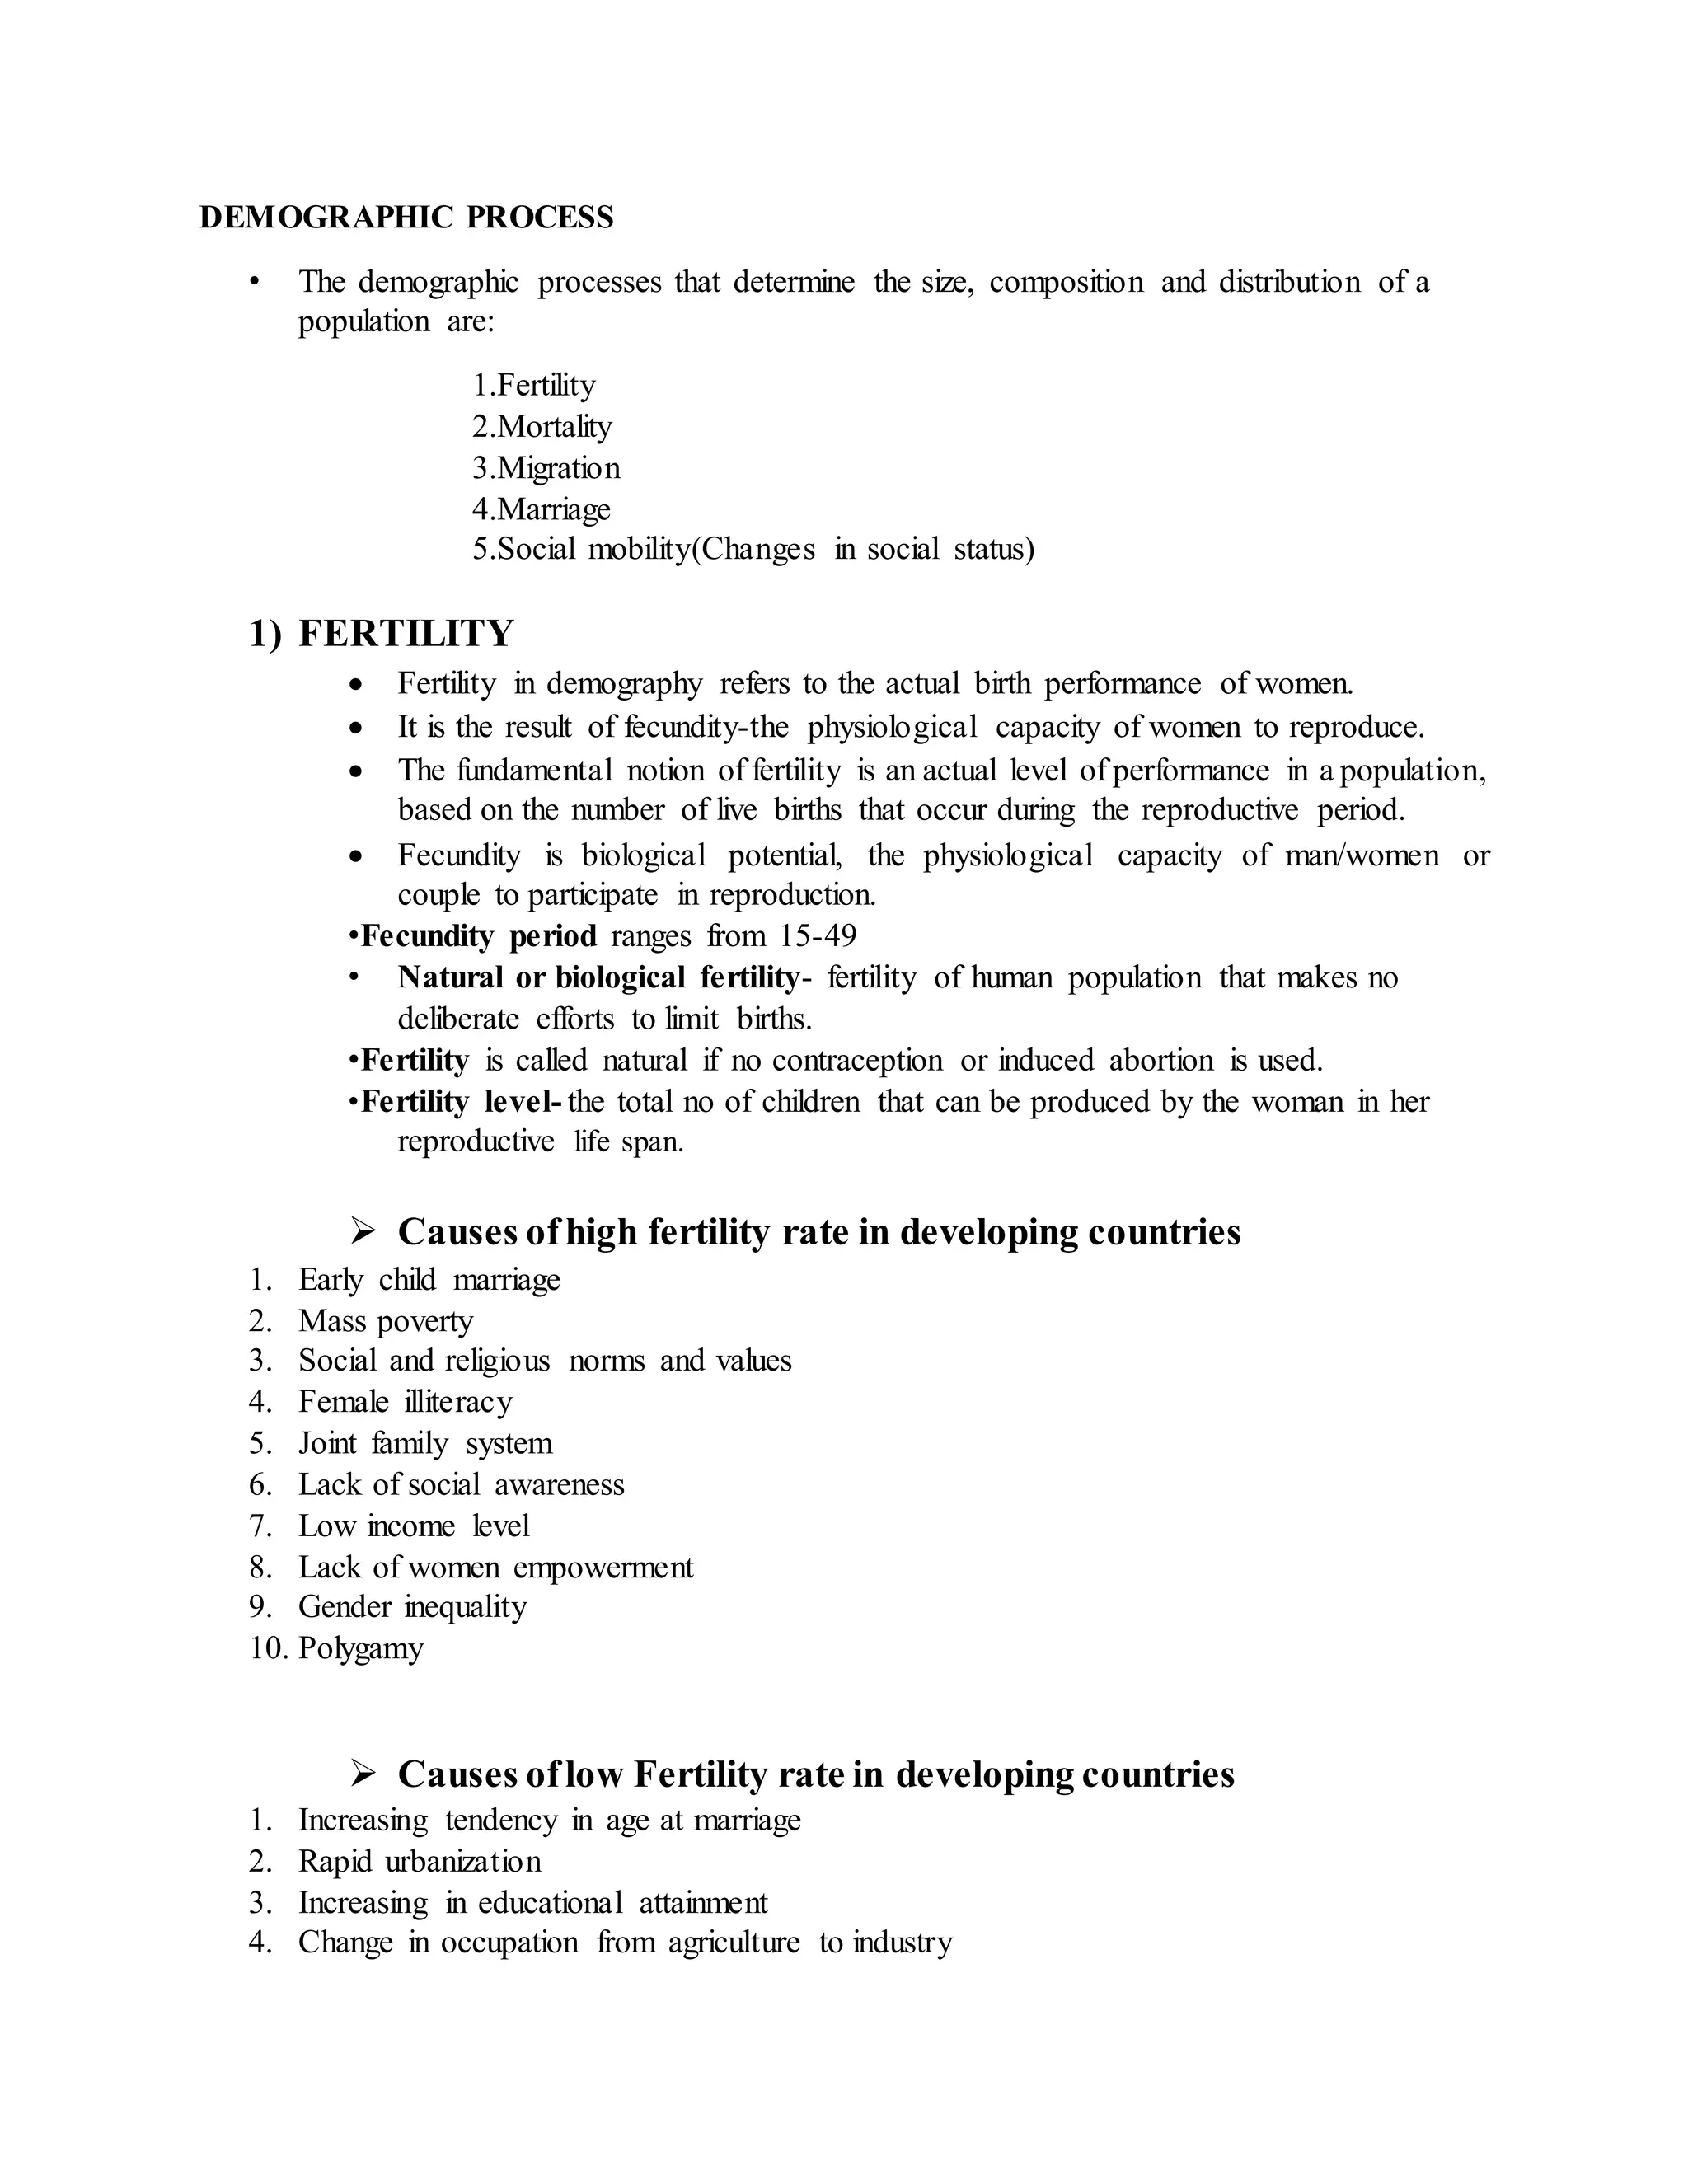
DEMOGRAPHIC PROCESS
• The demographic processes that determine the size, composition and distribution of a
population are:
1.Fertility
2.Mortality
3.Migration
4.Marriage
5.Social mobility(Changes in social status)
1) FERTILITY
 Fertility in demography refers to the actual birth performance of women.
 It is the result of fecundity-the physiological capacity of women to reproduce.
 The fundamental notion of fertility is an actual level of performance in a population,
based on the number of live births that occur during the reproductive period.
 Fecundity is biological potential, the physiological capacity of man/women or
couple to participate in reproduction.
•Fecundity period ranges from 15-49
• Natural or biological fertility- fertility of human population that makes no
deliberate efforts to limit births.
•Fertility is called natural if no contraception or induced abortion is used.
•Fertility level- the total no of children that can be produced by the woman in her
reproductive life span.
 Causes ofhigh fertility rate in developing countries
1. Early child marriage
2. Mass poverty
3. Social and religious norms and values
4. Female illiteracy
5. Joint family system
6. Lack of social awareness
7. Low income level
8. Lack of women empowerment
9. Gender inequality
10. Polygamy
 Causes oflow Fertility rate in developing countries
1. Increasing tendency in age at marriage
2. Rapid urbanization
3. Increasing in educational attainment
4. Change in occupation from agriculture to industry
5. Improvement in women empowerment
6. Change in marriage system
7. Extension of Industrialization
8. Demographic transition of third stage
9. Delayed marriage
10. Liberal abortion laws
11. Declining mortality like IMR, CMR and MMR
12. More employment opportunities
13. Desire for nucleus family
14. Women empowerment
15. Education and employment for women
16. Improved effective methods of fertility control
17. Adequate health services and facilities
18. Decreasing influence of religious values and norms.
19. Sufficient food supply
20. Increase in health facilities and services
21. Desire of small family norm
22. Legalization of abortion
23. Gender equality
24. Improvement in religious and social beliefs
 Causes of low fertility rate in Developedcountries
Factors affecting Fertility
1. Marriage or proportion of married women
2. Incidence of abortion
3. Use of contraceptives of birth control
4. The waiting time to conception
5. The gestation period
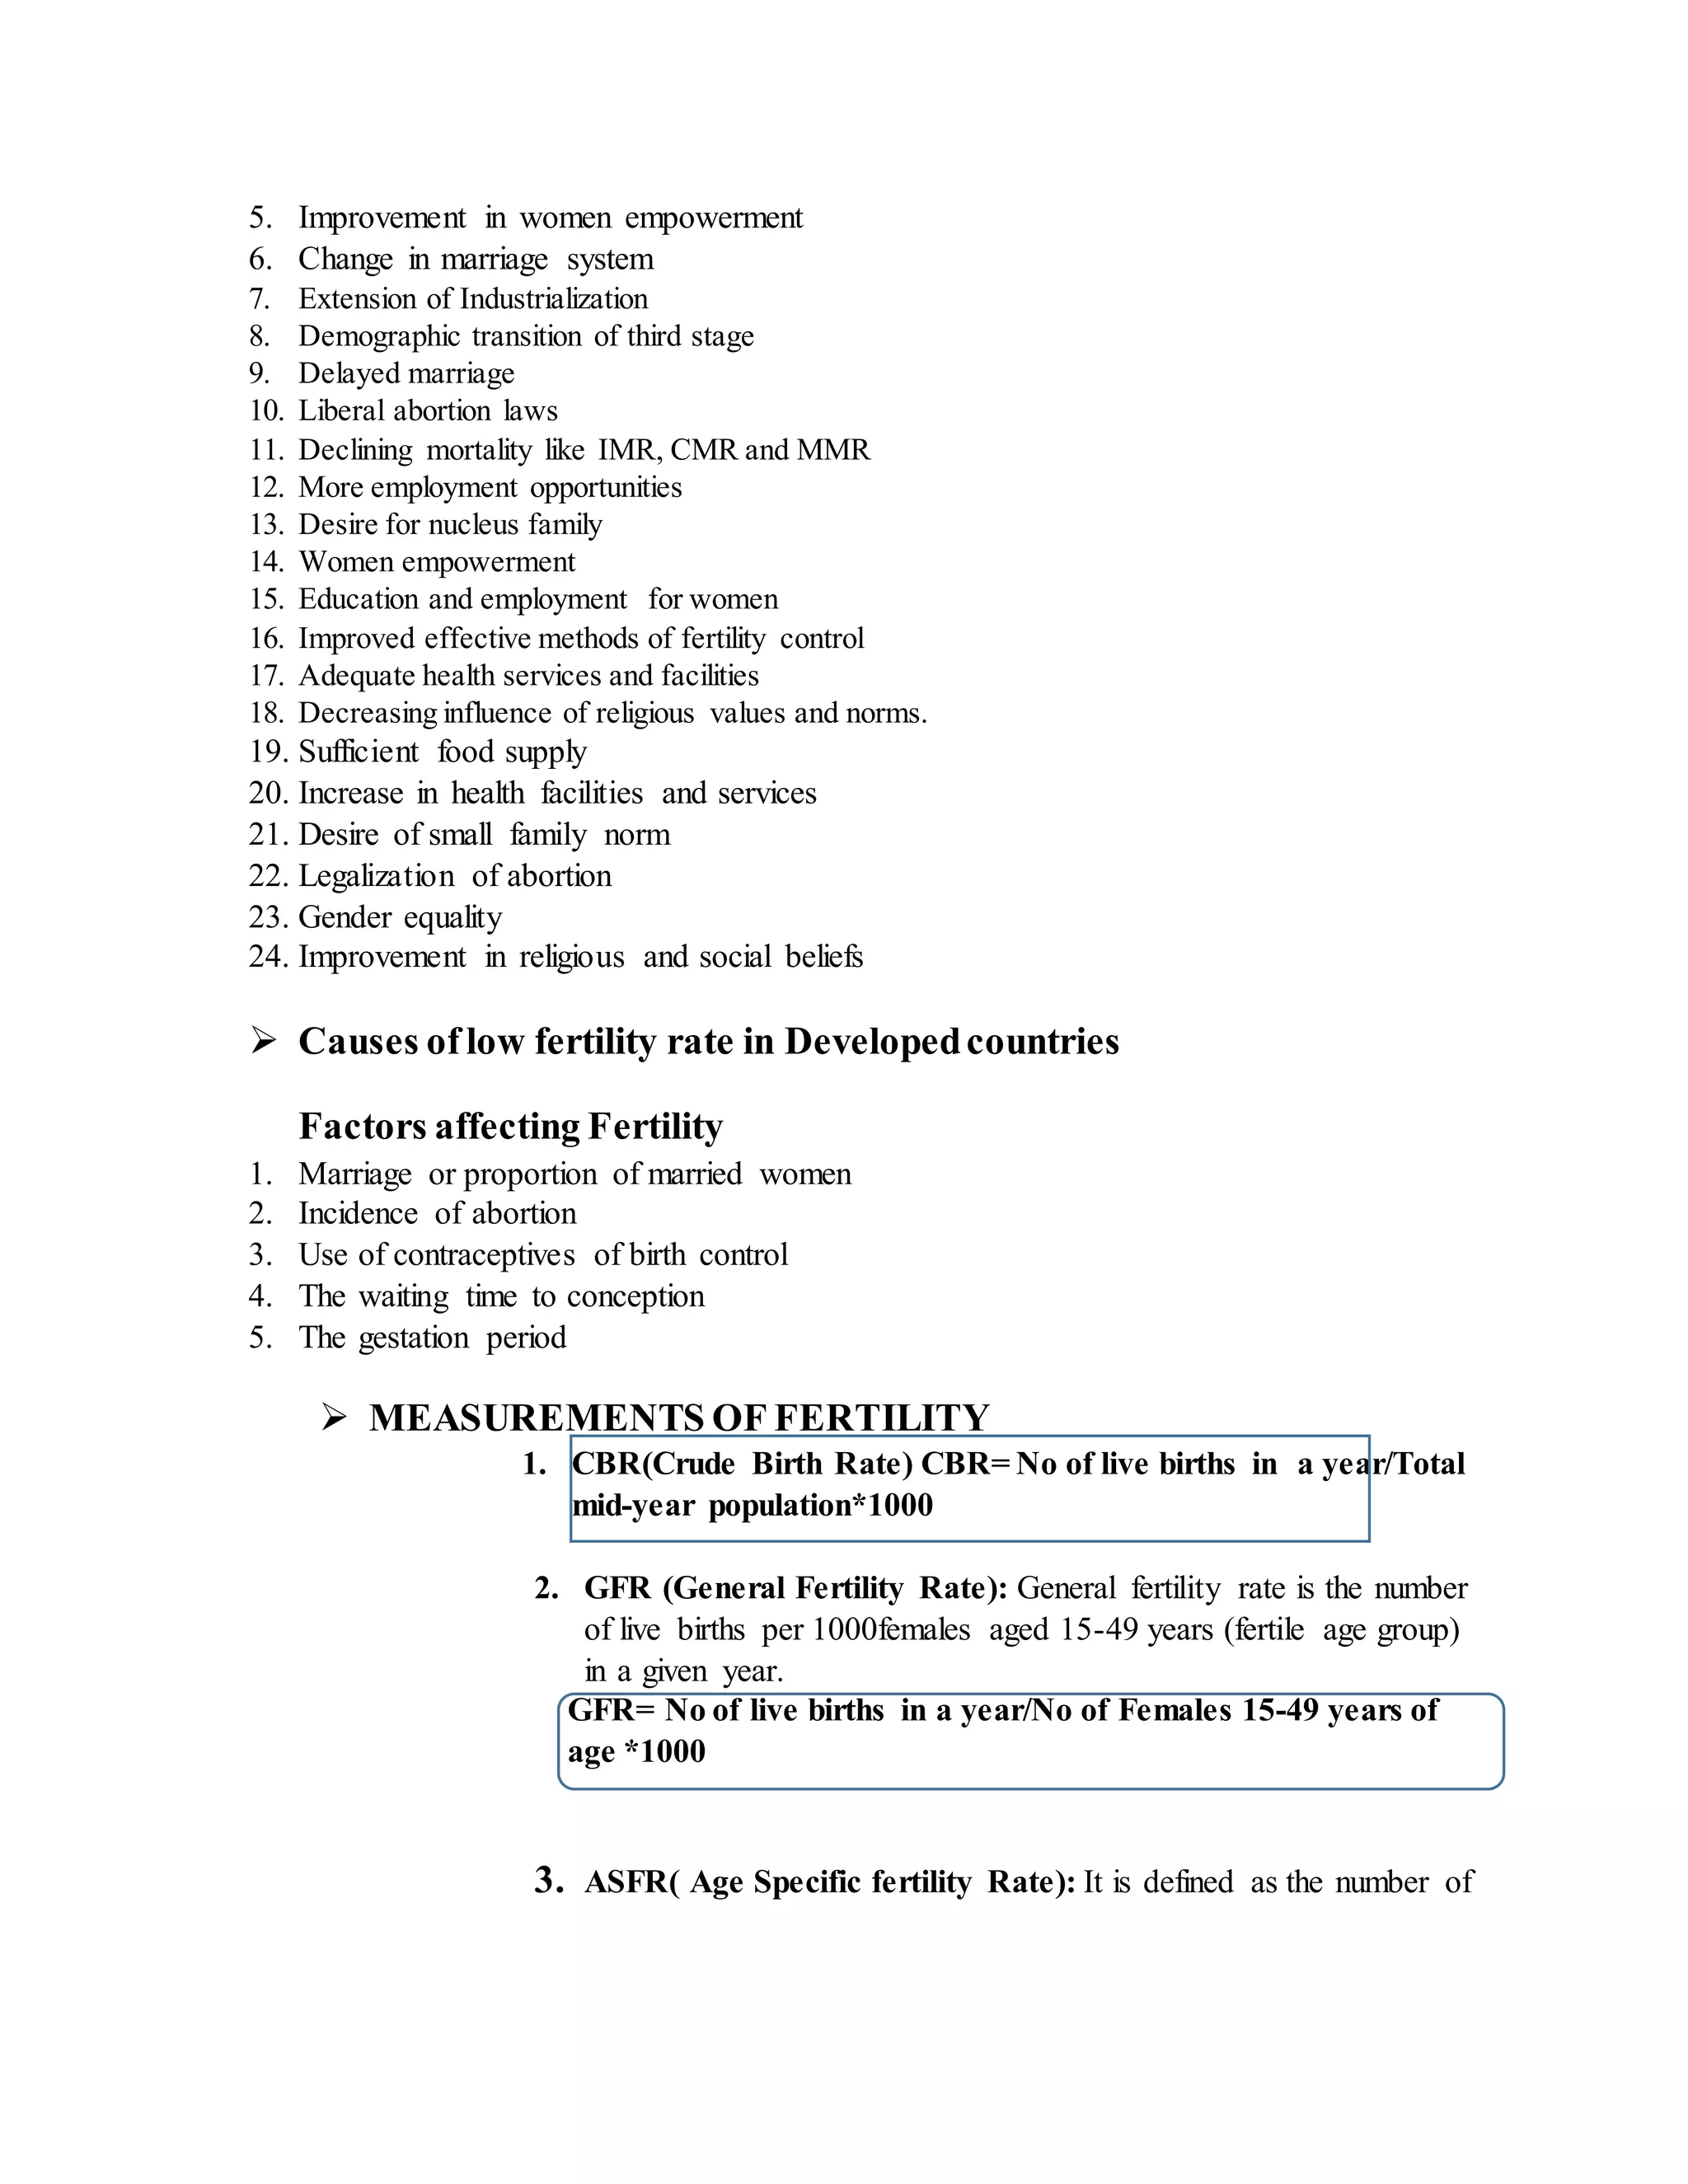
 MEASUREMENTS OF FERTILITY
1. CBR(Crude Birth Rate) CBR= No of live births in a year/Total
mid-year population*1000
2. GFR (General Fertility Rate): General fertility rate is the number
of live births per 1000females aged 15-49 years (fertile age group)
in a given year.
GFR= No of live births in a year/No of Females 15-49 years of
age *1000
3. ASFR( Age Specific fertility Rate): It is defined as the number of
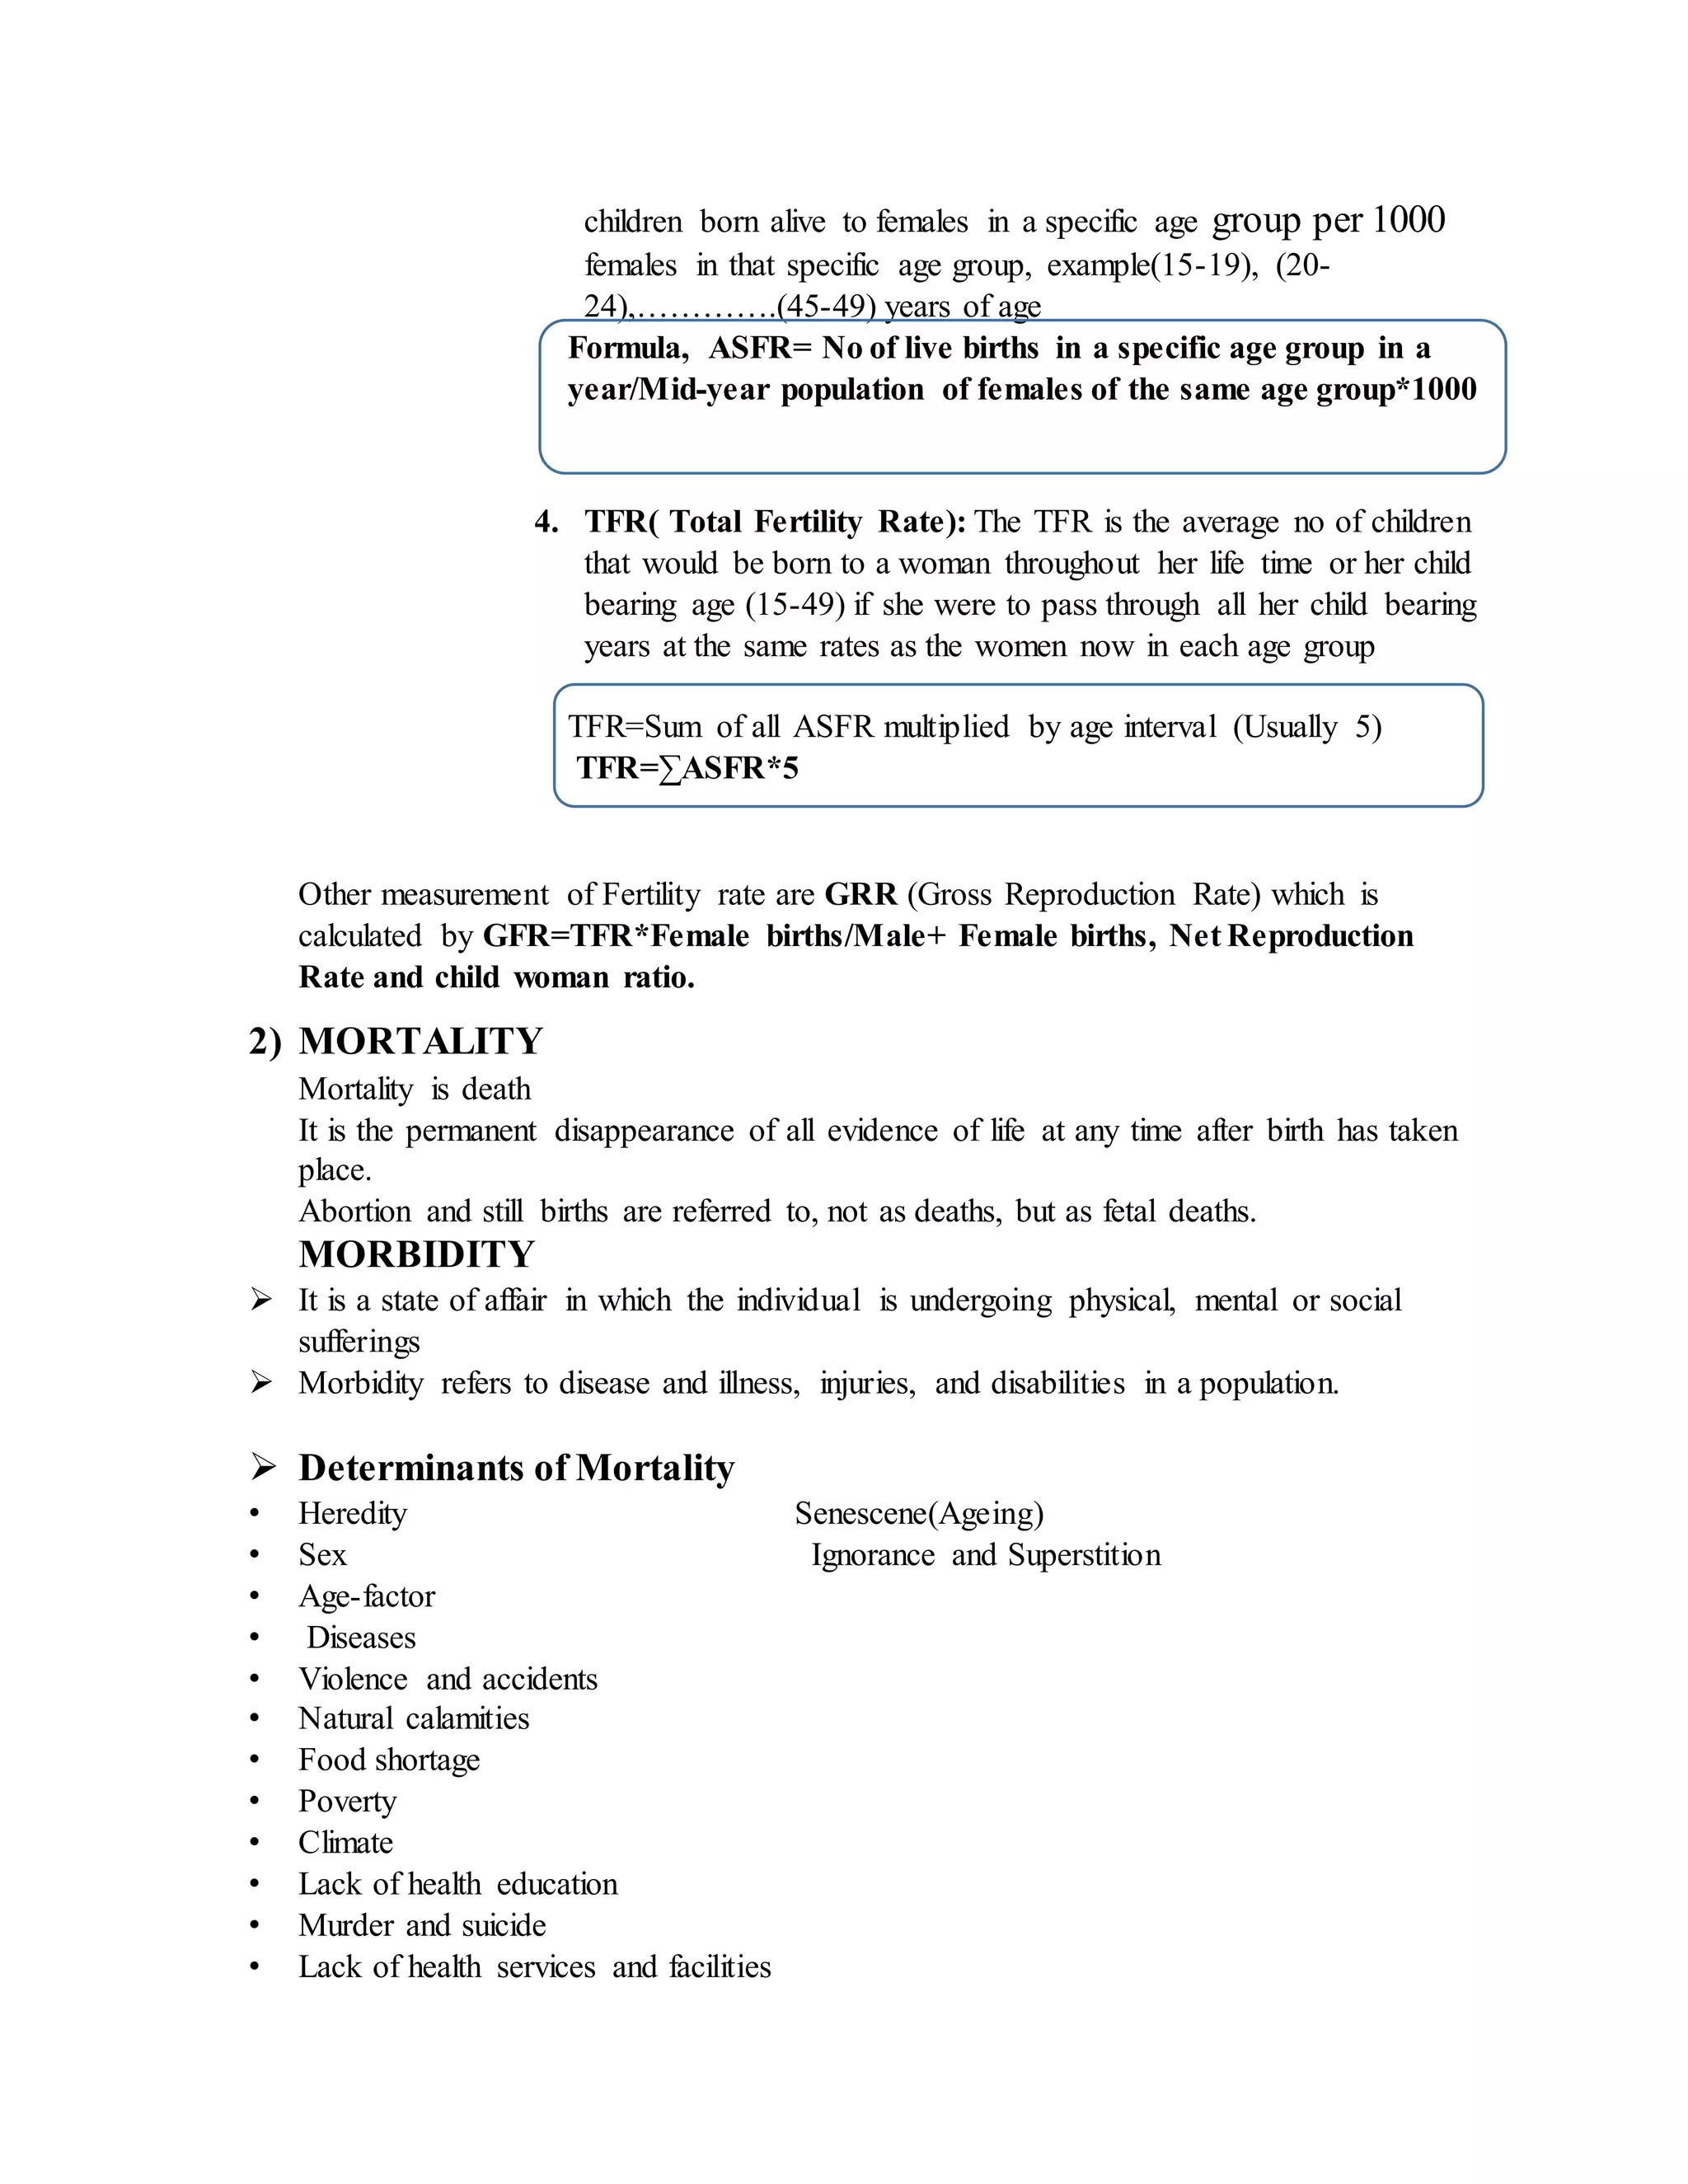
children born alive to females in a specific age group per 1000
females in that specific age group, example(15-19), (20-
24),………….(45-49) years of age
Formula, ASFR= No of live births in a specific age group in a
year/Mid-year population of females of the same age group*1000
4. TFR( Total Fertility Rate): The TFR is the average no of children
that would be born to a woman throughout her life time or her child
bearing age (15-49) if she were to pass through all her child bearing
years at the same rates as the women now in each age group
TFR=Sum of all ASFR multiplied by age interval (Usually 5)
TFR=∑ASFR*5
Other measurement of Fertility rate are GRR (Gross Reproduction Rate) which is
calculated by GFR=TFR*Female births/Male+ Female births, Net Reproduction
Rate and child woman ratio.
2) MORTALITY
Mortality is death
It is the permanent disappearance of all evidence of life at any time after birth has taken
place.
Abortion and still births are referred to, not as deaths, but as fetal deaths.
MORBIDITY
 It is a state of affair in which the individual is undergoing physical, mental or social
sufferings
 Morbidity refers to disease and illness, injuries, and disabilities in a population.
 Determinants of Mortality
• Heredity Senescene(Ageing)
• Sex Ignorance and Superstition
• Age-factor
• Diseases
• Violence and accidents
• Natural calamities
• Food shortage
• Poverty
• Climate
• Lack of health education
• Murder and suicide
• Lack of health services and facilities
• Environmental hazards
 Causes ofDecline in Mortality rate in Nepal
• Increased access to Health care services
• Safe and clean delivery
• Provision of safe abortion
• Focused treatment on childhood illnesses
• Education and awareness
• Control of communicable disease
• Tendency of late marriage
• Desire for small family norms
 MEASUREMENTS OF MORTALITY
1. CDR (Crude Deathrate): CDR is the number of deaths per 1000
population in a given year.
CDR=Total no of death in a year/Mid-year population*1000
2. ASDR(Age Specific Death Rate (Mortality):
ASMR is defined as number of death of persons in a specific age
group in a year per 1000 population of the same age group at the
middle of the year.
ASMR=No of deaths in a specific age group/Mid –year
population of the same age group*1000
3. IMR (Infant Mortality rate): It is the number of deaths of infants
under 1 year of age (0-11 months of age) per 1000 live births in a
given year.
IMR=No of death of children<1 year of age in a year/total live
births during that year*1000
4. Child Mortality Rate: It is the no of deaths of children 1-4 years of
age per 1000 children 1-4 years of age. It is sensitive indicators of
the health status of a community
CMR= No of deaths of children 1-4 year of age in a year/Total no
of children 1-4 years of age * 1000
5. Under Five Mortality Rate( <5 MR): I t is the no of death of
children under 5 years of age in a( 0-4 )per 1000 children under
five years of age
<5MR=No of deaths of children <5 yrs in a year/Total no of
children <5 years of age*1000
6. NNMR (Neonatal Mortality Rate): Neonatal period is the first
month of age of an infant. Death of infants under 1 months (<4
weeks), per 1000 live births
NNMR= No of deaths of infants<1 month in a year/Total no of
live births in the same year* 1000
7. Post –neonatal: Death of infants of age 1 months -11 months of
age per 1000 live births
 PNNMR= No of death of infants 1 month to 1 year of age in a
year/Total no of live births during the same year* 1000
8. MMR(Maternal Mortality Ratio): MMR is the number of
maternal deaths related to pregnancy, child birth and postnatal
complications per 1,00,000 live births.
MMR= No of deaths of women related to pregnancy, childbirth&
puerperium in a year/Total no of live births in the same
year*1,00,000
Other measurements of Mortality rate are Sex Specific Death Rates (SSDR), Case
Fatality rate (CFR)
MEASUREMENTOF MORBIDITY
1. Incidence rate (New cases of specific diseases)
2. Prevalence rate (Total new and old cases of specific diseases)
3. Case FatalityRate: The ratio of person dying from a particular diseases and
the number of people suffering from the same disease during a given period.
CFR= Totalno of deaths due to a particular disease/Totalno of
casesto the same disease*100
3) Migration
 Migration is the movement by people from one place to another with the intentions of
settling, permanently or temporarily in a new location. The movement is often over long
distances and from one country to another, but internal migration is also possible; indeed,
this is the dominant form globally. People may migrate as individuals, in family units or
in large groups.
 To move from one country, place, or locality to another in order to achieve better
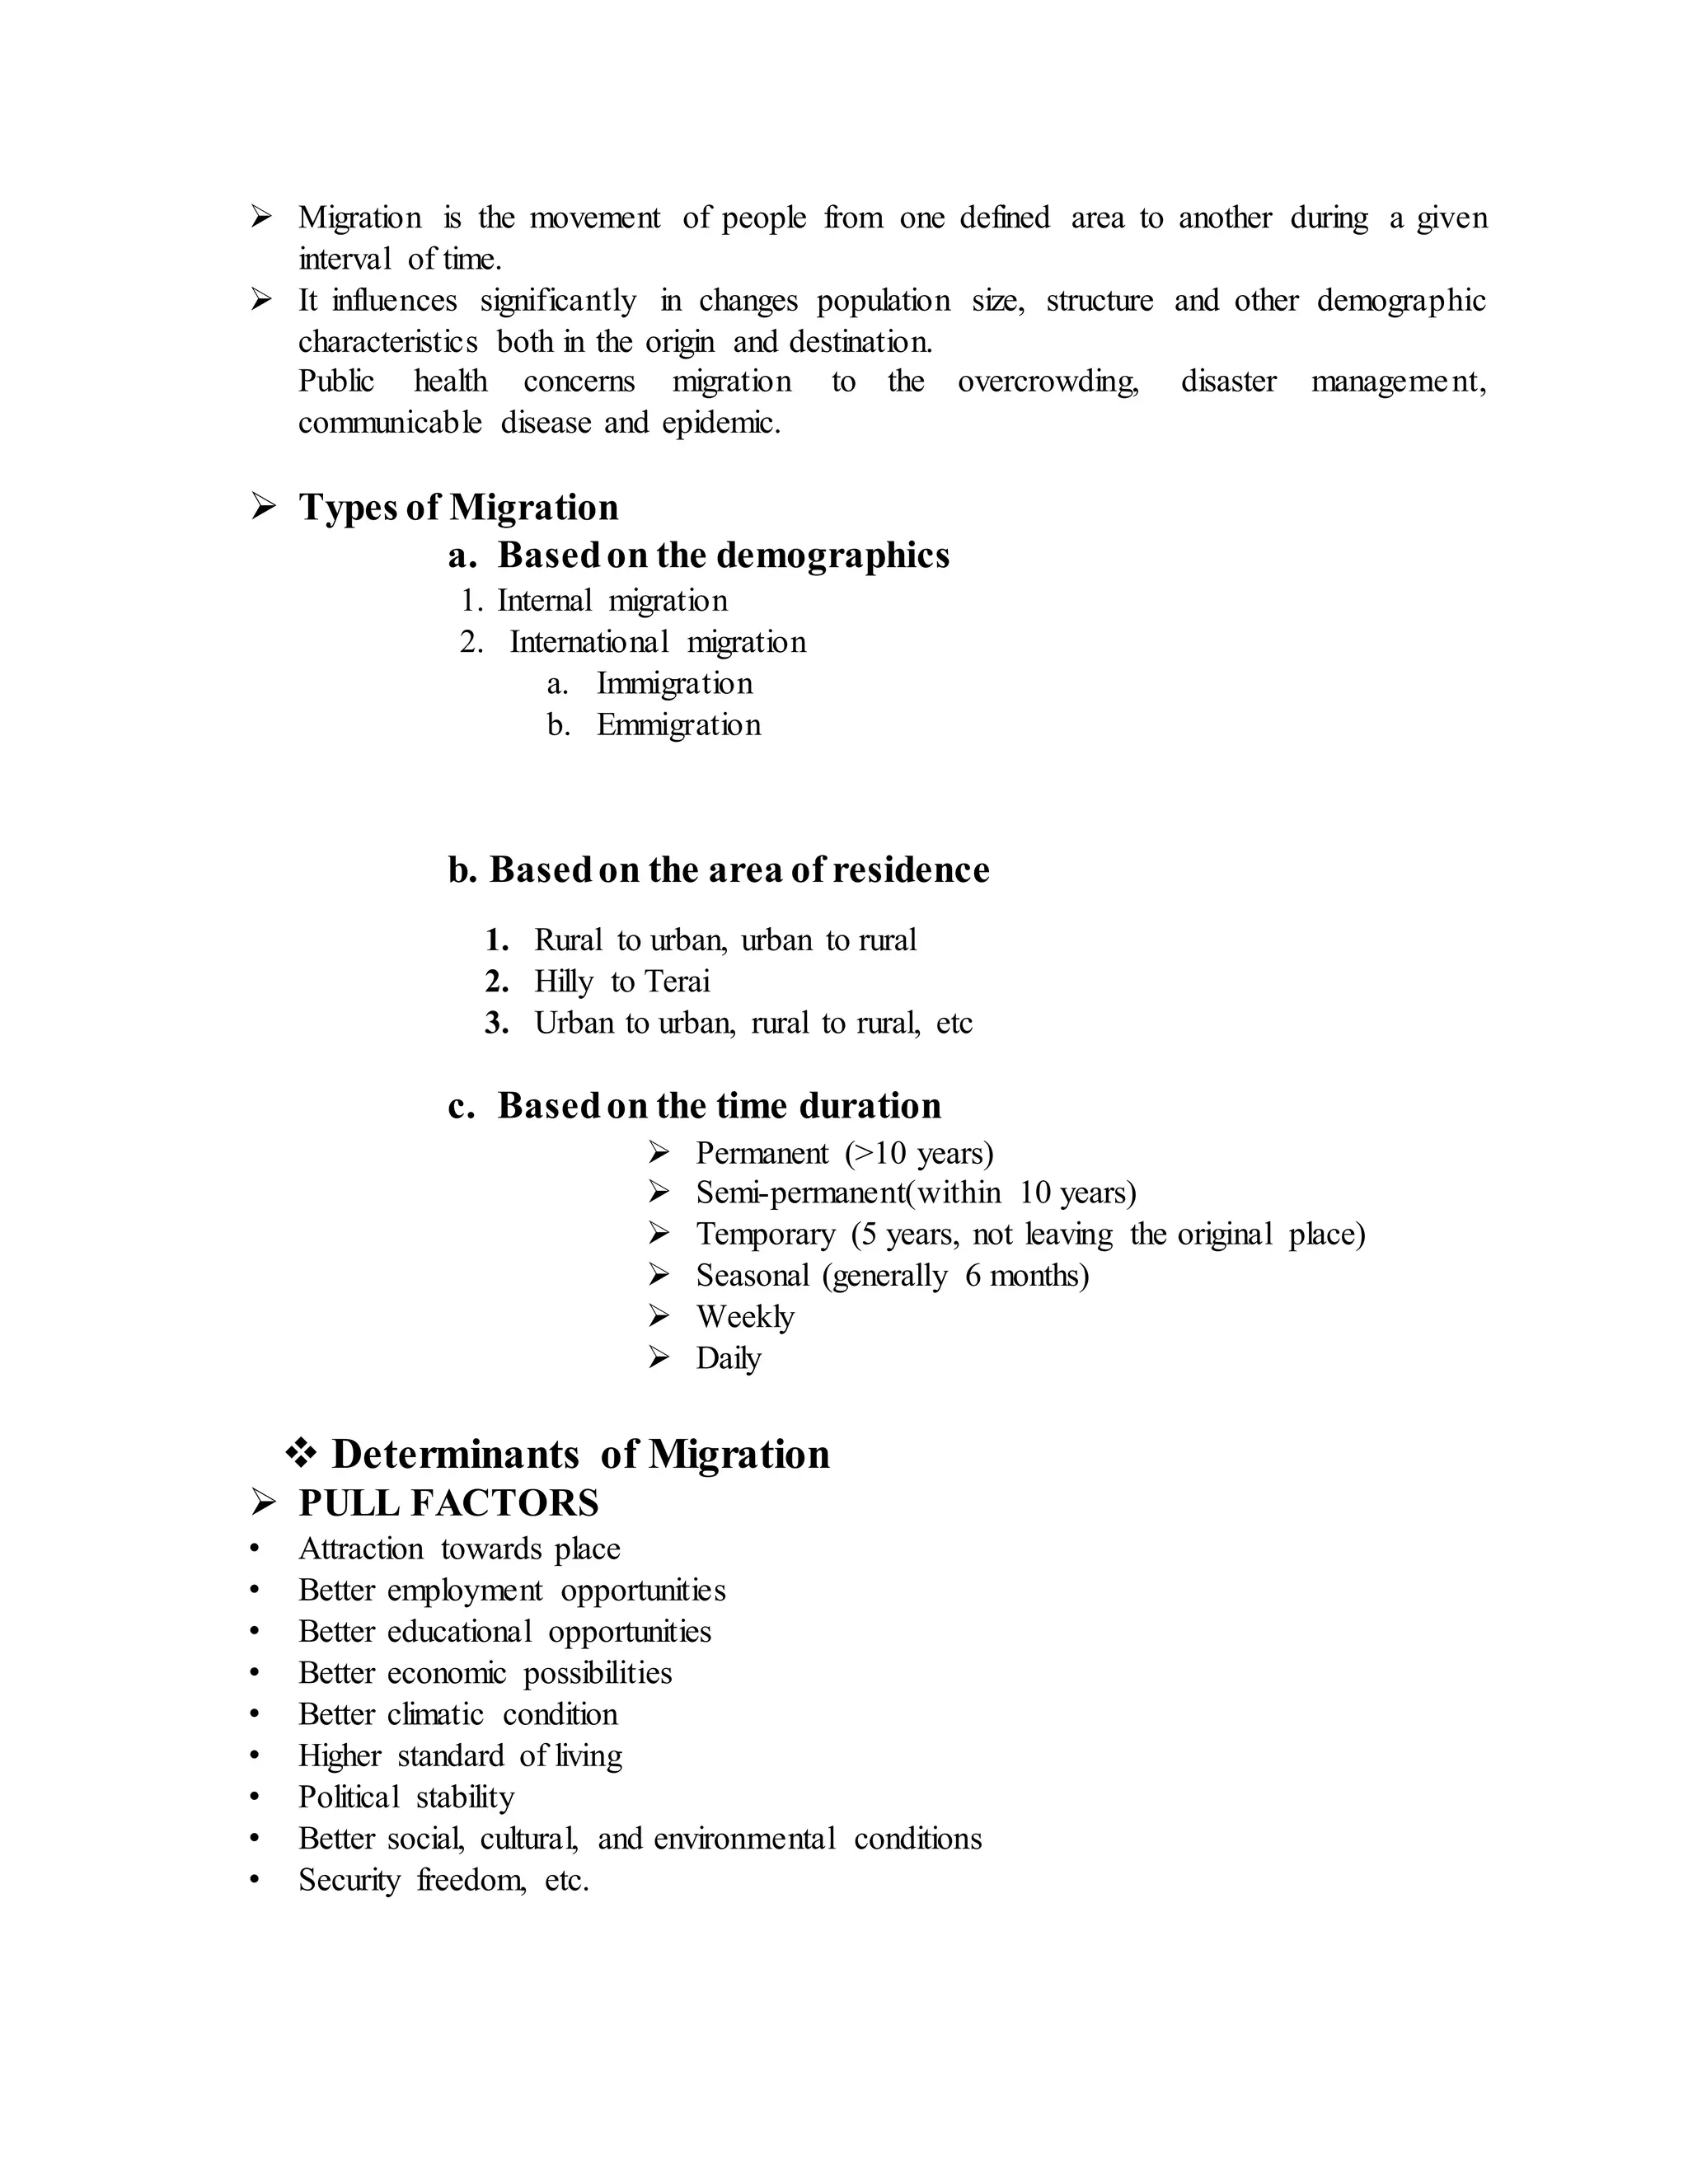
 Migration is the movement of people from one defined area to another during a given
interval of time.
 It influences significantly in changes population size, structure and other demographic
characteristics both in the origin and destination.
Public health concerns migration to the overcrowding, disaster management,
communicable disease and epidemic.
 Types of Migration
a. Basedon the demographics
1. Internal migration
2. International migration
a. Immigration
b. Emmigration
b. Basedon the area of residence
1. Rural to urban, urban to rural
2. Hilly to Terai
3. Urban to urban, rural to rural, etc
c. Basedon the time duration
 Permanent (>10 years)
 Semi-permanent(within 10 years)
 Temporary (5 years, not leaving the original place)
 Seasonal (generally 6 months)
 Weekly
 Daily
 Determinants of Migration
 PULL FACTORS
• Attraction towards place
• Better employment opportunities
• Better educational opportunities
• Better economic possibilities
• Better climatic condition
• Higher standard of living
• Political stability
• Better social, cultural, and environmental conditions
• Security freedom, etc.
 PUSH FACTORS
• Inadequate facilities for maintaining livelihood
• Lower wages at the place of origin
• Poverty, unemployment and lower standard of living
• Discrimination based on religion and politics
• Lack of personal development
• Dis-satisfaction with socio-cultural and religious aspect
• Lack of health, education and entertainment facilities
 Causes ofInternal Migration in Nepal
• Malaria control
• Construction projects in Terai
• Searching for economic prosperity
• Transportation and communication
• Resettlement program
• Facilities for education and health services
• Fertile land in terai
• Business
4) Marriage/Nuptiality
The legally or formally recognized union of two people as partners in a personal
relationship (historically and in some jurisdictions specifically a union between a man
and a woman) is known as marriage.
Nuptiality refers to marriage as a population phenomenon, including the rate at which it
occurs, the characteristics of persons united in marriage, and the dissolution of such
unions (through divorce, separation, widowhood, and annulment).
MEASUREMENTOF MARRIAGE
1) CMR( Crude Marriage Rate): It is defined as the no of marriages per year per 1000
mid-year population
CMR= Total no of marriages in an area during a year/Total mid-year population in
a given area during a year* 1000
2) General Marriage Rate (GMR): It is defined as the no of marriages per 1000
marriageable population in an area during a year.
GMR= Total no of marriages in a year/Total no of marriageable population (15+)*
3) Age Specific Marriage Rate (ASMR): It is defined as the number of marriages of
particular age group per 1000 persons of thet age group during the year.
ASMR= Total no of marriages for both sexes inspecific age group in a given
year/Total mid-year population of the same age group*1000
4) Crude Divorce Rate: CDR is defined as the no of divorces per 1000 mid-year
population in a certain period of time,
CDR=Total no of divorces in a year/Total mid-year population*1000
Other measurements of marriage are General Divorce Rate, Age Specific Divorce
Rate ASDR=Total no of divorces in a specified age group/Total no of married
population of same age group*1000
GDR (General Divorce Rate): GDR= Total no of divorces during a year/Total no of
population at divorceable age* 1000
 Divorceable age=15+
5) SocialMobility (DEMOGRAPHIC PROCESS)
A change in status (for example, an occupational change)
 Sources ofDemographic Information
1. Census
2. Registration of vital events(Records)
3. Sample Surveys
4. Population Registers
5. Administrative records
6. International and National Publications
1. CENSUS
• Census is defined as an enumeration or complete population count at a point in time within a
specified geographical area.
• A census is the total process of collecting, compiling, evaluating, analyzing and publishing
demographic, economic and social data pertaining at the specified time, to all persons in a
country or in a well delaminated part of the country. UN(1958)
Four essentialfeatures ofPopulation census (UN):
1. Each persons are recorded separately.
2. The census covers a precisely defined territory and includes every person present or
residing within its scope.
3. The population is enumerated with respect to a well-defined reference period.
4. The census are taken at regular intervals.
Contents of Population census (UN)
Personaland Household characteristics:
 Age, sex, relationship to head of household, marital status, age at marriage,
children born alive, children living, citizenship, literacy, school attainment ,
educational qualification, national and /or ethnic group, language ,religion.
 Geographic characteristics
 Place of enumeration, place of usual residence, place of birth, duration of
residence, place of previous residence, place of work.
 Economic characteristics
 Type of activity, occupation, status, main source of livelihood.
Methods/Techniques ofCensus
1. De-Jure method
2. De-facto method
3. Modified de-jure method
1. De- Jure method
This technique is the counting of people according to the permanent place of location or
residence.
It also count the people who has been living at least for a period of six month continuously.
Advantages
1. It gives permanent picture of the community
2. It provides more realistic and useful statistics.
Disadvantages
1. Some person may be omitted from the count. A household member who is
temporarily away from home may be missed from being counted unless the
enumerator makes sure that nobody is missing.
2. Some may be counted twice.
3. Information collected regarding persons away from home is often incomplete or
incorrect.
2. De-Facto Method
This method refers to counting persons where they are present at the time of census
period.
Students in hostel, armed force in the barracks are counted at the place where they are
found.
Persons without fixed residence, homeless, beggars, vagrants, sage, hermit’s nomads are
also counted.
Advantages
1. There is less chance for the omission ofpersons from the count.
Disadvantages
1. It provides incorrect picture of the population in a community
2. Vital statistics are usually distorted (In areas with high migration)
3. Difficult to obtain information regarding persons in transit. These
are persons who are, for example travelling and have left their area
of permanent residence but haven’t reached the area of destination
during the census day.
3.ModifiedDe-Jure method
• Combination of both de-jure and de-facto method
• Person is enumerated on the basis of normal / usual residence.
• Normal/usual residence means the place where one is living for at least defined period
continuously(e.g 6 months)
• Person without fixed residence, homeless, beggars, vagrants, sage, hermits nomads are
also counted.
History of Census in Nepal
• During the time of Bhimsen Thapa (1806-1838) adult males were counted.
• Officially 1st Census of Nepal was taken in 1911 which was followed in 1920, 1930 and
1941.
• They were limited on gathering information of only household number and their land
ownerships.
• 1st Scientific census was carried out in 1952-54 and it was followed in 1961, 1971, 1981,
1991, 2001 and 2011.
2. Vital Registration
• It refers to those events concerned with the life of individual from birth to death. Such as
birth, death, fetal death, still birth, marriage, divorce, separation, adoption, legitimating,
recognition.
• According to UN hand book, Vital registration system is the legal registration, statistical
recording and reporting of the occurrence of and collection, compilation, analysis,
presentation and distribution of statistics pertaining to vital events which in turn include
live births, fetal deaths, deaths, marriage, divorce, adoption, abortion, legitimizations,
recognition, annulments and legal separations.
History of Vital registrationin Nepal
• 1st time introduced in 1962 under the act of village panchayat law of 1962.
• Started through pilot project in 3 Panchayat of Kathmandu valley in 1964 which was
discontinued.
• In 1972 it was carried out by FP/MCH project in two district and terminated after four
years in 1976.
• It was launched in 10 districts in 1976 under the Vital Registration Act 1976, covered 40
districts in 1981/82 and all 75 districts in 1990.
• 3. Sample Surveys
• It is the process of collecting, compiling, evaluating and publishing demographic, social
and economic data about the sample population at a specific time that help to inter the
general behavior of the entire population.
Types
• Longitudinal Sample surveys
• Cross-sectional sample surveys
• Some surveys in Nepal
• 1996-2016 : Demographic and health survey
• 1996: National health survey
• 1976: Nepal fertility survey
• 1984: Fertility and mortality survey
4. Population Registers
It is a system of record keeping of all events from birth to death (marriage, childbirth,
migration, divorce, separation) of individuals in separate card of file.
5) Administrative Records
These are the collection of information on population for their own purposes by different
administrative or managerial authorities.
These may consist of consumer ration card records, voter lists, insurance and welfare
records, school enrolment and telephone directories, business directories etc.
They serve the purposes of collectors, they may not necessarily provide demographic
information and they may not be the complete ones.
6) International and NationalPublications
These are the secondary sources of data they are official or unofficial textbooks,
yearbooks, statistical books, periodical journals, research reports etc.
Some major Publications
1. Demographic yearbook (1948)
2. Statistical yearbook (1948)
3. Monthly Bulletin of Statistics (1947)
4. In Nepal CBS
Population Composition
• Tools ofDemography
1. Count
2. Rate
3. Ratio
4. Proportion
1) Count: It is the no of cases in a category or the frequency. This is often used to compare the
numbers especially when the population is not much large.
2) RATE
A rate measures the occurrence of some particular event in a population during a given
time period. In rate numerator is the part of the denominator and multiplier is 100, 1000,
10000, 100000 or so on.
Rate denotes the risk of developing a condition. All rate is a ratios, but all ratios are not
rates.
Rate always requires time specification usually a calendar year)
It measures the probability of some particular event.
• It is the number of events (numerator) divided by the total population exposed to the risk
of that event (denominator) multiplied by a constant.
• Numerator should always be included in denominator
• In other words rate is the part or proportion of numerator in terms of denominator that is
multiplied by a constant, e.g., by 100 for the %
• E.g Crude rate, specific rate
A rate measures the occurrence of some particular event (Example death) in a population
during a given time period.
Rate=Vital event/Population at risk
Example: Death rate= No of deaths in one year/ Midyear population *1000
Note: A rate comprises the following elements:
 Numerator
 Denominator
 Time specification
 Multiplier or constant (100, 1000, 10, 0000 etc.)
 All rates are ratios, but all ratios are not rates.
3)RATIO
Ratio measures a relation in size between two random quantities.
The numerator is not the part of the denominator, and both numerator and denominator are
unrelated.
It is the expression of the relationship between a numerator and denominator in which
numerator is not includes in the denominator.
• Ratio is the product of numerator divided by the denominator, where numerator is not the
subset of denominator.
• There is no Multiplier in Ratio.
• The numerator or denominator in ratio may involve of interval or time specification.
• E.g.: Sex ratio, doctor population ratio, Child women (MMR) ratio etc.
• Ratio is a quotient of any two demographic quantities. It is the result of dividing one
quantity by another.
• a/b, a:b
a. Example: Sex Ratio= Male/female
• b.Doctor to Population ratio= No of Doctors/No of Population
4) PROPORTION
A proportion indicates the relation in magnitude of a part of the whole.
The numerator is always included in the denominator. Proportion is always expressed in
percentage (%)
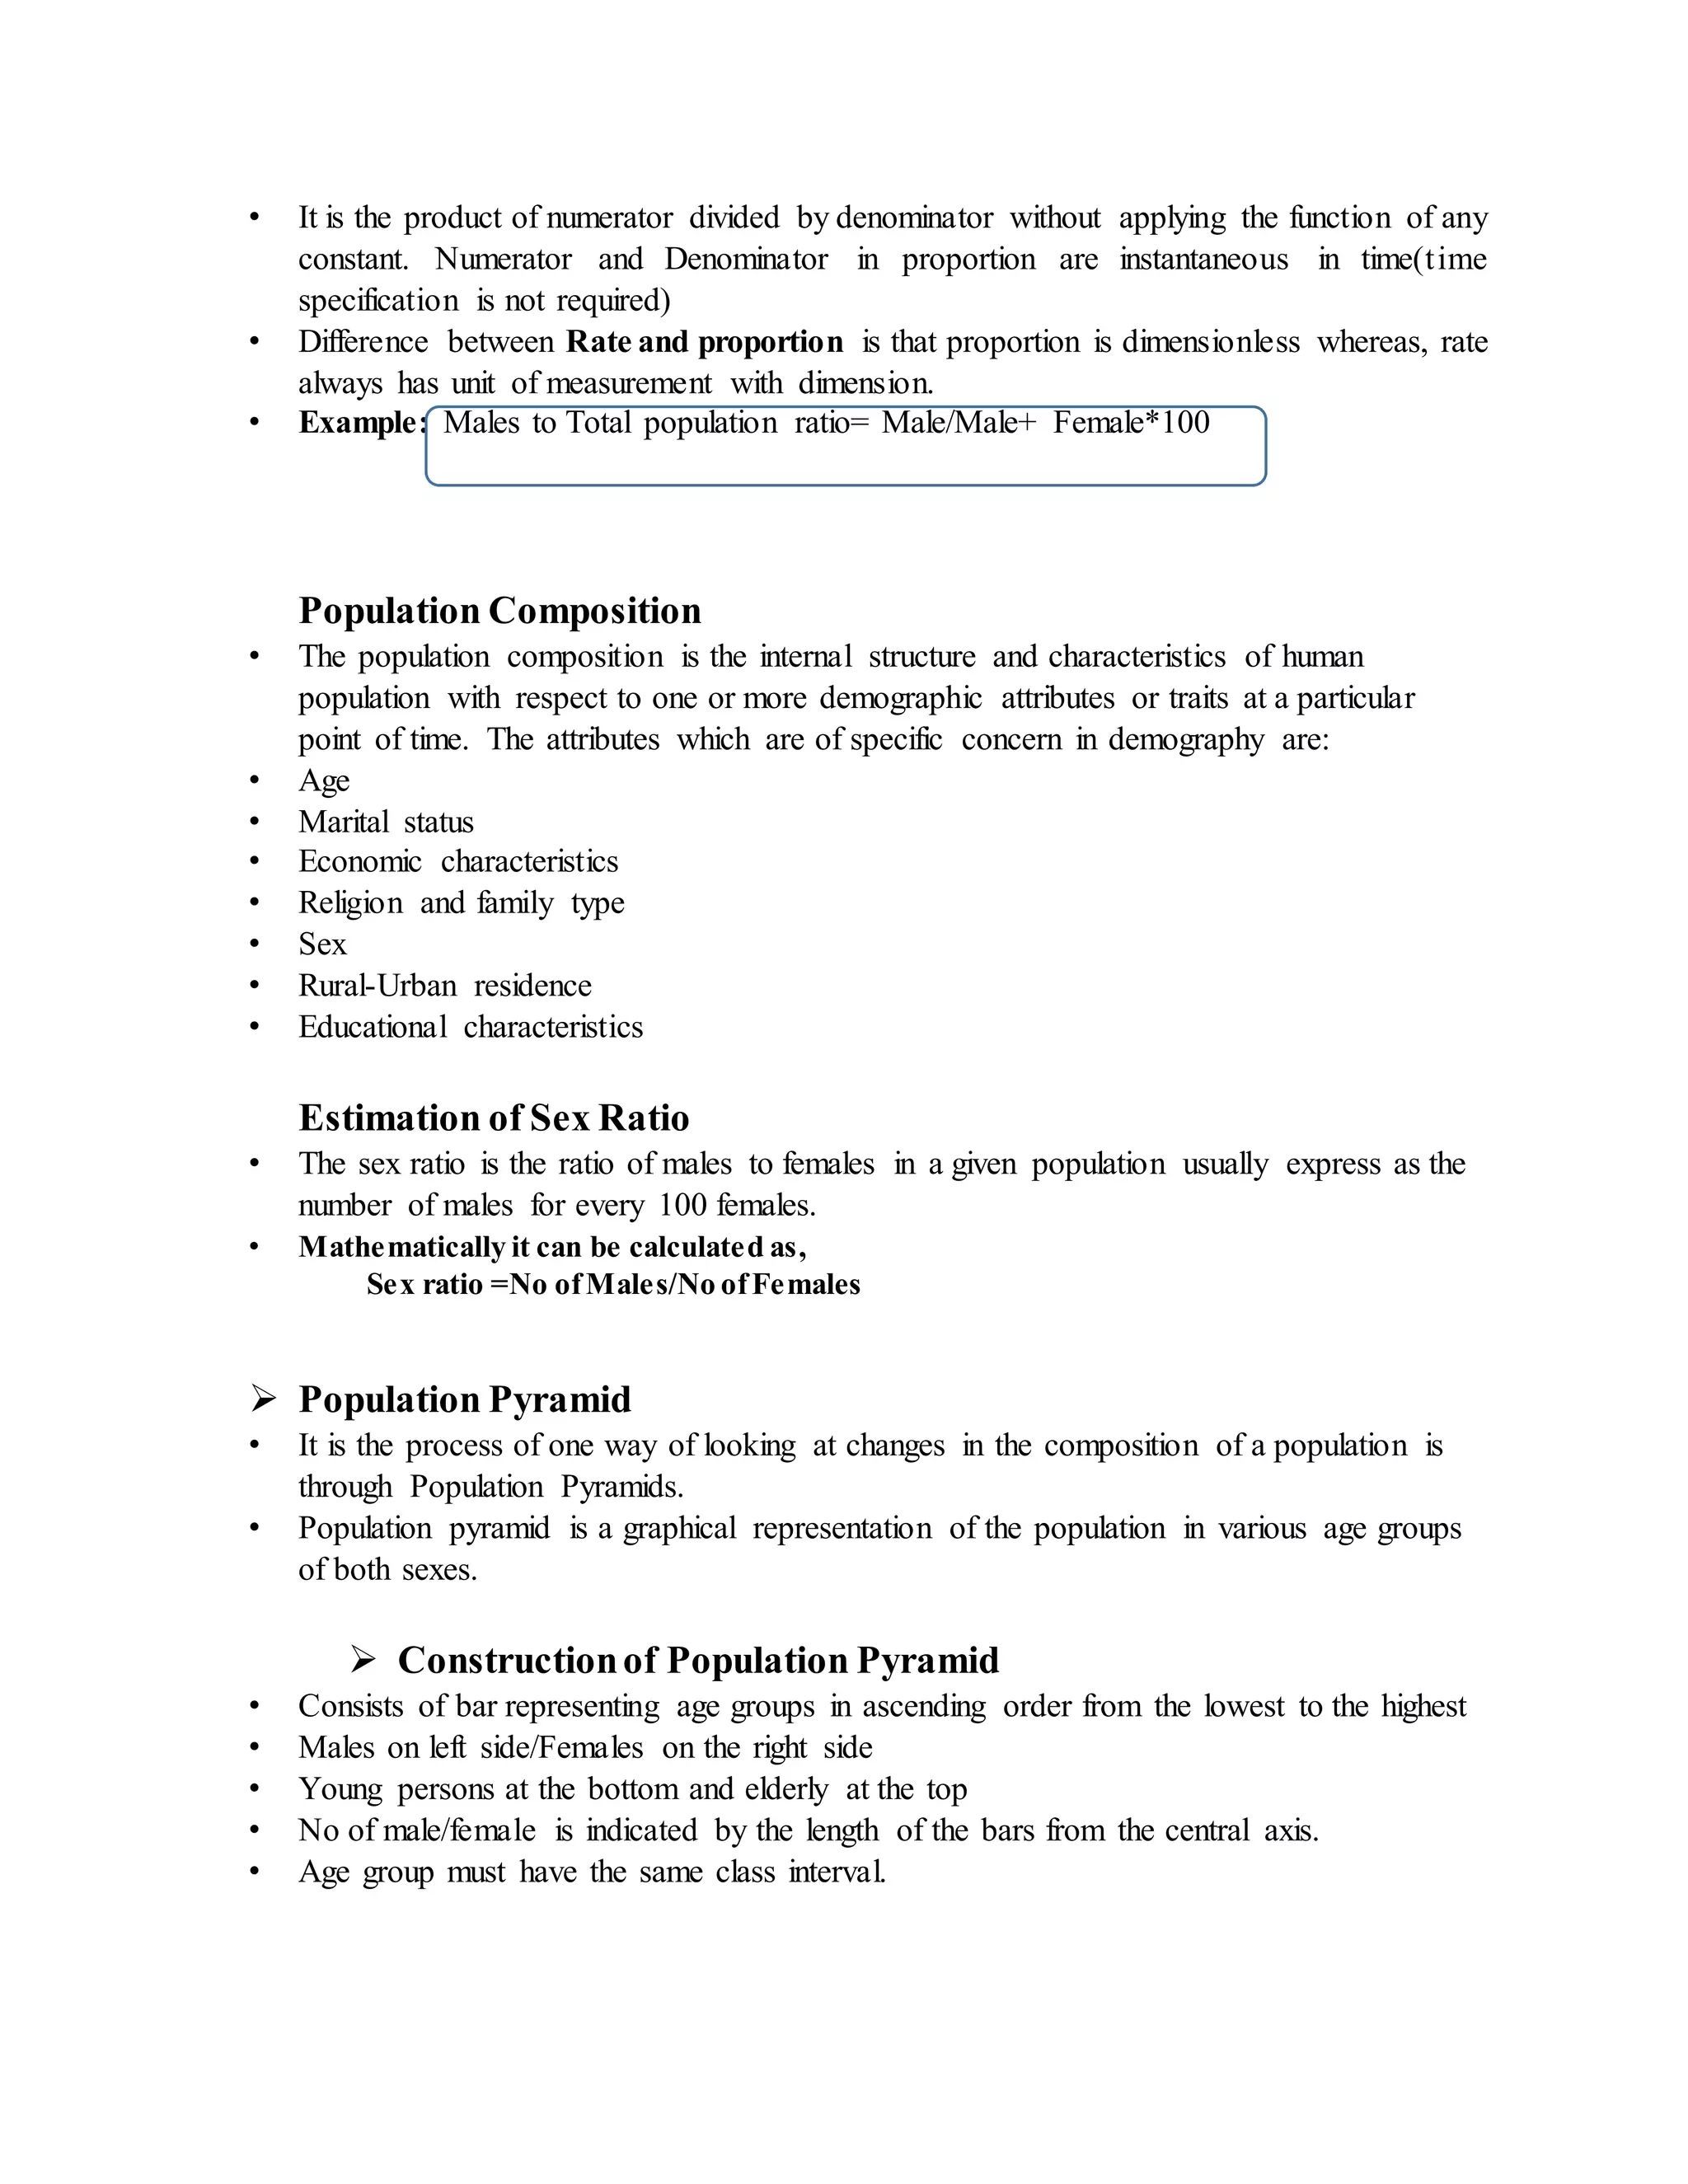
• It is the product of numerator divided by denominator without applying the function of any
constant. Numerator and Denominator in proportion are instantaneous in time(time
specification is not required)
• Difference between Rate and proportion is that proportion is dimensionless whereas, rate
always has unit of measurement with dimension.
• Example: Males to Total population ratio= Male/Male+ Female*100
Population Composition
• The population composition is the internal structure and characteristics of human
population with respect to one or more demographic attributes or traits at a particular
point of time. The attributes which are of specific concern in demography are:
• Age
• Marital status
• Economic characteristics
• Religion and family type
• Sex
• Rural-Urban residence
• Educational characteristics
Estimation of Sex Ratio
• The sex ratio is the ratio of males to females in a given population usually express as the
number of males for every 100 females.
• Mathematically it can be calculated as,
Sex ratio =No ofMales/No ofFemales
 Population Pyramid
• It is the process of one way of looking at changes in the composition of a population is
through Population Pyramids.
• Population pyramid is a graphical representation of the population in various age groups
of both sexes.
 Constructionof Population Pyramid
• Consists of bar representing age groups in ascending order from the lowest to the highest
• Males on left side/Females on the right side
• Young persons at the bottom and elderly at the top
• No of male/female is indicated by the length of the bars from the central axis.
• Age group must have the same class interval.
Shape of Pyramid
Based on the shape and structure of the pyramid, Population pyramid can be divided into three
categories:
1. Expansive (broad base)
• Rapid population growth
• This indicates high percentage of young population
• This type of pyramid represents high birth and large no of people are in the younger ages.
• Maximum no of population is found in 0-4 years and it decreases as the age increases.
• This type of pyramid is found in developing countries.
2. Constructive
• In this type of pyramid, small no of people found in the younger ages.
• Population of 0-4 years is found less as compared with 5-9 years.
• Population increases as the year increases.
• Population goes on decreasing after the adult stage and shapes like a spindle
• Found in developed countries where Family planning is successful
• 3. Stationary
• This represents stable birth rate for many years.
Roughly equal no of people are found in all age groups, tapering off gradually at the
older age.
Population Pyramid
SUBUNIT 5.2
MEASUREMENTS OF POPULATION DISTRIBUTIONS
• The distribution of population can be classified according to Residential and
Geographical variation.
1. ResidentialType:
• Urban- Rural Population: Urban- rural areas are in general differentiated by
facilities like electricity, transportation, water supply, opportunity, etc. Some measures of
the type of residence composition are:
 Percentage distribution of population in various geographic regions or by size of
locality of residence.
 Degree of urbanization
 Tempo of urbanization
 Urban rural ratio
2. EcologicalDistribution: It is the distribution ofthe population according to
ecological division ofthe country. They are;
• Mountain : 7.3%
• Hill : 44.3%
• Terai : 48.4%
• Urban population : 16% (approx.)
• Rural Population : 84% (approx.)
3. Others types of distribution:
• Distribution according to the political division of the country: developmental region, zone,
districts, municipality, VDCs,etc.
• Caste wise distribution
NEPAL POPULATIONGROWTH TRENDS
Population growth trends
WORLD POPULATION GROWTHTREND
Global human population growth amounts to around 83 million annually, or 1.1% per year.
The global population has grown from 1 billion in 1800 to 7.6 billion in 2017. It is
expected to keep growing, and estimates have put the total population at 8.6 billion by
mid-2030, 9.8 billion by mid-2050 and 11.2 billion by 2100. Many nations with rapid
population growth have low standards of living, whereas many nations with low rates of
population growth have high standards of living.
Annual Population Growth in Nepal
• NEPAL: 2.25%
• Developed countries: 0.2%
• World: 1.2%
SUBUNIT 5.3: POPULATION GROWTH
 Population growth
• Population growth is the increase in the number of individuals in a population.
• An increase in the number of people that reside in a country, state,county, or city. To
determine whether there has been population growth, the following formula is used: (birth
rate + immigration) - (death rate + emigration.
• Population growth is the relative increase in the total number of population in any particular
area.
• Population growth is due to natural increase and net migration of a particular area or a
country. When the birth rate is comparatively higher than that of the death rate , there occurs
population growth. To some extent higher immigration rate may be the cause of population
growth, e.g. United States
 Causes ofPopulation Growth
• Poverty:
In Nepal, around 25 percent of Nepalese are below the poverty line. They can't afford to eat
hygienic food, have no access to regular health checkup. Similarly, 76% people are farmers they
require more agro-labor force which is compensated by more birth of the children. Most of the
women are unemployed.
• Illiteracy:
Around 34% people are illiterate in Nepal according to the result of population census 2011 AD.
Till, masses of people are not aware of the evil consequences of population growth. Among the
illiterate, 57.2% are female. Thus, population growth is promoted by the situation of illiteracy of
Nepal.
• Early marriage:
It is one of the causes for high population growth. It exists in Nepal due to socio-cultural norms.
Parents feelthemselves free from the responsibility of their child after marriage. It is also
responsible for the high population in Nepal. It is not checked by a legal provision.
• Religious and SocialBelief:
It is very strong in rural areas of Nepal. Most of the people believe in God. They feel son as a
compulsion and require for rite and rituals. They also believe children are the gift of God. By the
reason, people have accelerated the population size.
• Growing Internal Migration:
The size of the population in Nepal has been growing due to the open international migration,
practically from India, Bhutan and Tibet. The nation would be unable to control the population
growth unless it adopts some measures to stop this type of migration trend in future.
 ASPECTS OF POPULATION GROWTH
• POSITIVE ASPECTS:
• Economic Boost
• Increased Innovation: Agriculture, Medicinal , Industrial
• Population Growth as a Sign of Social Health
• Although not a direct effect of population growth, growing societies often signify healthy
societies. For instance, population growth often signals lower mortality rates through advances in
medicine and science.
• Manpower availability: More productivity due to employment of large no of population in
different sectors
• Settlement of scared populous area
• Utilization of resources
• Urbanization and industrialization
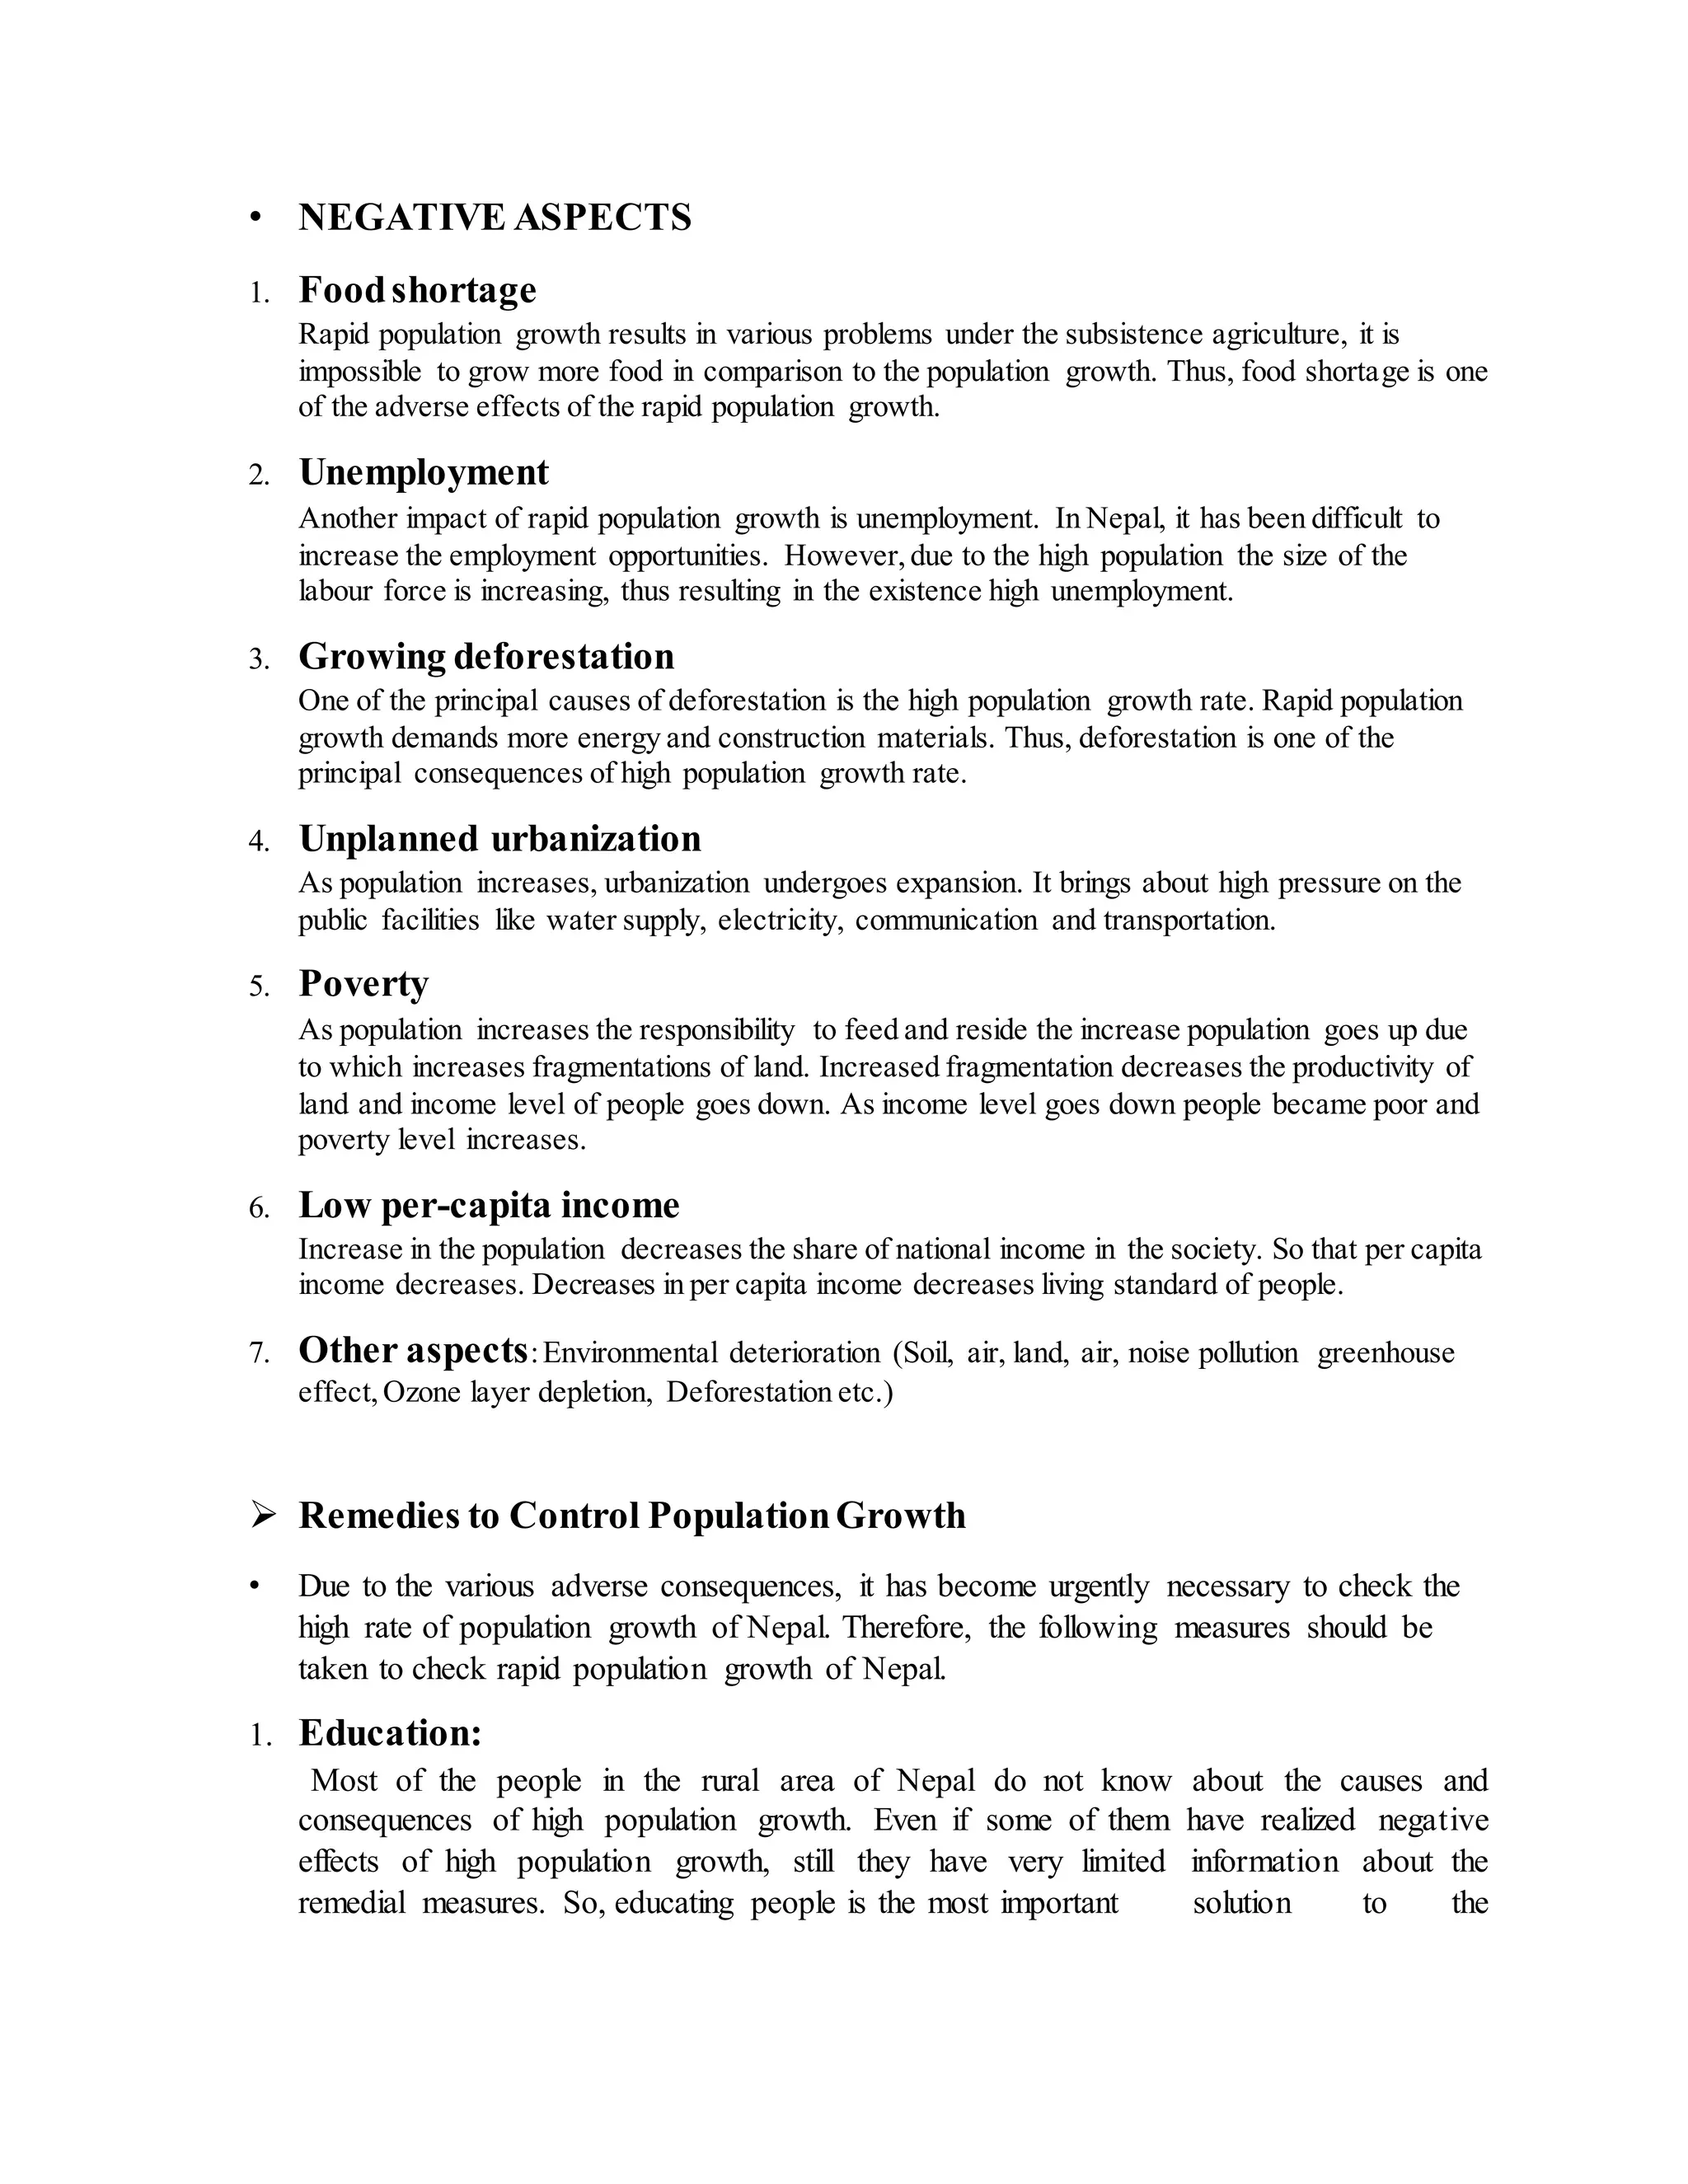
• NEGATIVE ASPECTS
1. Foodshortage
Rapid population growth results in various problems under the subsistence agriculture, it is
impossible to grow more food in comparison to the population growth. Thus, food shortage is one
of the adverse effects of the rapid population growth.
2. Unemployment
Another impact of rapid population growth is unemployment. In Nepal, it has been difficult to
increase the employment opportunities. However,due to the high population the size of the
labour force is increasing, thus resulting in the existence high unemployment.
3. Growing deforestation
One of the principal causes of deforestation is the high population growth rate. Rapid population
growth demands more energy and construction materials. Thus, deforestation is one of the
principal consequences of high population growth rate.
4. Unplanned urbanization
As population increases, urbanization undergoes expansion. It brings about high pressure on the
public facilities like water supply, electricity, communication and transportation.
5. Poverty
As population increases the responsibility to feed and reside the increase population goes up due
to which increases fragmentations of land. Increased fragmentation decreases the productivity of
land and income level of people goes down. As income level goes down people became poor and
poverty level increases.
6. Low per-capita income
Increase in the population decreases the share of national income in the society. So that per capita
income decreases. Decreases in per capita income decreases living standard of people.
7. Other aspects:Environmental deterioration (Soil, air, land, air, noise pollution greenhouse
effect,Ozone layer depletion, Deforestation etc.)
 Remedies to Control PopulationGrowth
• Due to the various adverse consequences, it has become urgently necessary to check the
high rate of population growth of Nepal. Therefore, the following measures should be
taken to check rapid population growth of Nepal.
1. Education:
Most of the people in the rural area of Nepal do not know about the causes and
consequences of high population growth. Even if some of them have realized negative
effects of high population growth, still they have very limited information about the
remedial measures. So, educating people is the most important solution to the
problem of high population growth. With the help of proper education, people become
familiar with the likely consequences of high population growth.
2.Socialreform:
Social reform like early marriage and polygamy should be effectively removed. The mere
legislation is not adequate. Law, against the early marriage and polygamy, should be
strictly enforced. Therefore, they need motivation through social reform, religious reform
and population education.
3.Religiousmovement:
It should be encouraged to eradicate wrong religious beliefs, especially to convince people that a
son is not an indispensable necessity and children are not gifts of God. Fatalism should be
eliminated to make people believe that they can improve them a lot by their own endeavors and
birth control is an effective means.
4. Extension of family planning services
Family planning devices should be made easily available and accessible. Programs should be
launched effectively and widespread around the country.
5. Health care facilities
People feel insecure and give birth to more children due to high child death rate,
which is one of the prominent reasons behind high population growth.
6.Womenempowerment
CALCULATION OF GROWTHRATE
A. Natural Increase Method
B. Balancing Equation
C. Arithmetic Progression/Geometric Progression(Mathematical
Methods)
A. Natural Increase Method: It is the surplus or deficit of birth over death in a
population in a given time period.
NI= Birth –Death (B-D)
Where,
B= No of birth
D=No of Death
NI= Natural Increase
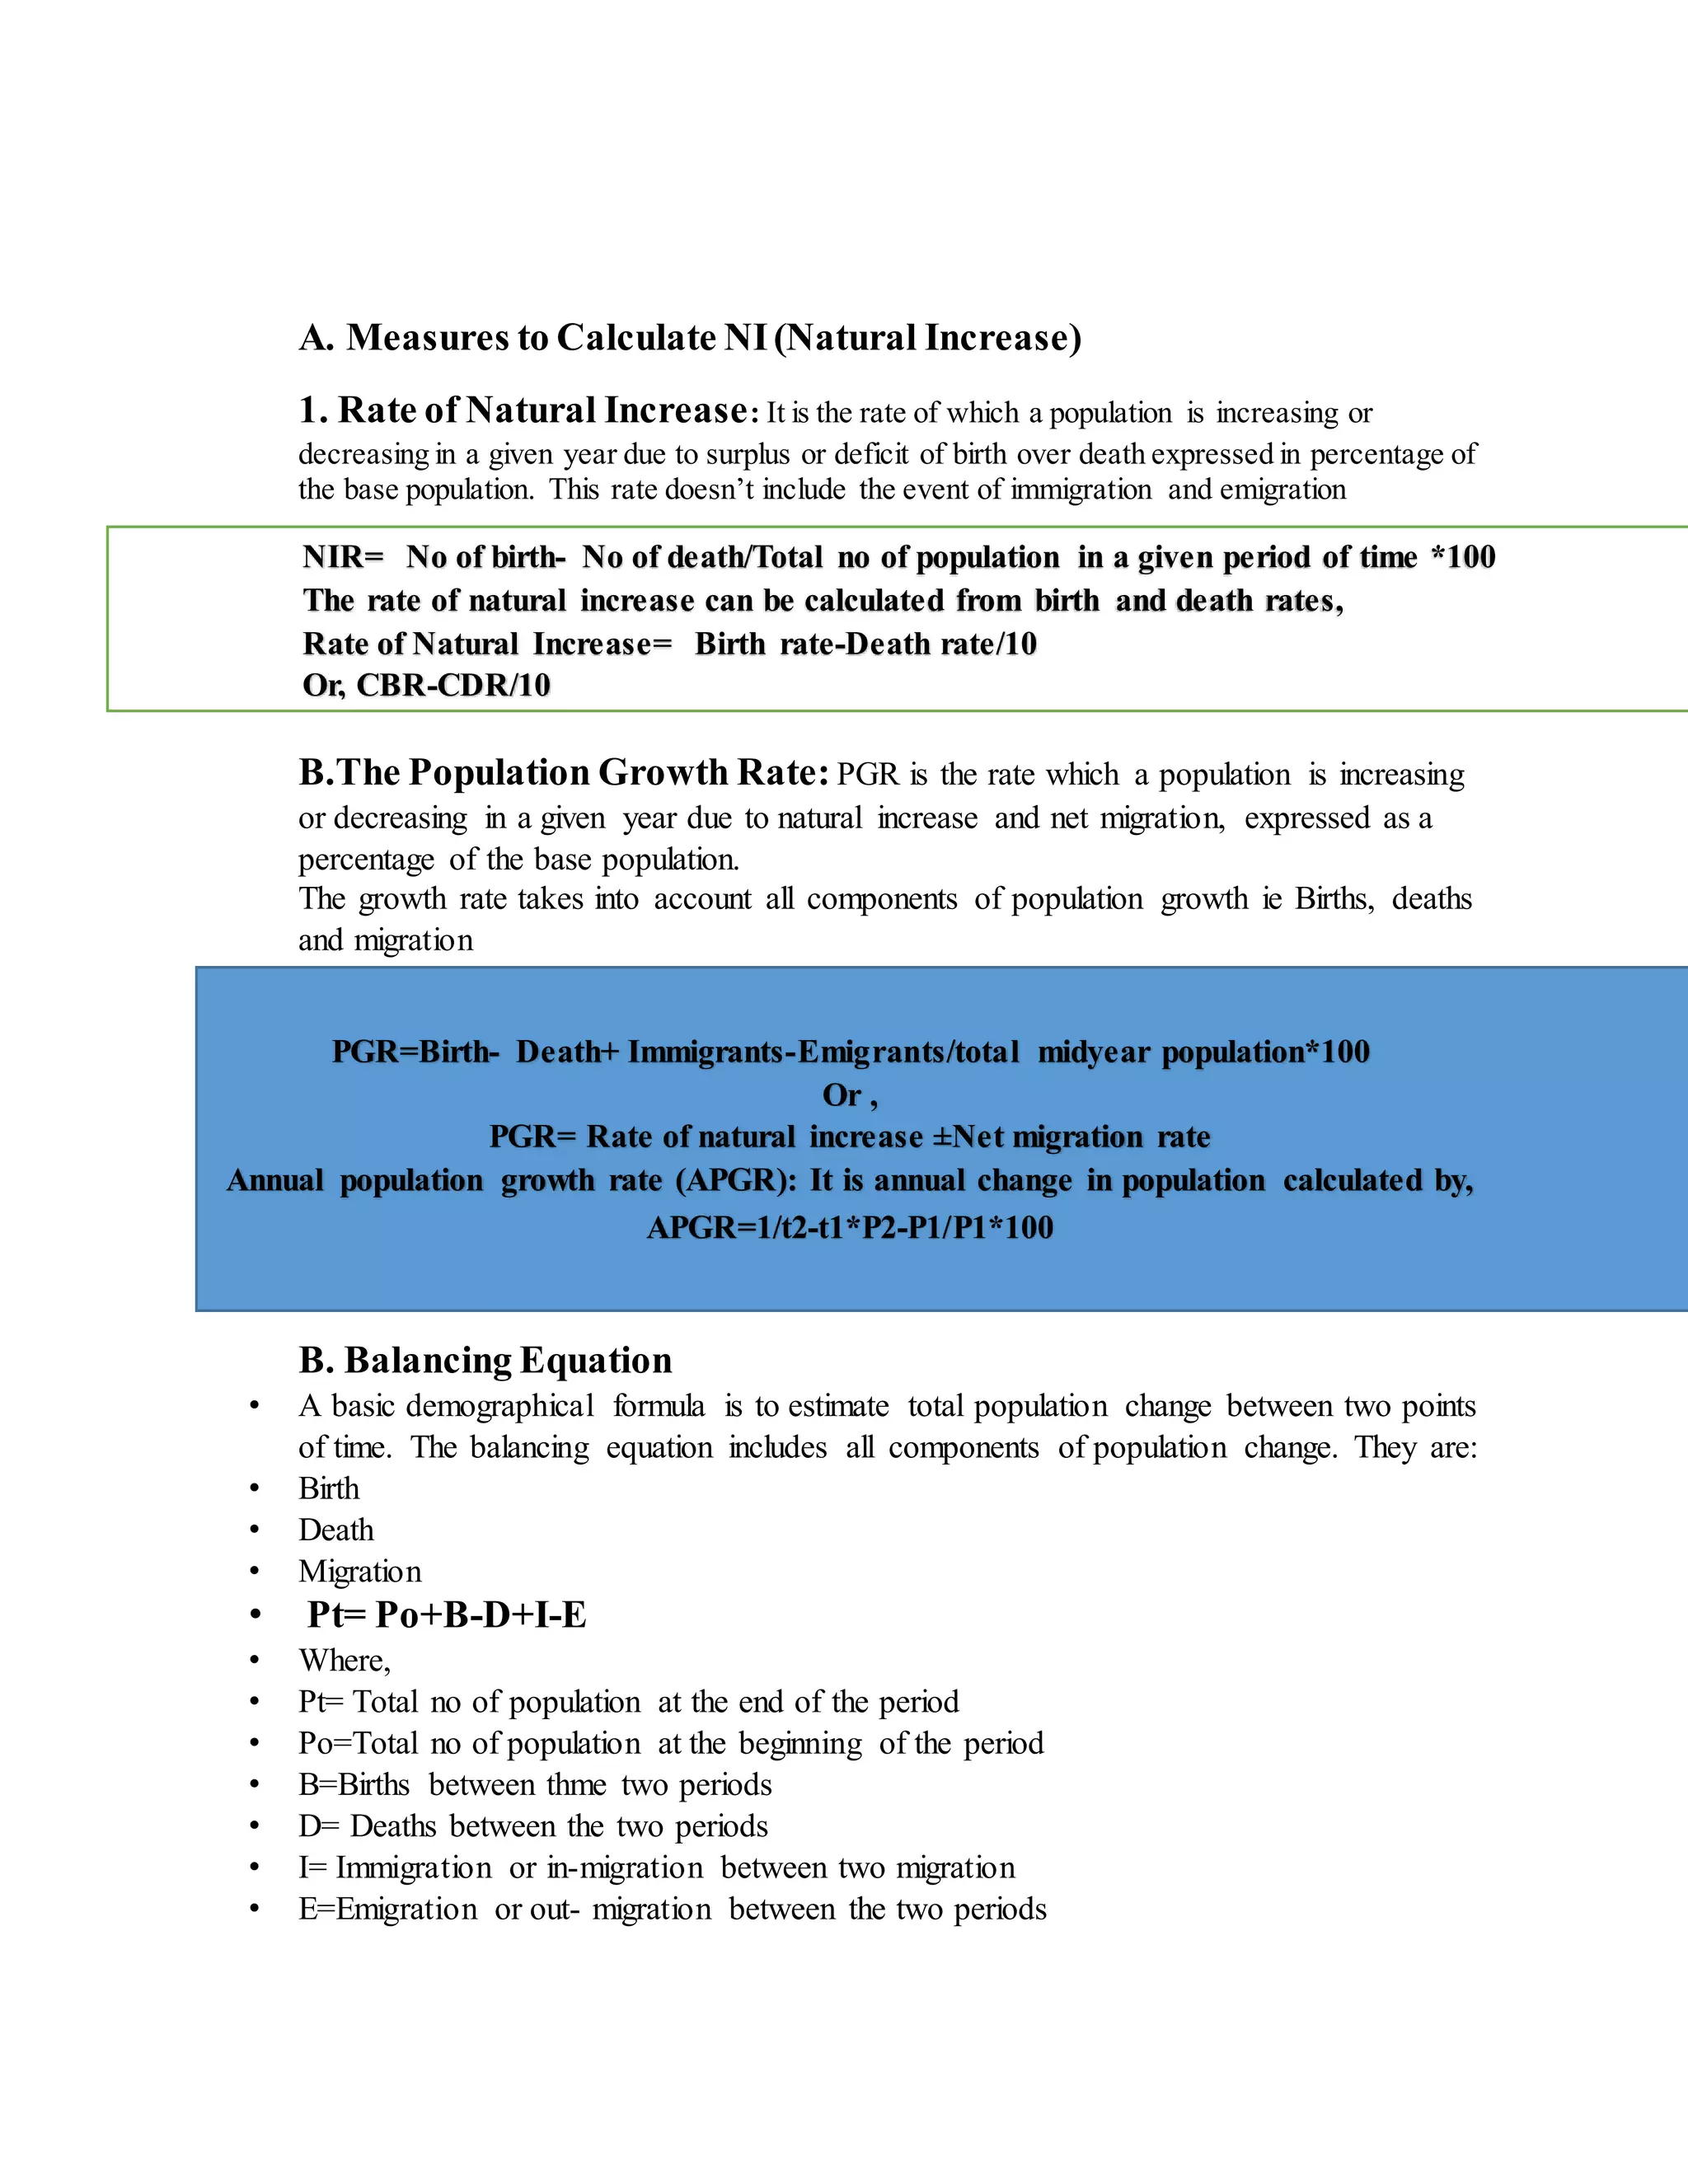
A. Measures to Calculate NI(Natural Increase)
1. Rate of Natural Increase: It is the rate of which a population is increasing or
decreasing in a given year due to surplus or deficit of birth over death expressed in percentage of
the base population. This rate doesn’t include the event of immigration and emigration
B.The Population Growth Rate: PGR is the rate which a population is increasing
or decreasing in a given year due to natural increase and net migration, expressed as a
percentage of the base population.
The growth rate takes into account all components of population growth ie Births, deaths
and migration
B. Balancing Equation
• A basic demographical formula is to estimate total population change between two points
of time. The balancing equation includes all components of population change. They are:
• Birth
• Death
• Migration
• Pt= Po+B-D+I-E
• Where,
• Pt= Total no of population at the end of the period
• Po=Total no of population at the beginning of the period
• B=Births between thme two periods
• D= Deaths between the two periods
• I= Immigration or in-migration between two migration
• E=Emigration or out- migration between the two periods
NIR= No of birth- No of death/Total no of population in a given period of time *100
The rate of natural increase can be calculated from birth and death rates,
Rate of Natural Increase= Birth rate-Death rate/10
Or, CBR-CDR/10
2. The Population Growth Rate: (PGR) is the rate which a population is increasing (or decreasing) in a
given year due to natural increase and net migration, expressed as a percentage of the base population.
The growth rate takes into account all components of population growth i.e., births, deaths and
migration.
PGR=Birth- Death+ Immigrants-Emigrants/total midyear population*100
Or ,
PGR= Rate of natural increase ±Net migration rate
Annual population growth rate (APGR): It is annual change in population calculated by,
APGR=1/t2-t1*P2-P1/P1*100
C. Population estimationby MathematicalMethod
1. Arithmetic Progression:Population can be estimated on the assumption that the annual
changes in population remain the same.
Formula, Pt=Po (1+rt)
r=1/t(Pt/Po-1)
Where,
Pt= Population at any time
Po=Base population
r=Population growth rate
T=time period between the census
• 2. Geometric Progession:Population is estimated on the assumption that population
increases in geometric progession.
• Pt=Po(1+r) 𝟐 and
• r=(Pt/Po)1/t-1
• Where,
Pt= Population at any time
Po=Base population
r=Population growth rate
T=time period between the census
 POPULATION DOUBLING TIME
• It is the number of years required for the population of an area to double its present size,
given the current rate of population growth.
• A country with a constant PGR of 1% would double its population in 70 years. So the
formula for calculating population doubling time is given by:
• PDT= 7O/PGR

More Related Content

What's hot

Population and demography
Population and demographyPopulation and demography
Population and demography
Eunice Macapia
 
Population and demography
Population and demographyPopulation and demography
Population and demography
Kathy Clavano
 
Mortality
MortalityMortality
Mortality
kdjw
 

What's hot (20)

Population and demography
Population and demographyPopulation and demography
Population and demography
 
Population and demography
Population and demographyPopulation and demography
Population and demography
 
National Population Policy
National Population Policy National Population Policy
National Population Policy
 
Measures of fertility
Measures of fertility Measures of fertility
Measures of fertility
 
SEX RATIO
SEX RATIOSEX RATIO
SEX RATIO
 
DEMOGRAPHY
DEMOGRAPHYDEMOGRAPHY
DEMOGRAPHY
 
Measures of mortality
Measures of mortalityMeasures of mortality
Measures of mortality
 
FERTILITY
FERTILITYFERTILITY
FERTILITY
 
National Population Policy
National Population PolicyNational Population Policy
National Population Policy
 
MY PPT - NATIONAL FAMILY HEALTH SURVEY- 5 AND COMPERATIVES.pptx
MY PPT - NATIONAL FAMILY HEALTH SURVEY- 5 AND COMPERATIVES.pptxMY PPT - NATIONAL FAMILY HEALTH SURVEY- 5 AND COMPERATIVES.pptx
MY PPT - NATIONAL FAMILY HEALTH SURVEY- 5 AND COMPERATIVES.pptx
 
sustainable development goals
sustainable development goalssustainable development goals
sustainable development goals
 
Demographic Indicators
Demographic IndicatorsDemographic Indicators
Demographic Indicators
 
Session 1 introduction of demography (as of 3-1-2017)
Session 1  introduction of demography (as of 3-1-2017)Session 1  introduction of demography (as of 3-1-2017)
Session 1 introduction of demography (as of 3-1-2017)
 
Types of variables in research
Types of variables in researchTypes of variables in research
Types of variables in research
 
Mortality
MortalityMortality
Mortality
 
Demography and Pyramids Of Pakistan
Demography and Pyramids Of PakistanDemography and Pyramids Of Pakistan
Demography and Pyramids Of Pakistan
 
Health status of the community
Health status of the communityHealth status of the community
Health status of the community
 
Demographic Processes
Demographic ProcessesDemographic Processes
Demographic Processes
 
Demography uph
Demography uphDemography uph
Demography uph
 
DEMOGRAPHIC TRANSITION THEORY
DEMOGRAPHIC TRANSITION THEORYDEMOGRAPHIC TRANSITION THEORY
DEMOGRAPHIC TRANSITION THEORY
 

Similar to Demography,unit 5

Similar to Demography,unit 5 (20)

Demography
DemographyDemography
Demography
 
Fertility and mortality...
Fertility and mortality...  Fertility and mortality...
Fertility and mortality...
 
Demography and Family Planning lE01.pptx
Demography and Family Planning lE01.pptxDemography and Family Planning lE01.pptx
Demography and Family Planning lE01.pptx
 
Demography.
Demography.Demography.
Demography.
 
Demography
DemographyDemography
Demography
 
ASSESSMENT OF NUTRITIONAL STATUS BASED ON VITAL STATISTICS
ASSESSMENT OF NUTRITIONAL STATUS BASED ON VITAL STATISTICSASSESSMENT OF NUTRITIONAL STATUS BASED ON VITAL STATISTICS
ASSESSMENT OF NUTRITIONAL STATUS BASED ON VITAL STATISTICS
 
Vital ASSESSMENT OF NUTRITIONAL STATUS BASED ON VITAL STATISTICSppt
Vital ASSESSMENT OF NUTRITIONAL STATUS BASED ON VITAL STATISTICSpptVital ASSESSMENT OF NUTRITIONAL STATUS BASED ON VITAL STATISTICSppt
Vital ASSESSMENT OF NUTRITIONAL STATUS BASED ON VITAL STATISTICSppt
 
ENVI 5 population FINAL
ENVI 5  population FINALENVI 5  population FINAL
ENVI 5 population FINAL
 
AS GEOGRAPHY REVISION - MIGRATION - 5.1 MIGRATION AS POPULATION CHANGE
AS GEOGRAPHY REVISION - MIGRATION - 5.1 MIGRATION AS POPULATION CHANGEAS GEOGRAPHY REVISION - MIGRATION - 5.1 MIGRATION AS POPULATION CHANGE
AS GEOGRAPHY REVISION - MIGRATION - 5.1 MIGRATION AS POPULATION CHANGE
 
CAMBRIDGE AS GEOGRAPHY REVISION: POPULATION - 4.1 NATURAL INCREASE
CAMBRIDGE AS GEOGRAPHY REVISION: POPULATION - 4.1 NATURAL INCREASECAMBRIDGE AS GEOGRAPHY REVISION: POPULATION - 4.1 NATURAL INCREASE
CAMBRIDGE AS GEOGRAPHY REVISION: POPULATION - 4.1 NATURAL INCREASE
 
Demography notes
Demography notesDemography notes
Demography notes
 
Demography
DemographyDemography
Demography
 
DEMOGRAPHY (2).ppt
DEMOGRAPHY (2).pptDEMOGRAPHY (2).ppt
DEMOGRAPHY (2).ppt
 
INDICATORS OF HEALTH
INDICATORS OF HEALTHINDICATORS OF HEALTH
INDICATORS OF HEALTH
 
INDICATORS OF HEALTH
INDICATORS OF HEALTHINDICATORS OF HEALTH
INDICATORS OF HEALTH
 
INDICATORS OF HEALTH
INDICATORS OF HEALTHINDICATORS OF HEALTH
INDICATORS OF HEALTH
 
Population and Demography
Population and DemographyPopulation and Demography
Population and Demography
 
chapter 3 Demography.pptx
chapter 3 Demography.pptxchapter 3 Demography.pptx
chapter 3 Demography.pptx
 
Demography ( dr.sanjeev sahu)
Demography ( dr.sanjeev sahu)Demography ( dr.sanjeev sahu)
Demography ( dr.sanjeev sahu)
 
Demography & health
Demography & healthDemography & health
Demography & health
 

Recently uploaded

Recently uploaded (20)

1.4 modern child centered education - mahatma gandhi-2.pptx
1.4 modern child centered education - mahatma gandhi-2.pptx1.4 modern child centered education - mahatma gandhi-2.pptx
1.4 modern child centered education - mahatma gandhi-2.pptx
 
50 ĐỀ LUYỆN THI IOE LỚP 9 - NĂM HỌC 2022-2023 (CÓ LINK HÌNH, FILE AUDIO VÀ ĐÁ...
50 ĐỀ LUYỆN THI IOE LỚP 9 - NĂM HỌC 2022-2023 (CÓ LINK HÌNH, FILE AUDIO VÀ ĐÁ...50 ĐỀ LUYỆN THI IOE LỚP 9 - NĂM HỌC 2022-2023 (CÓ LINK HÌNH, FILE AUDIO VÀ ĐÁ...
50 ĐỀ LUYỆN THI IOE LỚP 9 - NĂM HỌC 2022-2023 (CÓ LINK HÌNH, FILE AUDIO VÀ ĐÁ...
 
Solid waste management & Types of Basic civil Engineering notes by DJ Sir.pptx
Solid waste management & Types of Basic civil Engineering notes by DJ Sir.pptxSolid waste management & Types of Basic civil Engineering notes by DJ Sir.pptx
Solid waste management & Types of Basic civil Engineering notes by DJ Sir.pptx
 
How to Split Bills in the Odoo 17 POS Module
How to Split Bills in the Odoo 17 POS ModuleHow to Split Bills in the Odoo 17 POS Module
How to Split Bills in the Odoo 17 POS Module
 
Jose-Rizal-and-Philippine-Nationalism-National-Symbol-2.pptx
Jose-Rizal-and-Philippine-Nationalism-National-Symbol-2.pptxJose-Rizal-and-Philippine-Nationalism-National-Symbol-2.pptx
Jose-Rizal-and-Philippine-Nationalism-National-Symbol-2.pptx
 
Extraction Of Natural Dye From Beetroot (Beta Vulgaris) And Preparation Of He...
Extraction Of Natural Dye From Beetroot (Beta Vulgaris) And Preparation Of He...Extraction Of Natural Dye From Beetroot (Beta Vulgaris) And Preparation Of He...
Extraction Of Natural Dye From Beetroot (Beta Vulgaris) And Preparation Of He...
 
NLC-2024-Orientation-for-RO-SDO (1).pptx
NLC-2024-Orientation-for-RO-SDO (1).pptxNLC-2024-Orientation-for-RO-SDO (1).pptx
NLC-2024-Orientation-for-RO-SDO (1).pptx
 
aaaaaaaaaaaaaaaaaaaaaaaaaaaaaaaaaaaaaaaaa
aaaaaaaaaaaaaaaaaaaaaaaaaaaaaaaaaaaaaaaaaaaaaaaaaaaaaaaaaaaaaaaaaaaaaaaaaaaaaaaaaa
aaaaaaaaaaaaaaaaaaaaaaaaaaaaaaaaaaaaaaaaa
 
aaaaaaaaaaaaaaaaaaaaaaaaaaaaaaaaaaaaaaaaaaaaaaaaaaaaaaa
aaaaaaaaaaaaaaaaaaaaaaaaaaaaaaaaaaaaaaaaaaaaaaaaaaaaaaaaaaaaaaaaaaaaaaaaaaaaaaaaaaaaaaaaaaaaaaaaaaaaaaaaaaaaaa
aaaaaaaaaaaaaaaaaaaaaaaaaaaaaaaaaaaaaaaaaaaaaaaaaaaaaaa
 
Sectors of the Indian Economy - Class 10 Study Notes pdf
Sectors of the Indian Economy - Class 10 Study Notes pdfSectors of the Indian Economy - Class 10 Study Notes pdf
Sectors of the Indian Economy - Class 10 Study Notes pdf
 
Synthetic Fiber Construction in lab .pptx
Synthetic Fiber Construction in lab .pptxSynthetic Fiber Construction in lab .pptx
Synthetic Fiber Construction in lab .pptx
 
Introduction to Quality Improvement Essentials
Introduction to Quality Improvement EssentialsIntroduction to Quality Improvement Essentials
Introduction to Quality Improvement Essentials
 
Chapter 3 - Islamic Banking Products and Services.pptx
Chapter 3 - Islamic Banking Products and Services.pptxChapter 3 - Islamic Banking Products and Services.pptx
Chapter 3 - Islamic Banking Products and Services.pptx
 
How libraries can support authors with open access requirements for UKRI fund...
How libraries can support authors with open access requirements for UKRI fund...How libraries can support authors with open access requirements for UKRI fund...
How libraries can support authors with open access requirements for UKRI fund...
 
How to Break the cycle of negative Thoughts
How to Break the cycle of negative ThoughtsHow to Break the cycle of negative Thoughts
How to Break the cycle of negative Thoughts
 
Instructions for Submissions thorugh G- Classroom.pptx
Instructions for Submissions thorugh G- Classroom.pptxInstructions for Submissions thorugh G- Classroom.pptx
Instructions for Submissions thorugh G- Classroom.pptx
 
Sha'Carri Richardson Presentation 202345
Sha'Carri Richardson Presentation 202345Sha'Carri Richardson Presentation 202345
Sha'Carri Richardson Presentation 202345
 
2024.06.01 Introducing a competency framework for languag learning materials ...
2024.06.01 Introducing a competency framework for languag learning materials ...2024.06.01 Introducing a competency framework for languag learning materials ...
2024.06.01 Introducing a competency framework for languag learning materials ...
 
Basic phrases for greeting and assisting costumers
Basic phrases for greeting and assisting costumersBasic phrases for greeting and assisting costumers
Basic phrases for greeting and assisting costumers
 
Fish and Chips - have they had their chips
Fish and Chips - have they had their chipsFish and Chips - have they had their chips
Fish and Chips - have they had their chips
 

Demography,unit 5

  • 1. DEMOGRAPHY(STUDY OF POPULATION) UNIT: 5, SUBUNIT 5.1 POPULATION • A group of individuals living in a particular area • Individuals that interact while seeking resources and in producing offspring. • Members of a group that are subject to the same local conditions of the environment. • Members of a single species. • A group of individuals of the same species occupying a particular geographic area. Populations may be relatively small and closed, as on an island or in a valley, or they may be more diffuse and without a clear boundary between them and a neighboring population of the same species. DEMOGRAPHY • Demography is derived from two Greek words:  Demos means population  Graphics means to draw  Demography is the scientific study of human population and its dynamics.  Demographic studies 3 aspects of Population  Changes in population size  Composition of population  Distribution of population in place • Demography Demography can be defined as the study of human population including their composition, distribution, density, growth and other characteristics as well as the causes and consequences of changes in these factors. • A Study of death, birth and movements and predictions of how these factors determine the size and structure of populations through time. •Demography is the study of the size, composition, spatial distribution of human population and of changes over time. Donald J. Bouge
  • 2. DEMOGRAPHIC PROCESS • The demographic processes that determine the size, composition and distribution of a population are: 1.Fertility 2.Mortality 3.Migration 4.Marriage 5.Social mobility(Changes in social status) 1) FERTILITY  Fertility in demography refers to the actual birth performance of women.  It is the result of fecundity-the physiological capacity of women to reproduce.  The fundamental notion of fertility is an actual level of performance in a population, based on the number of live births that occur during the reproductive period.  Fecundity is biological potential, the physiological capacity of man/women or couple to participate in reproduction. •Fecundity period ranges from 15-49 • Natural or biological fertility- fertility of human population that makes no deliberate efforts to limit births. •Fertility is called natural if no contraception or induced abortion is used. •Fertility level- the total no of children that can be produced by the woman in her reproductive life span.  Causes ofhigh fertility rate in developing countries 1. Early child marriage 2. Mass poverty 3. Social and religious norms and values 4. Female illiteracy 5. Joint family system 6. Lack of social awareness 7. Low income level 8. Lack of women empowerment 9. Gender inequality 10. Polygamy  Causes oflow Fertility rate in developing countries 1. Increasing tendency in age at marriage 2. Rapid urbanization 3. Increasing in educational attainment 4. Change in occupation from agriculture to industry
  • 3. 5. Improvement in women empowerment 6. Change in marriage system 7. Extension of Industrialization 8. Demographic transition of third stage 9. Delayed marriage 10. Liberal abortion laws 11. Declining mortality like IMR, CMR and MMR 12. More employment opportunities 13. Desire for nucleus family 14. Women empowerment 15. Education and employment for women 16. Improved effective methods of fertility control 17. Adequate health services and facilities 18. Decreasing influence of religious values and norms. 19. Sufficient food supply 20. Increase in health facilities and services 21. Desire of small family norm 22. Legalization of abortion 23. Gender equality 24. Improvement in religious and social beliefs  Causes of low fertility rate in Developedcountries Factors affecting Fertility 1. Marriage or proportion of married women 2. Incidence of abortion 3. Use of contraceptives of birth control 4. The waiting time to conception 5. The gestation period  MEASUREMENTS OF FERTILITY 1. CBR(Crude Birth Rate) CBR= No of live births in a year/Total mid-year population*1000 2. GFR (General Fertility Rate): General fertility rate is the number of live births per 1000females aged 15-49 years (fertile age group) in a given year. GFR= No of live births in a year/No of Females 15-49 years of age *1000 3. ASFR( Age Specific fertility Rate): It is defined as the number of
  • 4. children born alive to females in a specific age group per 1000 females in that specific age group, example(15-19), (20- 24),………….(45-49) years of age Formula, ASFR= No of live births in a specific age group in a year/Mid-year population of females of the same age group*1000 4. TFR( Total Fertility Rate): The TFR is the average no of children that would be born to a woman throughout her life time or her child bearing age (15-49) if she were to pass through all her child bearing years at the same rates as the women now in each age group TFR=Sum of all ASFR multiplied by age interval (Usually 5) TFR=∑ASFR*5 Other measurement of Fertility rate are GRR (Gross Reproduction Rate) which is calculated by GFR=TFR*Female births/Male+ Female births, Net Reproduction Rate and child woman ratio. 2) MORTALITY Mortality is death It is the permanent disappearance of all evidence of life at any time after birth has taken place. Abortion and still births are referred to, not as deaths, but as fetal deaths. MORBIDITY  It is a state of affair in which the individual is undergoing physical, mental or social sufferings  Morbidity refers to disease and illness, injuries, and disabilities in a population.  Determinants of Mortality • Heredity Senescene(Ageing) • Sex Ignorance and Superstition • Age-factor • Diseases • Violence and accidents • Natural calamities • Food shortage • Poverty • Climate • Lack of health education • Murder and suicide • Lack of health services and facilities
  • 5. • Environmental hazards  Causes ofDecline in Mortality rate in Nepal • Increased access to Health care services • Safe and clean delivery • Provision of safe abortion • Focused treatment on childhood illnesses • Education and awareness • Control of communicable disease • Tendency of late marriage • Desire for small family norms  MEASUREMENTS OF MORTALITY 1. CDR (Crude Deathrate): CDR is the number of deaths per 1000 population in a given year. CDR=Total no of death in a year/Mid-year population*1000 2. ASDR(Age Specific Death Rate (Mortality): ASMR is defined as number of death of persons in a specific age group in a year per 1000 population of the same age group at the middle of the year. ASMR=No of deaths in a specific age group/Mid –year population of the same age group*1000 3. IMR (Infant Mortality rate): It is the number of deaths of infants under 1 year of age (0-11 months of age) per 1000 live births in a given year. IMR=No of death of children<1 year of age in a year/total live births during that year*1000 4. Child Mortality Rate: It is the no of deaths of children 1-4 years of age per 1000 children 1-4 years of age. It is sensitive indicators of the health status of a community CMR= No of deaths of children 1-4 year of age in a year/Total no of children 1-4 years of age * 1000 5. Under Five Mortality Rate( <5 MR): I t is the no of death of children under 5 years of age in a( 0-4 )per 1000 children under five years of age <5MR=No of deaths of children <5 yrs in a year/Total no of children <5 years of age*1000
  • 6. 6. NNMR (Neonatal Mortality Rate): Neonatal period is the first month of age of an infant. Death of infants under 1 months (<4 weeks), per 1000 live births NNMR= No of deaths of infants<1 month in a year/Total no of live births in the same year* 1000 7. Post –neonatal: Death of infants of age 1 months -11 months of age per 1000 live births  PNNMR= No of death of infants 1 month to 1 year of age in a year/Total no of live births during the same year* 1000 8. MMR(Maternal Mortality Ratio): MMR is the number of maternal deaths related to pregnancy, child birth and postnatal complications per 1,00,000 live births. MMR= No of deaths of women related to pregnancy, childbirth& puerperium in a year/Total no of live births in the same year*1,00,000 Other measurements of Mortality rate are Sex Specific Death Rates (SSDR), Case Fatality rate (CFR) MEASUREMENTOF MORBIDITY 1. Incidence rate (New cases of specific diseases) 2. Prevalence rate (Total new and old cases of specific diseases) 3. Case FatalityRate: The ratio of person dying from a particular diseases and the number of people suffering from the same disease during a given period. CFR= Totalno of deaths due to a particular disease/Totalno of casesto the same disease*100 3) Migration  Migration is the movement by people from one place to another with the intentions of settling, permanently or temporarily in a new location. The movement is often over long distances and from one country to another, but internal migration is also possible; indeed, this is the dominant form globally. People may migrate as individuals, in family units or in large groups.  To move from one country, place, or locality to another in order to achieve better
  • 7.  Migration is the movement of people from one defined area to another during a given interval of time.  It influences significantly in changes population size, structure and other demographic characteristics both in the origin and destination. Public health concerns migration to the overcrowding, disaster management, communicable disease and epidemic.  Types of Migration a. Basedon the demographics 1. Internal migration 2. International migration a. Immigration b. Emmigration b. Basedon the area of residence 1. Rural to urban, urban to rural 2. Hilly to Terai 3. Urban to urban, rural to rural, etc c. Basedon the time duration  Permanent (>10 years)  Semi-permanent(within 10 years)  Temporary (5 years, not leaving the original place)  Seasonal (generally 6 months)  Weekly  Daily  Determinants of Migration  PULL FACTORS • Attraction towards place • Better employment opportunities • Better educational opportunities • Better economic possibilities • Better climatic condition • Higher standard of living • Political stability • Better social, cultural, and environmental conditions • Security freedom, etc.
  • 8.  PUSH FACTORS • Inadequate facilities for maintaining livelihood • Lower wages at the place of origin • Poverty, unemployment and lower standard of living • Discrimination based on religion and politics • Lack of personal development • Dis-satisfaction with socio-cultural and religious aspect • Lack of health, education and entertainment facilities  Causes ofInternal Migration in Nepal • Malaria control • Construction projects in Terai • Searching for economic prosperity • Transportation and communication • Resettlement program • Facilities for education and health services • Fertile land in terai • Business 4) Marriage/Nuptiality The legally or formally recognized union of two people as partners in a personal relationship (historically and in some jurisdictions specifically a union between a man and a woman) is known as marriage. Nuptiality refers to marriage as a population phenomenon, including the rate at which it occurs, the characteristics of persons united in marriage, and the dissolution of such unions (through divorce, separation, widowhood, and annulment). MEASUREMENTOF MARRIAGE 1) CMR( Crude Marriage Rate): It is defined as the no of marriages per year per 1000 mid-year population CMR= Total no of marriages in an area during a year/Total mid-year population in a given area during a year* 1000 2) General Marriage Rate (GMR): It is defined as the no of marriages per 1000 marriageable population in an area during a year. GMR= Total no of marriages in a year/Total no of marriageable population (15+)* 3) Age Specific Marriage Rate (ASMR): It is defined as the number of marriages of particular age group per 1000 persons of thet age group during the year.
  • 9. ASMR= Total no of marriages for both sexes inspecific age group in a given year/Total mid-year population of the same age group*1000 4) Crude Divorce Rate: CDR is defined as the no of divorces per 1000 mid-year population in a certain period of time, CDR=Total no of divorces in a year/Total mid-year population*1000 Other measurements of marriage are General Divorce Rate, Age Specific Divorce Rate ASDR=Total no of divorces in a specified age group/Total no of married population of same age group*1000 GDR (General Divorce Rate): GDR= Total no of divorces during a year/Total no of population at divorceable age* 1000  Divorceable age=15+ 5) SocialMobility (DEMOGRAPHIC PROCESS) A change in status (for example, an occupational change)  Sources ofDemographic Information 1. Census 2. Registration of vital events(Records) 3. Sample Surveys 4. Population Registers 5. Administrative records 6. International and National Publications 1. CENSUS • Census is defined as an enumeration or complete population count at a point in time within a specified geographical area. • A census is the total process of collecting, compiling, evaluating, analyzing and publishing demographic, economic and social data pertaining at the specified time, to all persons in a country or in a well delaminated part of the country. UN(1958)
  • 10. Four essentialfeatures ofPopulation census (UN): 1. Each persons are recorded separately. 2. The census covers a precisely defined territory and includes every person present or residing within its scope. 3. The population is enumerated with respect to a well-defined reference period. 4. The census are taken at regular intervals. Contents of Population census (UN) Personaland Household characteristics:  Age, sex, relationship to head of household, marital status, age at marriage, children born alive, children living, citizenship, literacy, school attainment , educational qualification, national and /or ethnic group, language ,religion.  Geographic characteristics  Place of enumeration, place of usual residence, place of birth, duration of residence, place of previous residence, place of work.  Economic characteristics  Type of activity, occupation, status, main source of livelihood. Methods/Techniques ofCensus 1. De-Jure method 2. De-facto method 3. Modified de-jure method 1. De- Jure method This technique is the counting of people according to the permanent place of location or residence. It also count the people who has been living at least for a period of six month continuously. Advantages 1. It gives permanent picture of the community 2. It provides more realistic and useful statistics.
  • 11. Disadvantages 1. Some person may be omitted from the count. A household member who is temporarily away from home may be missed from being counted unless the enumerator makes sure that nobody is missing. 2. Some may be counted twice. 3. Information collected regarding persons away from home is often incomplete or incorrect. 2. De-Facto Method This method refers to counting persons where they are present at the time of census period. Students in hostel, armed force in the barracks are counted at the place where they are found. Persons without fixed residence, homeless, beggars, vagrants, sage, hermit’s nomads are also counted. Advantages 1. There is less chance for the omission ofpersons from the count. Disadvantages 1. It provides incorrect picture of the population in a community 2. Vital statistics are usually distorted (In areas with high migration) 3. Difficult to obtain information regarding persons in transit. These are persons who are, for example travelling and have left their area of permanent residence but haven’t reached the area of destination during the census day. 3.ModifiedDe-Jure method • Combination of both de-jure and de-facto method • Person is enumerated on the basis of normal / usual residence. • Normal/usual residence means the place where one is living for at least defined period continuously(e.g 6 months) • Person without fixed residence, homeless, beggars, vagrants, sage, hermits nomads are also counted.
  • 12. History of Census in Nepal • During the time of Bhimsen Thapa (1806-1838) adult males were counted. • Officially 1st Census of Nepal was taken in 1911 which was followed in 1920, 1930 and 1941. • They were limited on gathering information of only household number and their land ownerships. • 1st Scientific census was carried out in 1952-54 and it was followed in 1961, 1971, 1981, 1991, 2001 and 2011. 2. Vital Registration • It refers to those events concerned with the life of individual from birth to death. Such as birth, death, fetal death, still birth, marriage, divorce, separation, adoption, legitimating, recognition. • According to UN hand book, Vital registration system is the legal registration, statistical recording and reporting of the occurrence of and collection, compilation, analysis, presentation and distribution of statistics pertaining to vital events which in turn include live births, fetal deaths, deaths, marriage, divorce, adoption, abortion, legitimizations, recognition, annulments and legal separations. History of Vital registrationin Nepal • 1st time introduced in 1962 under the act of village panchayat law of 1962. • Started through pilot project in 3 Panchayat of Kathmandu valley in 1964 which was discontinued. • In 1972 it was carried out by FP/MCH project in two district and terminated after four years in 1976. • It was launched in 10 districts in 1976 under the Vital Registration Act 1976, covered 40 districts in 1981/82 and all 75 districts in 1990. • 3. Sample Surveys • It is the process of collecting, compiling, evaluating and publishing demographic, social and economic data about the sample population at a specific time that help to inter the general behavior of the entire population. Types • Longitudinal Sample surveys • Cross-sectional sample surveys
  • 13. • Some surveys in Nepal • 1996-2016 : Demographic and health survey • 1996: National health survey • 1976: Nepal fertility survey • 1984: Fertility and mortality survey 4. Population Registers It is a system of record keeping of all events from birth to death (marriage, childbirth, migration, divorce, separation) of individuals in separate card of file. 5) Administrative Records These are the collection of information on population for their own purposes by different administrative or managerial authorities. These may consist of consumer ration card records, voter lists, insurance and welfare records, school enrolment and telephone directories, business directories etc. They serve the purposes of collectors, they may not necessarily provide demographic information and they may not be the complete ones. 6) International and NationalPublications These are the secondary sources of data they are official or unofficial textbooks, yearbooks, statistical books, periodical journals, research reports etc. Some major Publications 1. Demographic yearbook (1948) 2. Statistical yearbook (1948) 3. Monthly Bulletin of Statistics (1947) 4. In Nepal CBS Population Composition • Tools ofDemography 1. Count 2. Rate 3. Ratio 4. Proportion 1) Count: It is the no of cases in a category or the frequency. This is often used to compare the numbers especially when the population is not much large. 2) RATE A rate measures the occurrence of some particular event in a population during a given time period. In rate numerator is the part of the denominator and multiplier is 100, 1000, 10000, 100000 or so on.
  • 14. Rate denotes the risk of developing a condition. All rate is a ratios, but all ratios are not rates. Rate always requires time specification usually a calendar year) It measures the probability of some particular event. • It is the number of events (numerator) divided by the total population exposed to the risk of that event (denominator) multiplied by a constant. • Numerator should always be included in denominator • In other words rate is the part or proportion of numerator in terms of denominator that is multiplied by a constant, e.g., by 100 for the % • E.g Crude rate, specific rate A rate measures the occurrence of some particular event (Example death) in a population during a given time period. Rate=Vital event/Population at risk Example: Death rate= No of deaths in one year/ Midyear population *1000 Note: A rate comprises the following elements:  Numerator  Denominator  Time specification  Multiplier or constant (100, 1000, 10, 0000 etc.)  All rates are ratios, but all ratios are not rates. 3)RATIO Ratio measures a relation in size between two random quantities. The numerator is not the part of the denominator, and both numerator and denominator are unrelated. It is the expression of the relationship between a numerator and denominator in which numerator is not includes in the denominator. • Ratio is the product of numerator divided by the denominator, where numerator is not the subset of denominator. • There is no Multiplier in Ratio. • The numerator or denominator in ratio may involve of interval or time specification. • E.g.: Sex ratio, doctor population ratio, Child women (MMR) ratio etc. • Ratio is a quotient of any two demographic quantities. It is the result of dividing one quantity by another. • a/b, a:b a. Example: Sex Ratio= Male/female • b.Doctor to Population ratio= No of Doctors/No of Population 4) PROPORTION A proportion indicates the relation in magnitude of a part of the whole. The numerator is always included in the denominator. Proportion is always expressed in percentage (%)
  • 15. • It is the product of numerator divided by denominator without applying the function of any constant. Numerator and Denominator in proportion are instantaneous in time(time specification is not required) • Difference between Rate and proportion is that proportion is dimensionless whereas, rate always has unit of measurement with dimension. • Example: Males to Total population ratio= Male/Male+ Female*100 Population Composition • The population composition is the internal structure and characteristics of human population with respect to one or more demographic attributes or traits at a particular point of time. The attributes which are of specific concern in demography are: • Age • Marital status • Economic characteristics • Religion and family type • Sex • Rural-Urban residence • Educational characteristics Estimation of Sex Ratio • The sex ratio is the ratio of males to females in a given population usually express as the number of males for every 100 females. • Mathematically it can be calculated as, Sex ratio =No ofMales/No ofFemales  Population Pyramid • It is the process of one way of looking at changes in the composition of a population is through Population Pyramids. • Population pyramid is a graphical representation of the population in various age groups of both sexes.  Constructionof Population Pyramid • Consists of bar representing age groups in ascending order from the lowest to the highest • Males on left side/Females on the right side • Young persons at the bottom and elderly at the top • No of male/female is indicated by the length of the bars from the central axis. • Age group must have the same class interval.
  • 16. Shape of Pyramid Based on the shape and structure of the pyramid, Population pyramid can be divided into three categories: 1. Expansive (broad base) • Rapid population growth • This indicates high percentage of young population • This type of pyramid represents high birth and large no of people are in the younger ages. • Maximum no of population is found in 0-4 years and it decreases as the age increases. • This type of pyramid is found in developing countries. 2. Constructive • In this type of pyramid, small no of people found in the younger ages. • Population of 0-4 years is found less as compared with 5-9 years. • Population increases as the year increases. • Population goes on decreasing after the adult stage and shapes like a spindle • Found in developed countries where Family planning is successful • 3. Stationary • This represents stable birth rate for many years. Roughly equal no of people are found in all age groups, tapering off gradually at the older age. Population Pyramid
  • 17. SUBUNIT 5.2 MEASUREMENTS OF POPULATION DISTRIBUTIONS • The distribution of population can be classified according to Residential and Geographical variation. 1. ResidentialType: • Urban- Rural Population: Urban- rural areas are in general differentiated by facilities like electricity, transportation, water supply, opportunity, etc. Some measures of the type of residence composition are:  Percentage distribution of population in various geographic regions or by size of locality of residence.  Degree of urbanization  Tempo of urbanization  Urban rural ratio 2. EcologicalDistribution: It is the distribution ofthe population according to ecological division ofthe country. They are; • Mountain : 7.3% • Hill : 44.3% • Terai : 48.4% • Urban population : 16% (approx.) • Rural Population : 84% (approx.) 3. Others types of distribution: • Distribution according to the political division of the country: developmental region, zone, districts, municipality, VDCs,etc. • Caste wise distribution
  • 18. NEPAL POPULATIONGROWTH TRENDS Population growth trends WORLD POPULATION GROWTHTREND Global human population growth amounts to around 83 million annually, or 1.1% per year. The global population has grown from 1 billion in 1800 to 7.6 billion in 2017. It is expected to keep growing, and estimates have put the total population at 8.6 billion by
  • 19. mid-2030, 9.8 billion by mid-2050 and 11.2 billion by 2100. Many nations with rapid population growth have low standards of living, whereas many nations with low rates of population growth have high standards of living. Annual Population Growth in Nepal • NEPAL: 2.25% • Developed countries: 0.2% • World: 1.2% SUBUNIT 5.3: POPULATION GROWTH  Population growth • Population growth is the increase in the number of individuals in a population. • An increase in the number of people that reside in a country, state,county, or city. To determine whether there has been population growth, the following formula is used: (birth rate + immigration) - (death rate + emigration. • Population growth is the relative increase in the total number of population in any particular area. • Population growth is due to natural increase and net migration of a particular area or a country. When the birth rate is comparatively higher than that of the death rate , there occurs population growth. To some extent higher immigration rate may be the cause of population growth, e.g. United States  Causes ofPopulation Growth
  • 20. • Poverty: In Nepal, around 25 percent of Nepalese are below the poverty line. They can't afford to eat hygienic food, have no access to regular health checkup. Similarly, 76% people are farmers they require more agro-labor force which is compensated by more birth of the children. Most of the women are unemployed. • Illiteracy: Around 34% people are illiterate in Nepal according to the result of population census 2011 AD. Till, masses of people are not aware of the evil consequences of population growth. Among the illiterate, 57.2% are female. Thus, population growth is promoted by the situation of illiteracy of Nepal. • Early marriage: It is one of the causes for high population growth. It exists in Nepal due to socio-cultural norms. Parents feelthemselves free from the responsibility of their child after marriage. It is also responsible for the high population in Nepal. It is not checked by a legal provision. • Religious and SocialBelief: It is very strong in rural areas of Nepal. Most of the people believe in God. They feel son as a compulsion and require for rite and rituals. They also believe children are the gift of God. By the reason, people have accelerated the population size. • Growing Internal Migration: The size of the population in Nepal has been growing due to the open international migration, practically from India, Bhutan and Tibet. The nation would be unable to control the population growth unless it adopts some measures to stop this type of migration trend in future.  ASPECTS OF POPULATION GROWTH • POSITIVE ASPECTS: • Economic Boost • Increased Innovation: Agriculture, Medicinal , Industrial • Population Growth as a Sign of Social Health • Although not a direct effect of population growth, growing societies often signify healthy societies. For instance, population growth often signals lower mortality rates through advances in medicine and science. • Manpower availability: More productivity due to employment of large no of population in different sectors • Settlement of scared populous area • Utilization of resources • Urbanization and industrialization
  • 21. • NEGATIVE ASPECTS 1. Foodshortage Rapid population growth results in various problems under the subsistence agriculture, it is impossible to grow more food in comparison to the population growth. Thus, food shortage is one of the adverse effects of the rapid population growth. 2. Unemployment Another impact of rapid population growth is unemployment. In Nepal, it has been difficult to increase the employment opportunities. However,due to the high population the size of the labour force is increasing, thus resulting in the existence high unemployment. 3. Growing deforestation One of the principal causes of deforestation is the high population growth rate. Rapid population growth demands more energy and construction materials. Thus, deforestation is one of the principal consequences of high population growth rate. 4. Unplanned urbanization As population increases, urbanization undergoes expansion. It brings about high pressure on the public facilities like water supply, electricity, communication and transportation. 5. Poverty As population increases the responsibility to feed and reside the increase population goes up due to which increases fragmentations of land. Increased fragmentation decreases the productivity of land and income level of people goes down. As income level goes down people became poor and poverty level increases. 6. Low per-capita income Increase in the population decreases the share of national income in the society. So that per capita income decreases. Decreases in per capita income decreases living standard of people. 7. Other aspects:Environmental deterioration (Soil, air, land, air, noise pollution greenhouse effect,Ozone layer depletion, Deforestation etc.)  Remedies to Control PopulationGrowth • Due to the various adverse consequences, it has become urgently necessary to check the high rate of population growth of Nepal. Therefore, the following measures should be taken to check rapid population growth of Nepal. 1. Education: Most of the people in the rural area of Nepal do not know about the causes and consequences of high population growth. Even if some of them have realized negative effects of high population growth, still they have very limited information about the remedial measures. So, educating people is the most important solution to the
  • 22. problem of high population growth. With the help of proper education, people become familiar with the likely consequences of high population growth. 2.Socialreform: Social reform like early marriage and polygamy should be effectively removed. The mere legislation is not adequate. Law, against the early marriage and polygamy, should be strictly enforced. Therefore, they need motivation through social reform, religious reform and population education. 3.Religiousmovement: It should be encouraged to eradicate wrong religious beliefs, especially to convince people that a son is not an indispensable necessity and children are not gifts of God. Fatalism should be eliminated to make people believe that they can improve them a lot by their own endeavors and birth control is an effective means. 4. Extension of family planning services Family planning devices should be made easily available and accessible. Programs should be launched effectively and widespread around the country. 5. Health care facilities People feel insecure and give birth to more children due to high child death rate, which is one of the prominent reasons behind high population growth. 6.Womenempowerment CALCULATION OF GROWTHRATE A. Natural Increase Method B. Balancing Equation C. Arithmetic Progression/Geometric Progression(Mathematical Methods) A. Natural Increase Method: It is the surplus or deficit of birth over death in a population in a given time period. NI= Birth –Death (B-D) Where, B= No of birth D=No of Death NI= Natural Increase
  • 23. A. Measures to Calculate NI(Natural Increase) 1. Rate of Natural Increase: It is the rate of which a population is increasing or decreasing in a given year due to surplus or deficit of birth over death expressed in percentage of the base population. This rate doesn’t include the event of immigration and emigration B.The Population Growth Rate: PGR is the rate which a population is increasing or decreasing in a given year due to natural increase and net migration, expressed as a percentage of the base population. The growth rate takes into account all components of population growth ie Births, deaths and migration B. Balancing Equation • A basic demographical formula is to estimate total population change between two points of time. The balancing equation includes all components of population change. They are: • Birth • Death • Migration • Pt= Po+B-D+I-E • Where, • Pt= Total no of population at the end of the period • Po=Total no of population at the beginning of the period • B=Births between thme two periods • D= Deaths between the two periods • I= Immigration or in-migration between two migration • E=Emigration or out- migration between the two periods NIR= No of birth- No of death/Total no of population in a given period of time *100 The rate of natural increase can be calculated from birth and death rates, Rate of Natural Increase= Birth rate-Death rate/10 Or, CBR-CDR/10 2. The Population Growth Rate: (PGR) is the rate which a population is increasing (or decreasing) in a given year due to natural increase and net migration, expressed as a percentage of the base population. The growth rate takes into account all components of population growth i.e., births, deaths and migration. PGR=Birth- Death+ Immigrants-Emigrants/total midyear population*100 Or , PGR= Rate of natural increase ±Net migration rate Annual population growth rate (APGR): It is annual change in population calculated by, APGR=1/t2-t1*P2-P1/P1*100
  • 24. C. Population estimationby MathematicalMethod 1. Arithmetic Progression:Population can be estimated on the assumption that the annual changes in population remain the same. Formula, Pt=Po (1+rt) r=1/t(Pt/Po-1) Where, Pt= Population at any time Po=Base population r=Population growth rate T=time period between the census • 2. Geometric Progession:Population is estimated on the assumption that population increases in geometric progession. • Pt=Po(1+r) 𝟐 and • r=(Pt/Po)1/t-1 • Where, Pt= Population at any time Po=Base population r=Population growth rate T=time period between the census  POPULATION DOUBLING TIME • It is the number of years required for the population of an area to double its present size, given the current rate of population growth. • A country with a constant PGR of 1% would double its population in 70 years. So the formula for calculating population doubling time is given by: • PDT= 7O/PGR