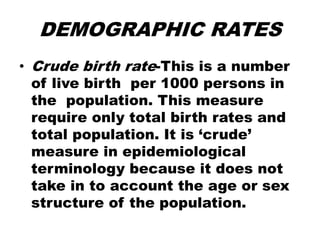
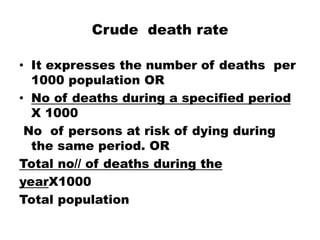
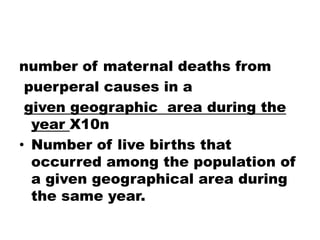
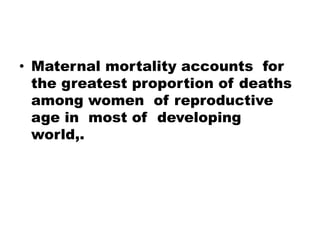
DEMOGRAPHY
OBJECTIVES
• Define Demography
• Know the characteristics of a
population
• Interpret health information
meaning full
• To plan and deliver health care
service effectively
Definition
• It is a scientific description of the
characteristics of population,
structure and changes which can
be measured numerically. This
involves primarily the
measurement of the size of
population(how many people they
are),
composition (what the
characteristics, such as sex and
age of the people), distribution
(where the people in the region
are), and changes in the numbers
of people .The main demographic
processes which lead to changes
in the number of people and
composition of a population are
fertility,mortality and immigration
POPULATION COMPOSITION
• The composition of a population can
be described in terms of factors
such as age, sex, occupation,
income, race or ethnicity, education
and literacy.
• The population composition
determines to a large extent the
types of health problems
experienced and which health
services have to be delivered
population pyramid
• A population pyramid is a useful
summary representative of
certain aspect of population
composition
Definition of population
pyramid
• It is a graphical display of
percentage composition of a
population by age and sex. Age is
usually grouped in five year
intervals. The percentages are
represented by proportionately
drawn horizontal bars. By
convention, the percentage
relating to the males are drawn on
the left of the pyramid
And the females on the right. The
age groups are drown from the
youngest at the bottom of the
pyramid to the oldest at the top.
The shape of the pyramid is
influenced by births, deaths and
migration on the population.
• A developing country with high
birth rate and low life expectancy
will have a birth rate and low life
expectancy will have a high
proportion of young people and
therefore, a population pyramid
with a triangular shape and a
broad base.
• On the other hand, a developed
country with higher life
expectancy, will have a higher
percentage of people in the older
age groups and therefore
population pyramid with narrow
base and steeper side. Events
such as famines,wars,or mass
migration in the recent past will
Will be reflected in the shape of
pyramid.
Population growth
Three processes determine the
changing of a population( fertility,
mortality and migration) The
balance between these three
determines whether a population
increases, decreases or remains
stable in size.
CENSUS
• Definition- this is the head
counting of all people in a locality
be it a country. As for Zambia it is
done every 10 years.
Reasons for census
• Government require information
for planning and development,
therefore many people are
interested in the information
obtained in census.
Ways of conducting census
• Earliest census was done by
gathering people in one place. This
worked well in small communities
but can not be used on large scale.
• Counting the houses in an area and
multiplying by the average number
of occupants per house has also
been tried in many parts of Africa.
• This gives an approximately
number of people in a community
• This is not accurate on a larger
scale but is sometimes useful for
making a quick estimate of a
number of people in a village.
• Nowadays, enumerators going
from house to house asking for
information from head of the
households is the approach most
commonly used in taking a
population census. In carrying out
the census, either of the
following methods are used.
• Firstly counting all people in the
place they are found during
census also called the de facto
approach, and secondly,
enumerating all people from their
usual place of residence which is
technically referred to as the de
jure approach.
• Generally a population census is
a very expensive undertaking and
therefore carried out after every
10 years.
DEMOGRAPHIC RATES
• Crude birth rate-This is a number
of live birth per 1000 persons in
the population. This measure
require only total birth rates and
total population. It is ‘crude’
measure in epidemiological
terminology because it does not
take in to account the age or sex
structure of the population.
• NO of live births during yearX1000
Total population
Crude death rate
• It expresses the number of deaths per
1000 population OR
• No of deaths during a specified period
X 1000
No of persons at risk of dying during
the same period. OR
Total no// of deaths during the
yearX1000
Total population
• The main disadvantage of crude
dearth rate(crude mortality rate)is
that it does not take in to account
the fact that the chance of dying
varies according to Age, Sex,
Socio- economic class and other
economic factors.
INFANT MORTALITY
• It measures the rate of death in
children during the first year of
life.
• The denominator being the
number of live births in the same
year. OR
• It is one of the most universally
accepted indicator of the level of
health status not only of infants,
but also of the whole population
and socio-economic conditions
under which they live.
• In addition, the infant mortality
rate is a sensitive indicator of the
availability , underutilization and
effectiveness of health care
services, particularly perinatal
care
• Number of deaths under the age
of one year divided by the number
of live births in a given year
expressed as a rate per 1000 live
births.
• No// of deaths in a year of children
less than 1 year of age X1000
No// of live births in the same year
CHILD MORTALITY
• The child mortality rate(under 5
rate) is based on deaths of
children aged 1 up to 4 years and
some months, but before 5 years
It is also used as a base of health
indicator. Injuries, malnutrition
and infectious diseases are
common causes of death in this
group. It excludes infant
mortality
• It is described as the probability
(expressed per 1000 live births )
of a child dying before reaching
the age of 5 years.
• No//of deaths under
5 years of age X1000/ 10000
Total number of population of
children below 5 years
Maternal
(puerperal)Mortality Rate
• The maternal mortality rate refers
to the risk of mothers dying from
causes associated with delivery
of babies, complications of
pregnancy or childbirths. This
important statistic is often
neglected because it is difficult to
calculate accurately
number of maternal deaths from
puerperal causes in a
given geographic area during the
year X10n
• Number of live births that
occurred among the population of
a given geographical area during
the same year.
• Maternal mortality accounts for
the greatest proportion of deaths
among women of reproductive
age in most of developing
world,.

DEMOGRAPHY (2).ppt

  • 1.
    DEMOGRAPHY OBJECTIVES • Define Demography •Know the characteristics of a population • Interpret health information meaning full • To plan and deliver health care service effectively
  • 2.
    Definition • It isa scientific description of the characteristics of population, structure and changes which can be measured numerically. This involves primarily the measurement of the size of population(how many people they are),
  • 3.
    composition (what the characteristics,such as sex and age of the people), distribution (where the people in the region are), and changes in the numbers of people .The main demographic processes which lead to changes in the number of people and composition of a population are fertility,mortality and immigration
  • 4.
    POPULATION COMPOSITION • Thecomposition of a population can be described in terms of factors such as age, sex, occupation, income, race or ethnicity, education and literacy. • The population composition determines to a large extent the types of health problems experienced and which health services have to be delivered
  • 5.
    population pyramid • Apopulation pyramid is a useful summary representative of certain aspect of population composition
  • 6.
    Definition of population pyramid •It is a graphical display of percentage composition of a population by age and sex. Age is usually grouped in five year intervals. The percentages are represented by proportionately drawn horizontal bars. By convention, the percentage relating to the males are drawn on the left of the pyramid
  • 7.
    And the femaleson the right. The age groups are drown from the youngest at the bottom of the pyramid to the oldest at the top. The shape of the pyramid is influenced by births, deaths and migration on the population.
  • 8.
    • A developingcountry with high birth rate and low life expectancy will have a birth rate and low life expectancy will have a high proportion of young people and therefore, a population pyramid with a triangular shape and a broad base.
  • 9.
    • On theother hand, a developed country with higher life expectancy, will have a higher percentage of people in the older age groups and therefore population pyramid with narrow base and steeper side. Events such as famines,wars,or mass migration in the recent past will
  • 10.
    Will be reflectedin the shape of pyramid. Population growth Three processes determine the changing of a population( fertility, mortality and migration) The balance between these three determines whether a population increases, decreases or remains stable in size.
  • 11.
    CENSUS • Definition- thisis the head counting of all people in a locality be it a country. As for Zambia it is done every 10 years.
  • 12.
    Reasons for census •Government require information for planning and development, therefore many people are interested in the information obtained in census.
  • 13.
    Ways of conductingcensus • Earliest census was done by gathering people in one place. This worked well in small communities but can not be used on large scale. • Counting the houses in an area and multiplying by the average number of occupants per house has also been tried in many parts of Africa.
  • 14.
    • This givesan approximately number of people in a community • This is not accurate on a larger scale but is sometimes useful for making a quick estimate of a number of people in a village.
  • 15.
    • Nowadays, enumeratorsgoing from house to house asking for information from head of the households is the approach most commonly used in taking a population census. In carrying out the census, either of the following methods are used.
  • 16.
    • Firstly countingall people in the place they are found during census also called the de facto approach, and secondly, enumerating all people from their usual place of residence which is technically referred to as the de jure approach.
  • 17.
    • Generally apopulation census is a very expensive undertaking and therefore carried out after every 10 years.
  • 18.
    DEMOGRAPHIC RATES • Crudebirth rate-This is a number of live birth per 1000 persons in the population. This measure require only total birth rates and total population. It is ‘crude’ measure in epidemiological terminology because it does not take in to account the age or sex structure of the population.
  • 19.
    • NO oflive births during yearX1000 Total population
  • 20.
    Crude death rate •It expresses the number of deaths per 1000 population OR • No of deaths during a specified period X 1000 No of persons at risk of dying during the same period. OR Total no// of deaths during the yearX1000 Total population
  • 21.
    • The maindisadvantage of crude dearth rate(crude mortality rate)is that it does not take in to account the fact that the chance of dying varies according to Age, Sex, Socio- economic class and other economic factors.
  • 22.
    INFANT MORTALITY • Itmeasures the rate of death in children during the first year of life. • The denominator being the number of live births in the same year. OR
  • 23.
    • It isone of the most universally accepted indicator of the level of health status not only of infants, but also of the whole population and socio-economic conditions under which they live.
  • 24.
    • In addition,the infant mortality rate is a sensitive indicator of the availability , underutilization and effectiveness of health care services, particularly perinatal care
  • 25.
    • Number ofdeaths under the age of one year divided by the number of live births in a given year expressed as a rate per 1000 live births. • No// of deaths in a year of children less than 1 year of age X1000 No// of live births in the same year
  • 26.
    CHILD MORTALITY • Thechild mortality rate(under 5 rate) is based on deaths of children aged 1 up to 4 years and some months, but before 5 years It is also used as a base of health indicator. Injuries, malnutrition and infectious diseases are common causes of death in this group. It excludes infant mortality
  • 27.
    • It isdescribed as the probability (expressed per 1000 live births ) of a child dying before reaching the age of 5 years. • No//of deaths under 5 years of age X1000/ 10000 Total number of population of children below 5 years
  • 28.
    Maternal (puerperal)Mortality Rate • Thematernal mortality rate refers to the risk of mothers dying from causes associated with delivery of babies, complications of pregnancy or childbirths. This important statistic is often neglected because it is difficult to calculate accurately
  • 29.
    number of maternaldeaths from puerperal causes in a given geographic area during the year X10n • Number of live births that occurred among the population of a given geographical area during the same year.
  • 30.
    • Maternal mortalityaccounts for the greatest proportion of deaths among women of reproductive age in most of developing world,.