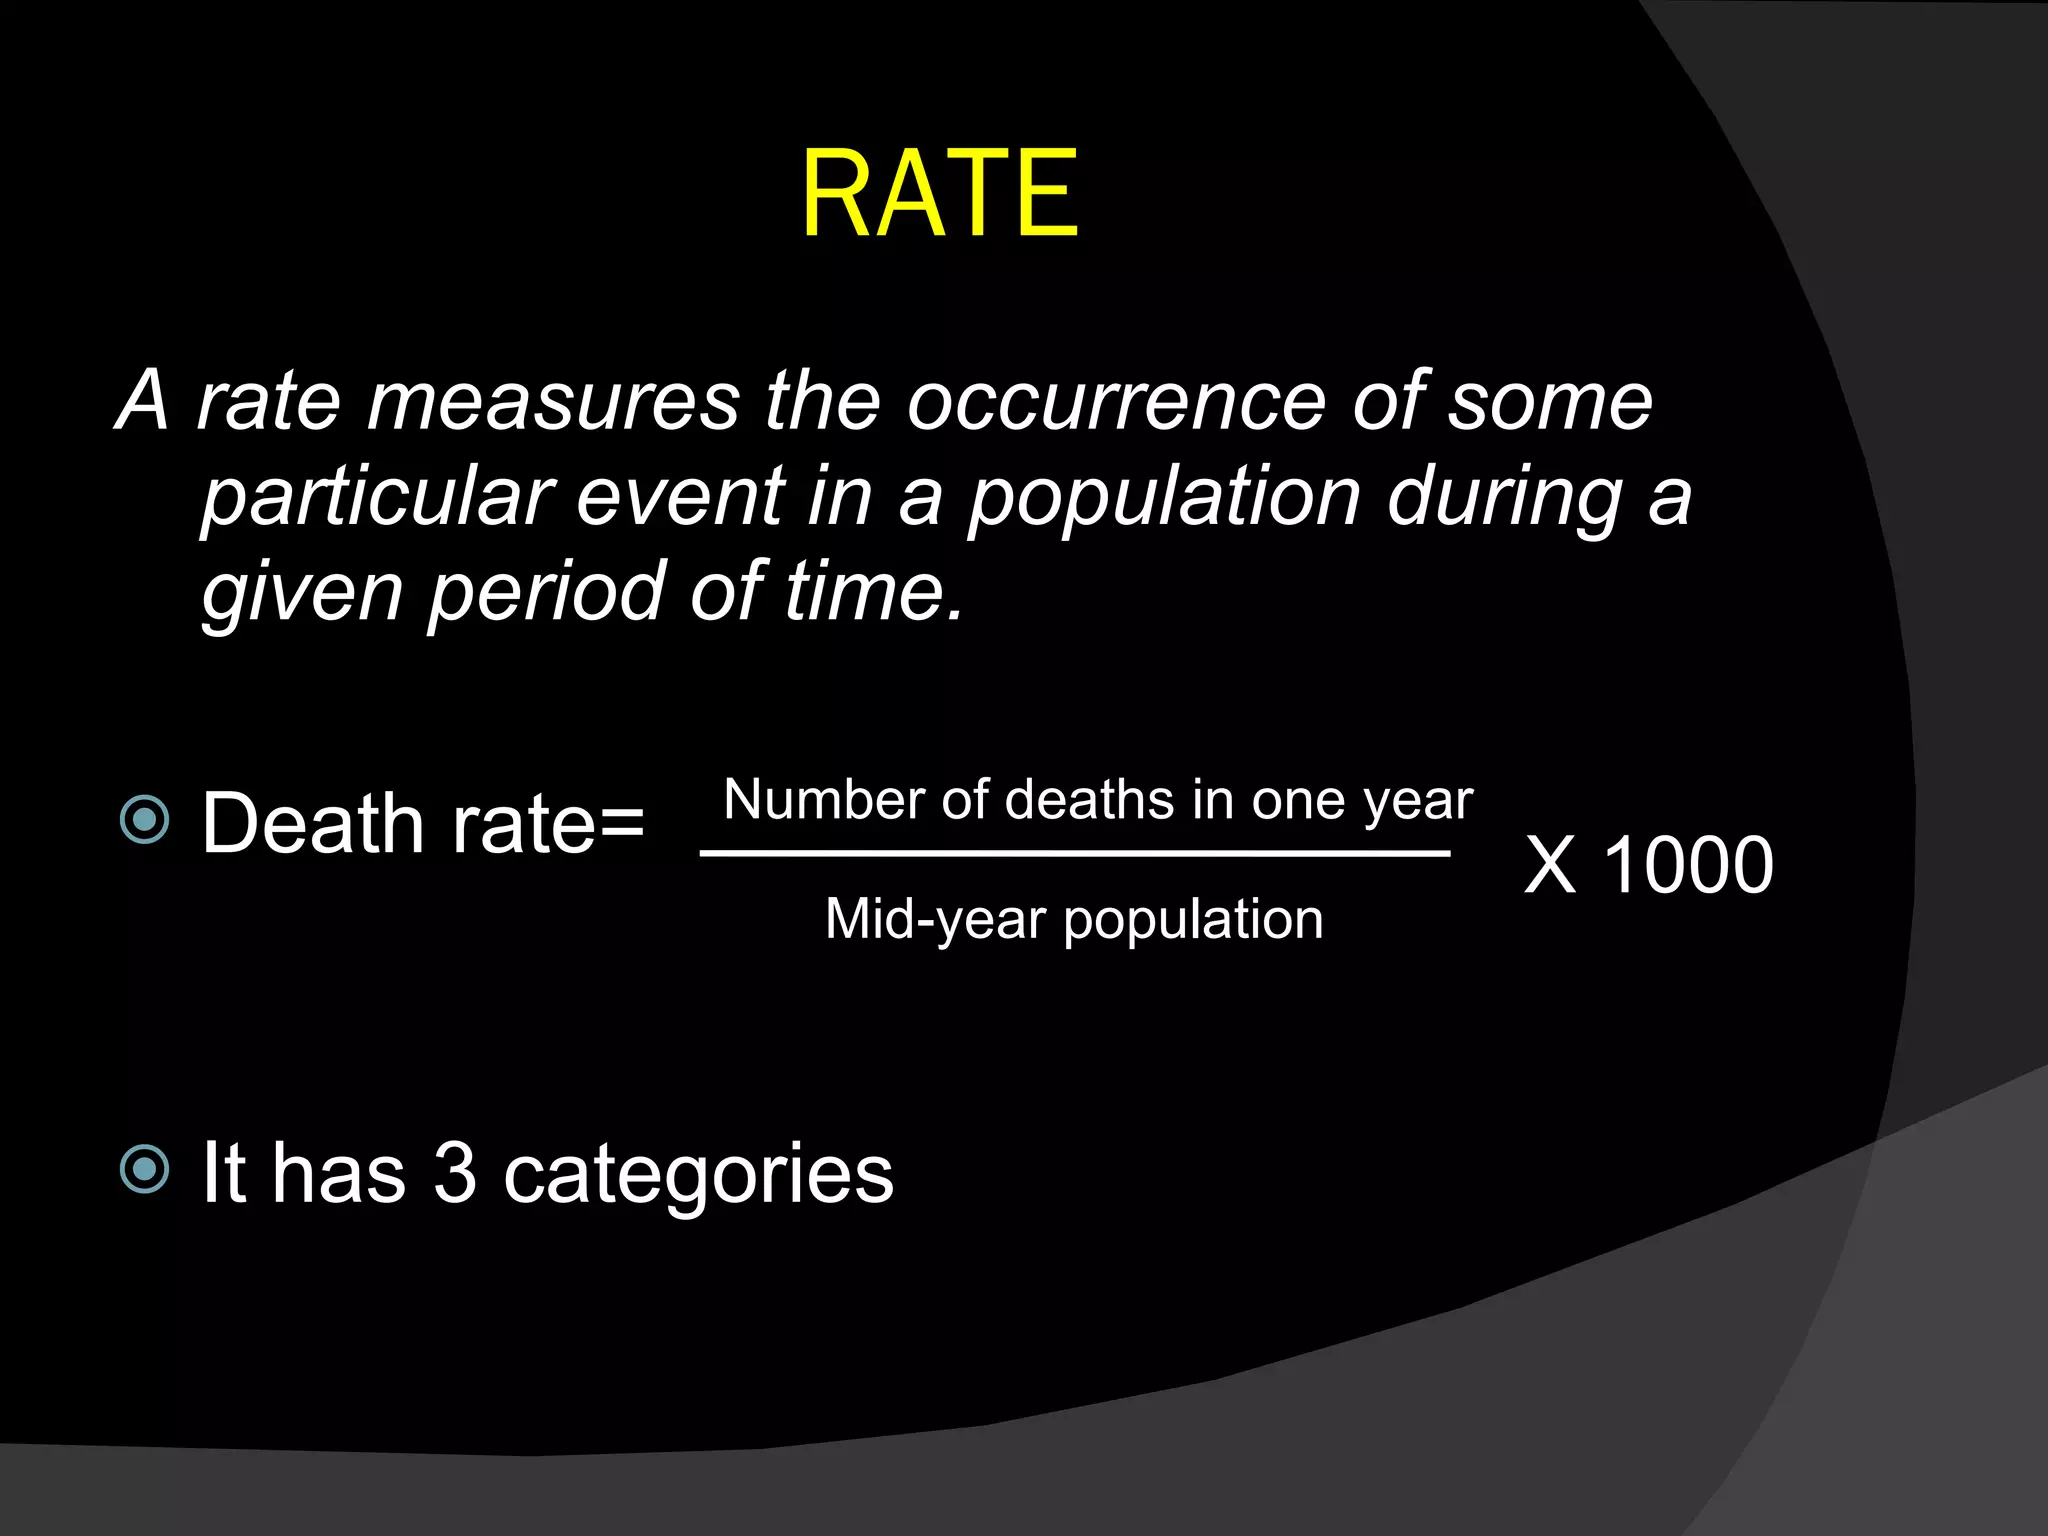
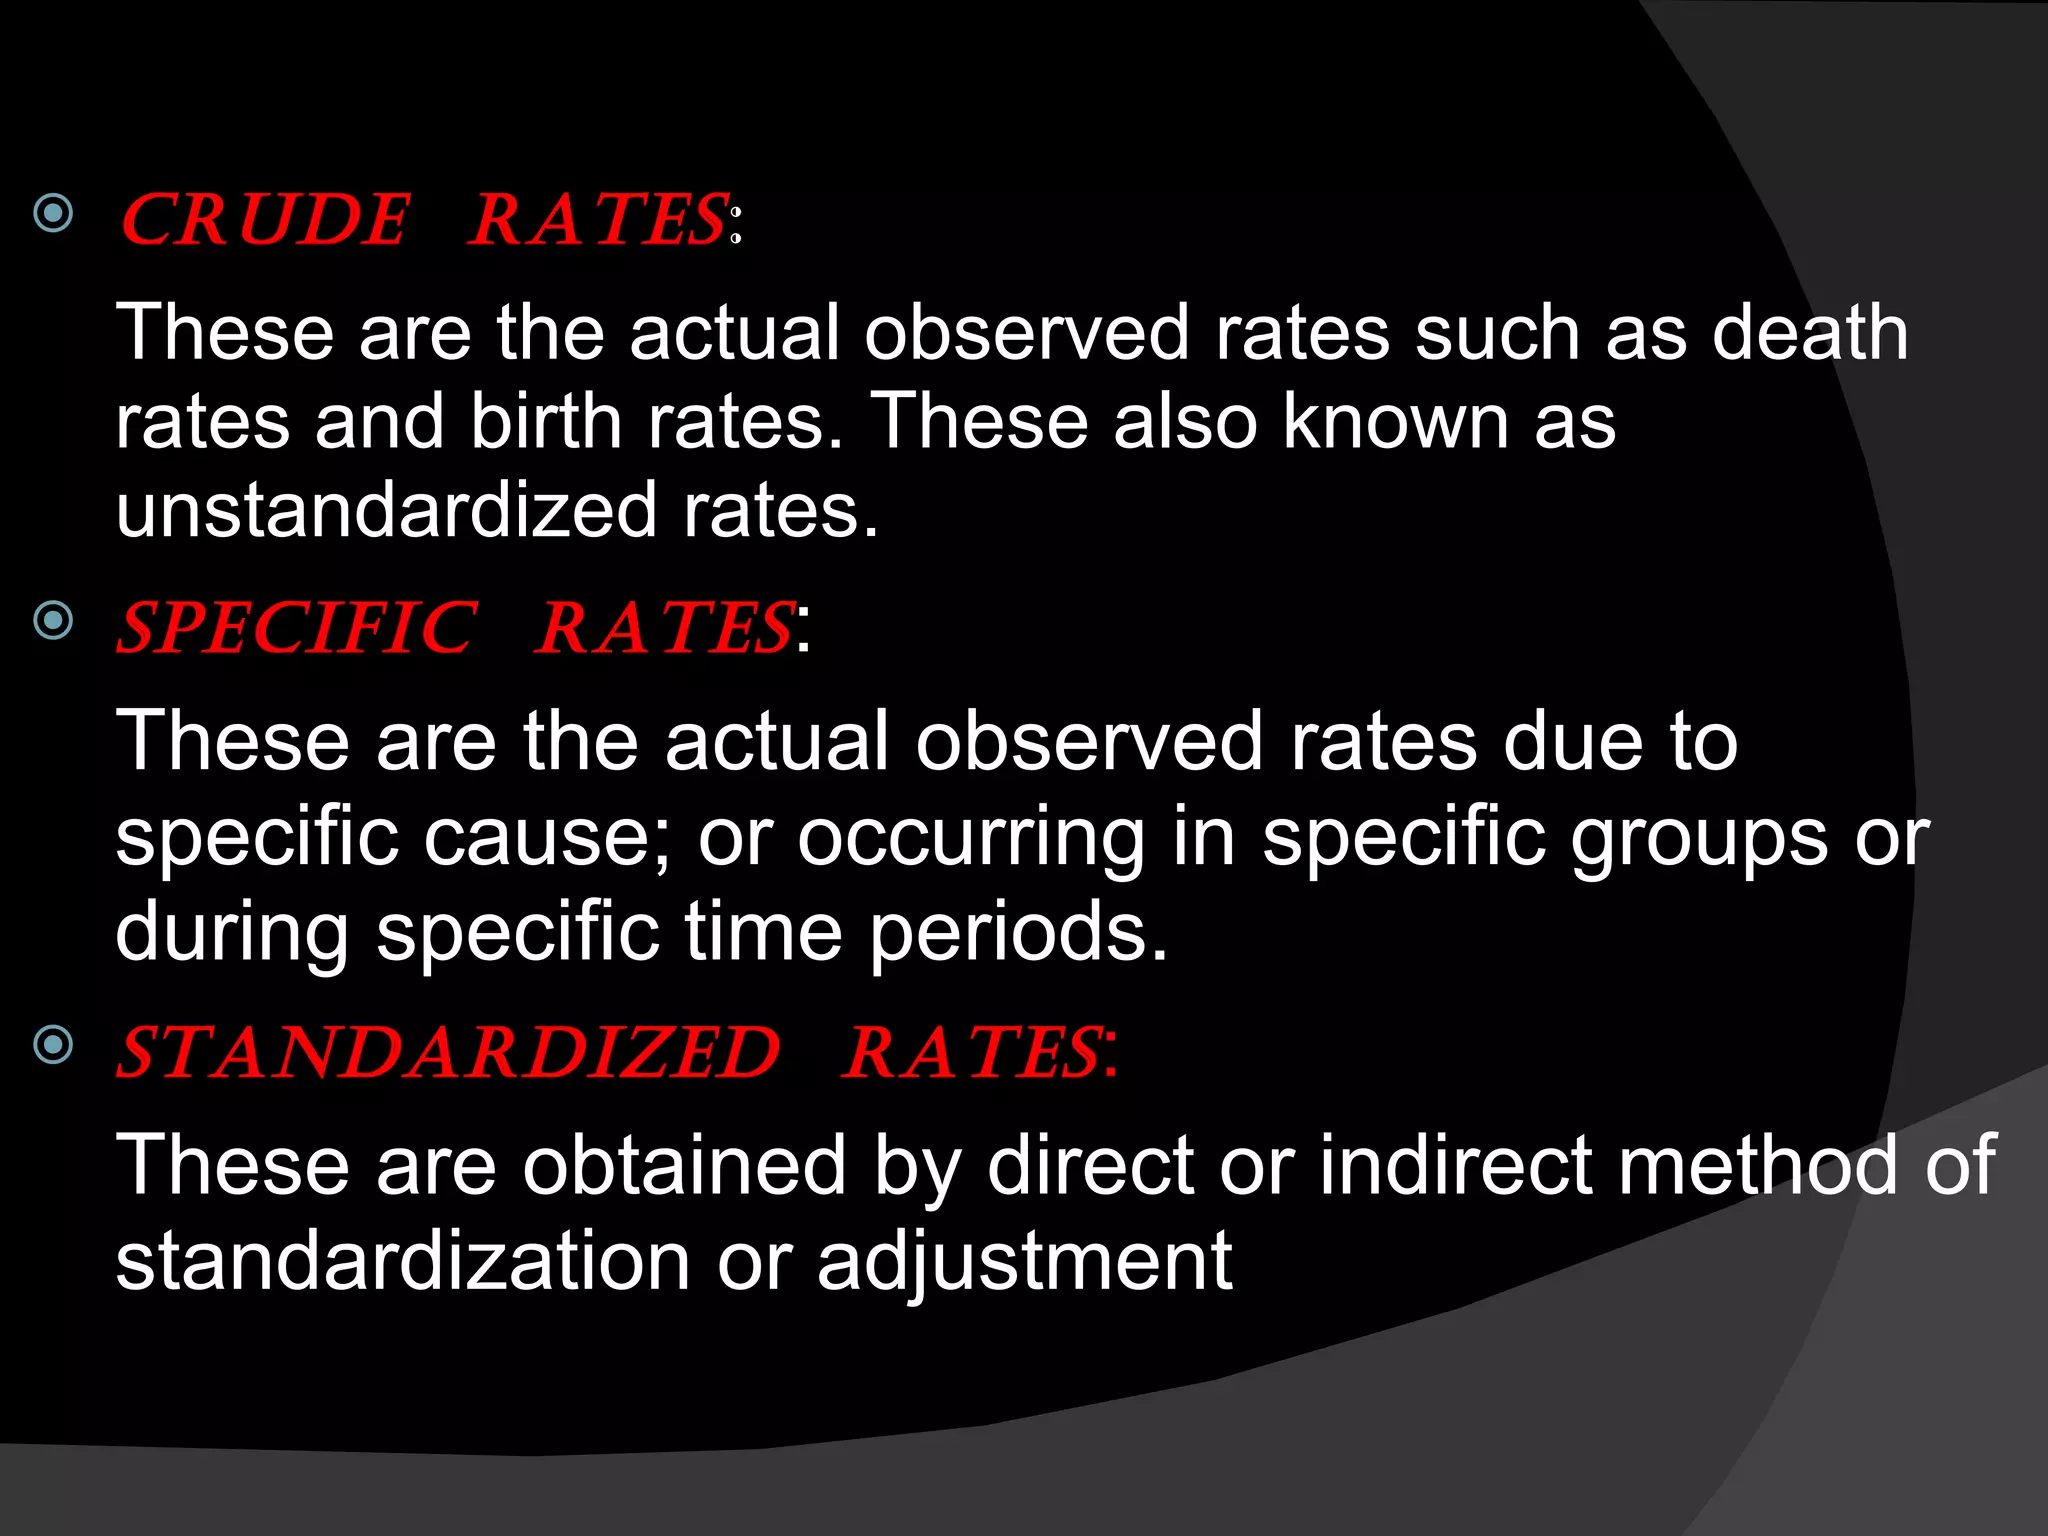
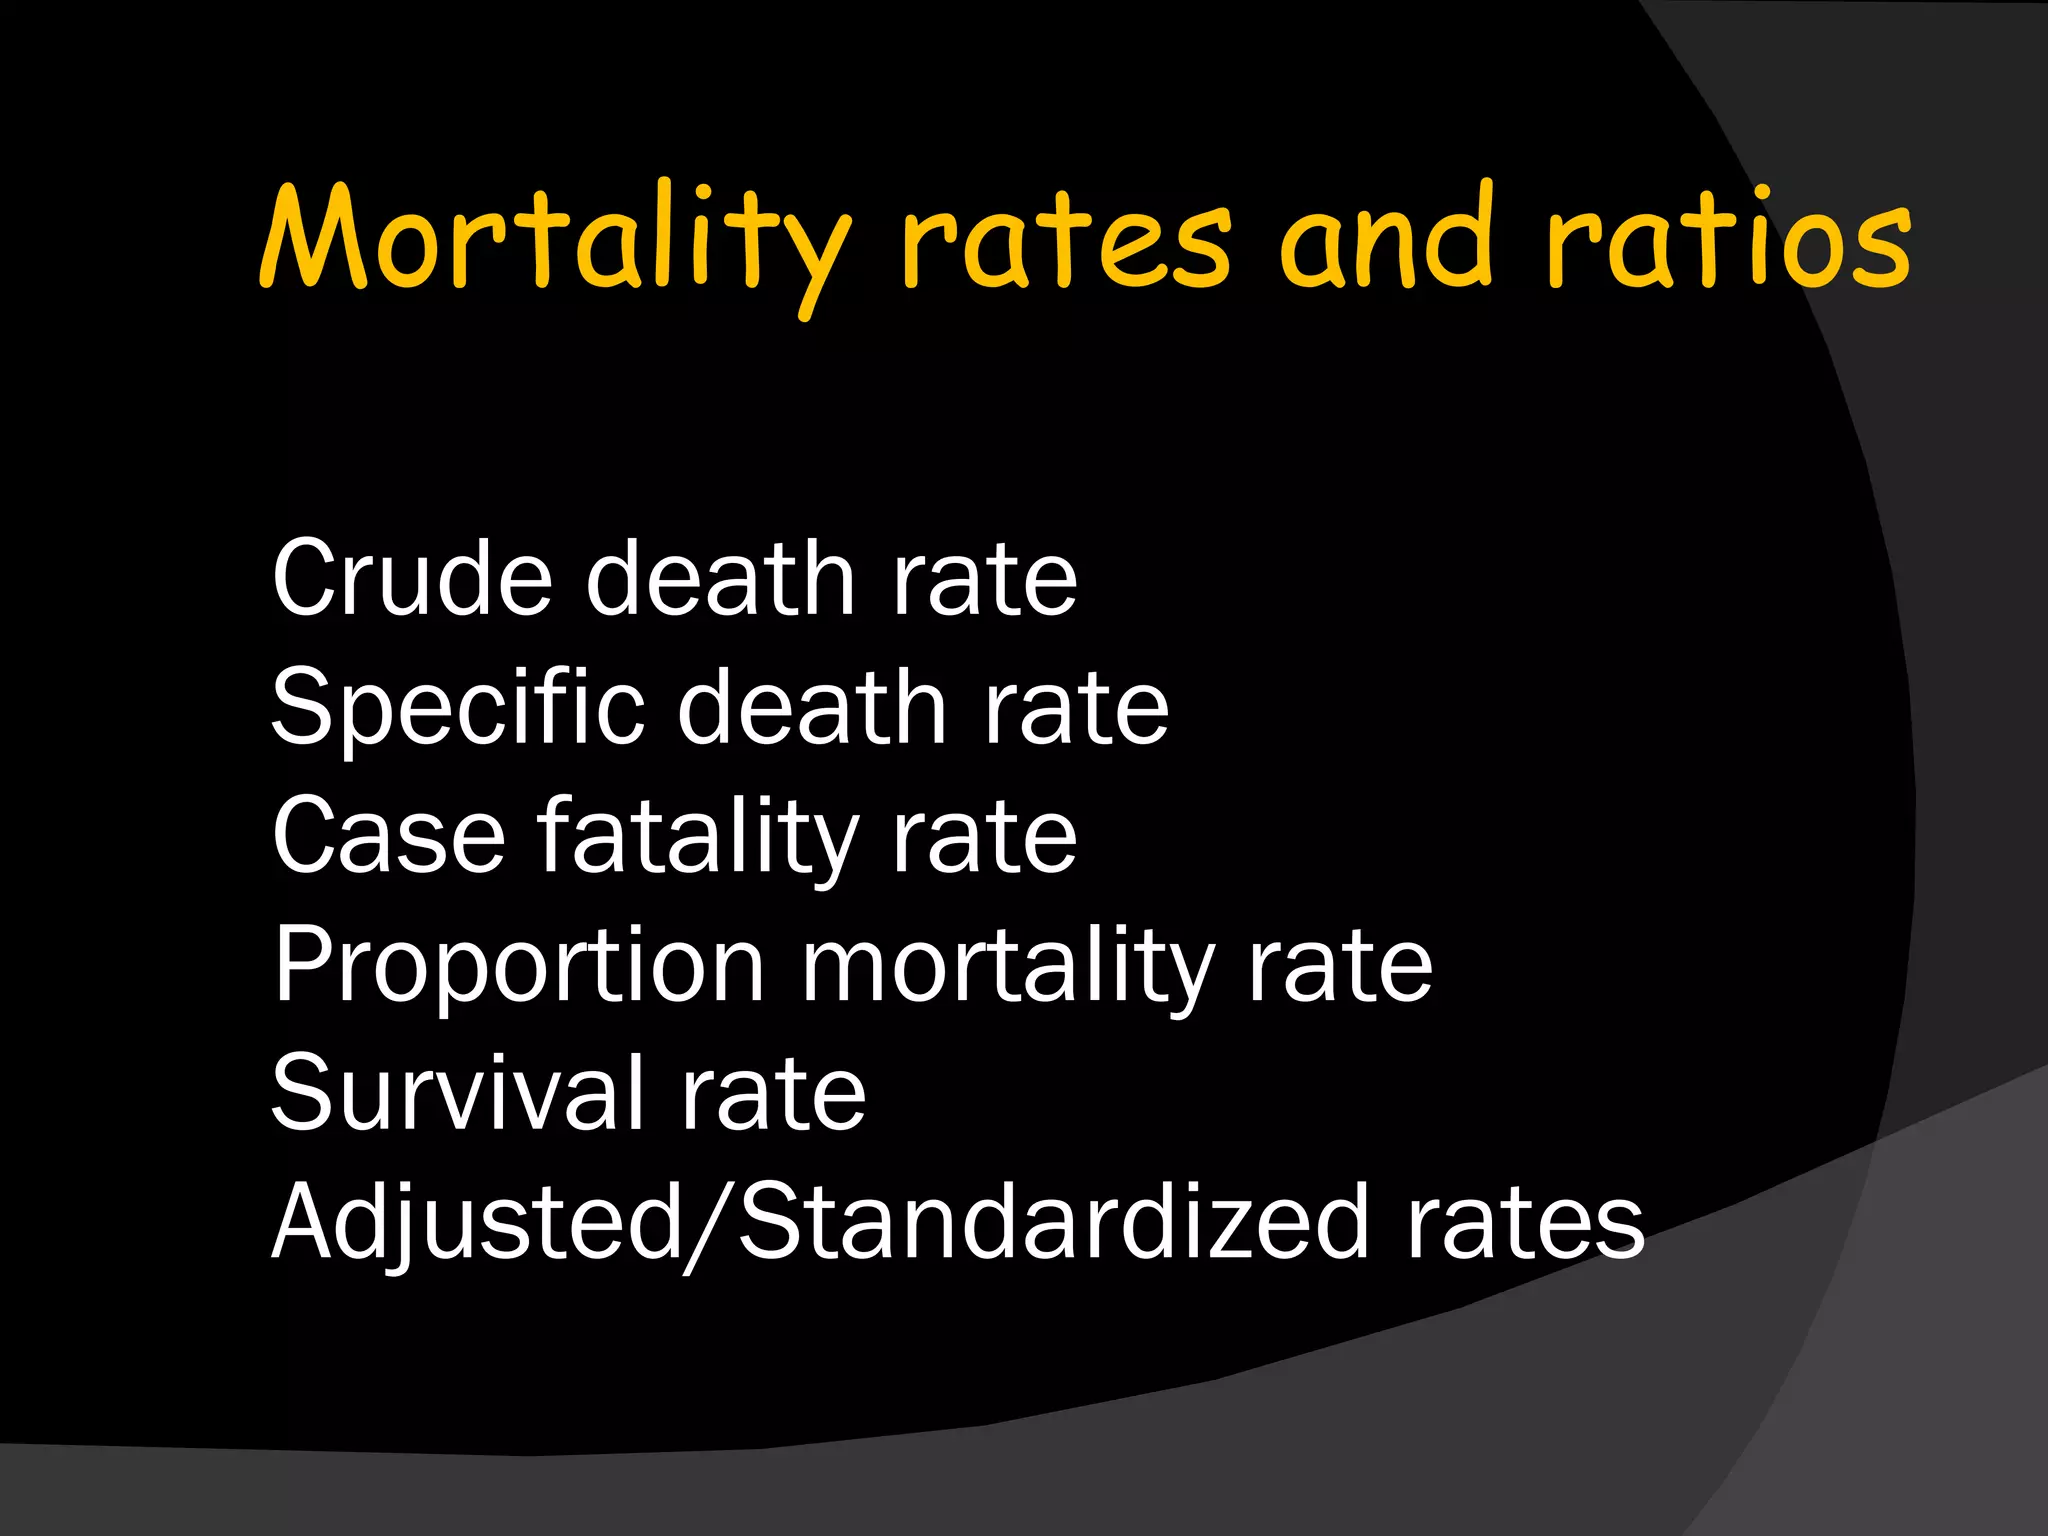
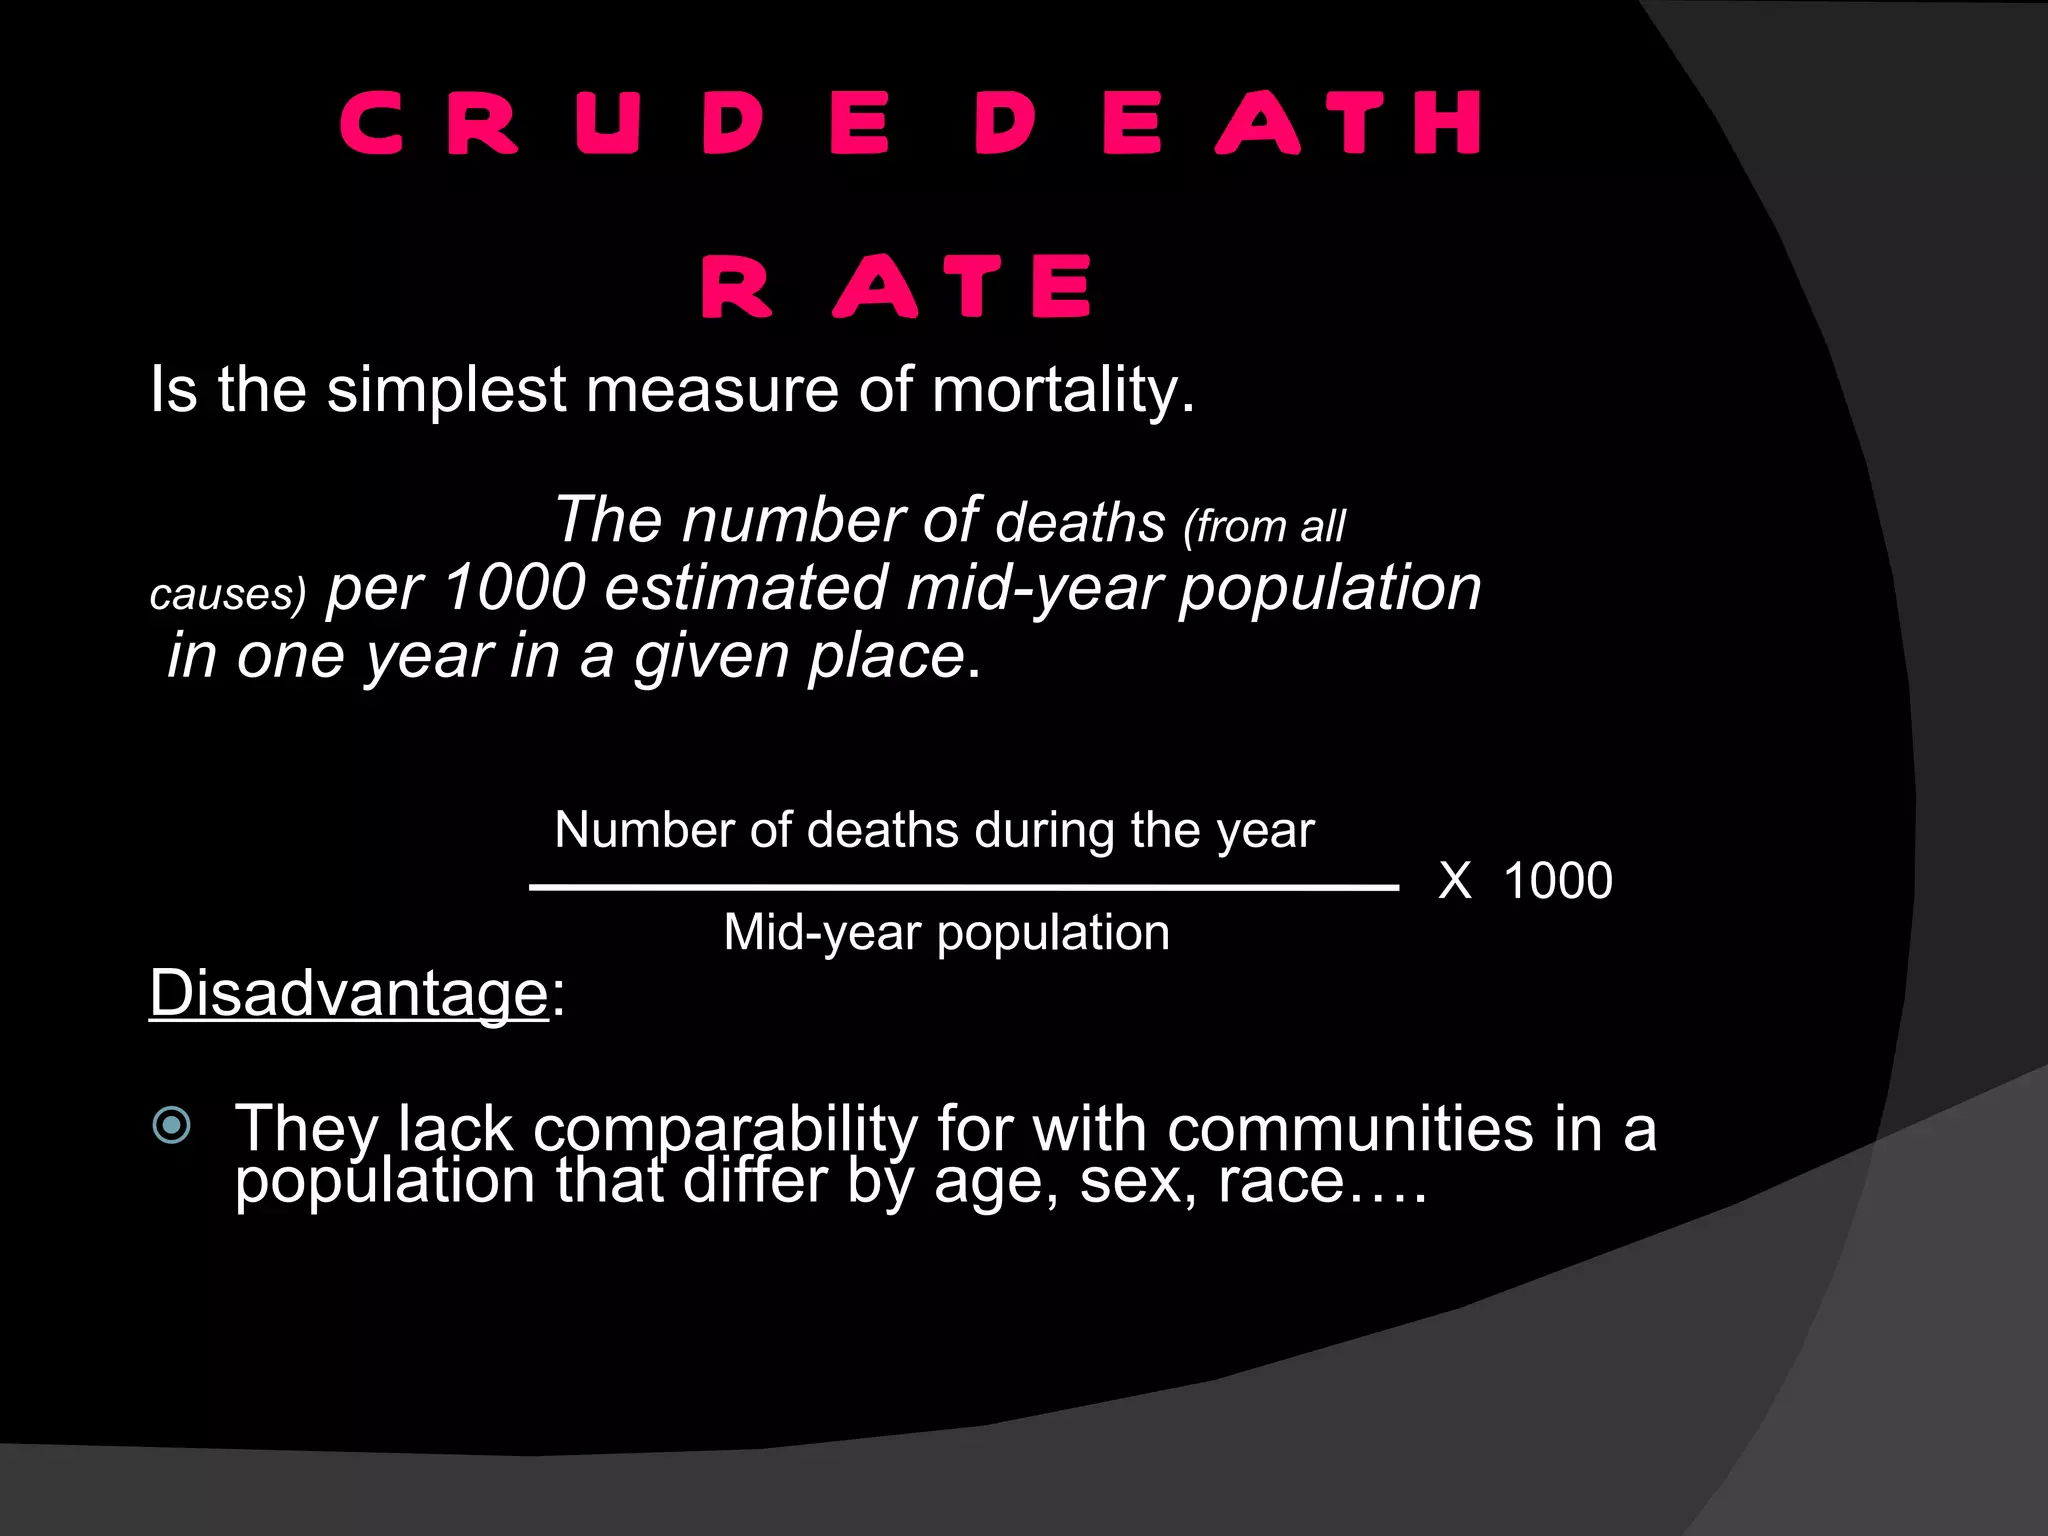
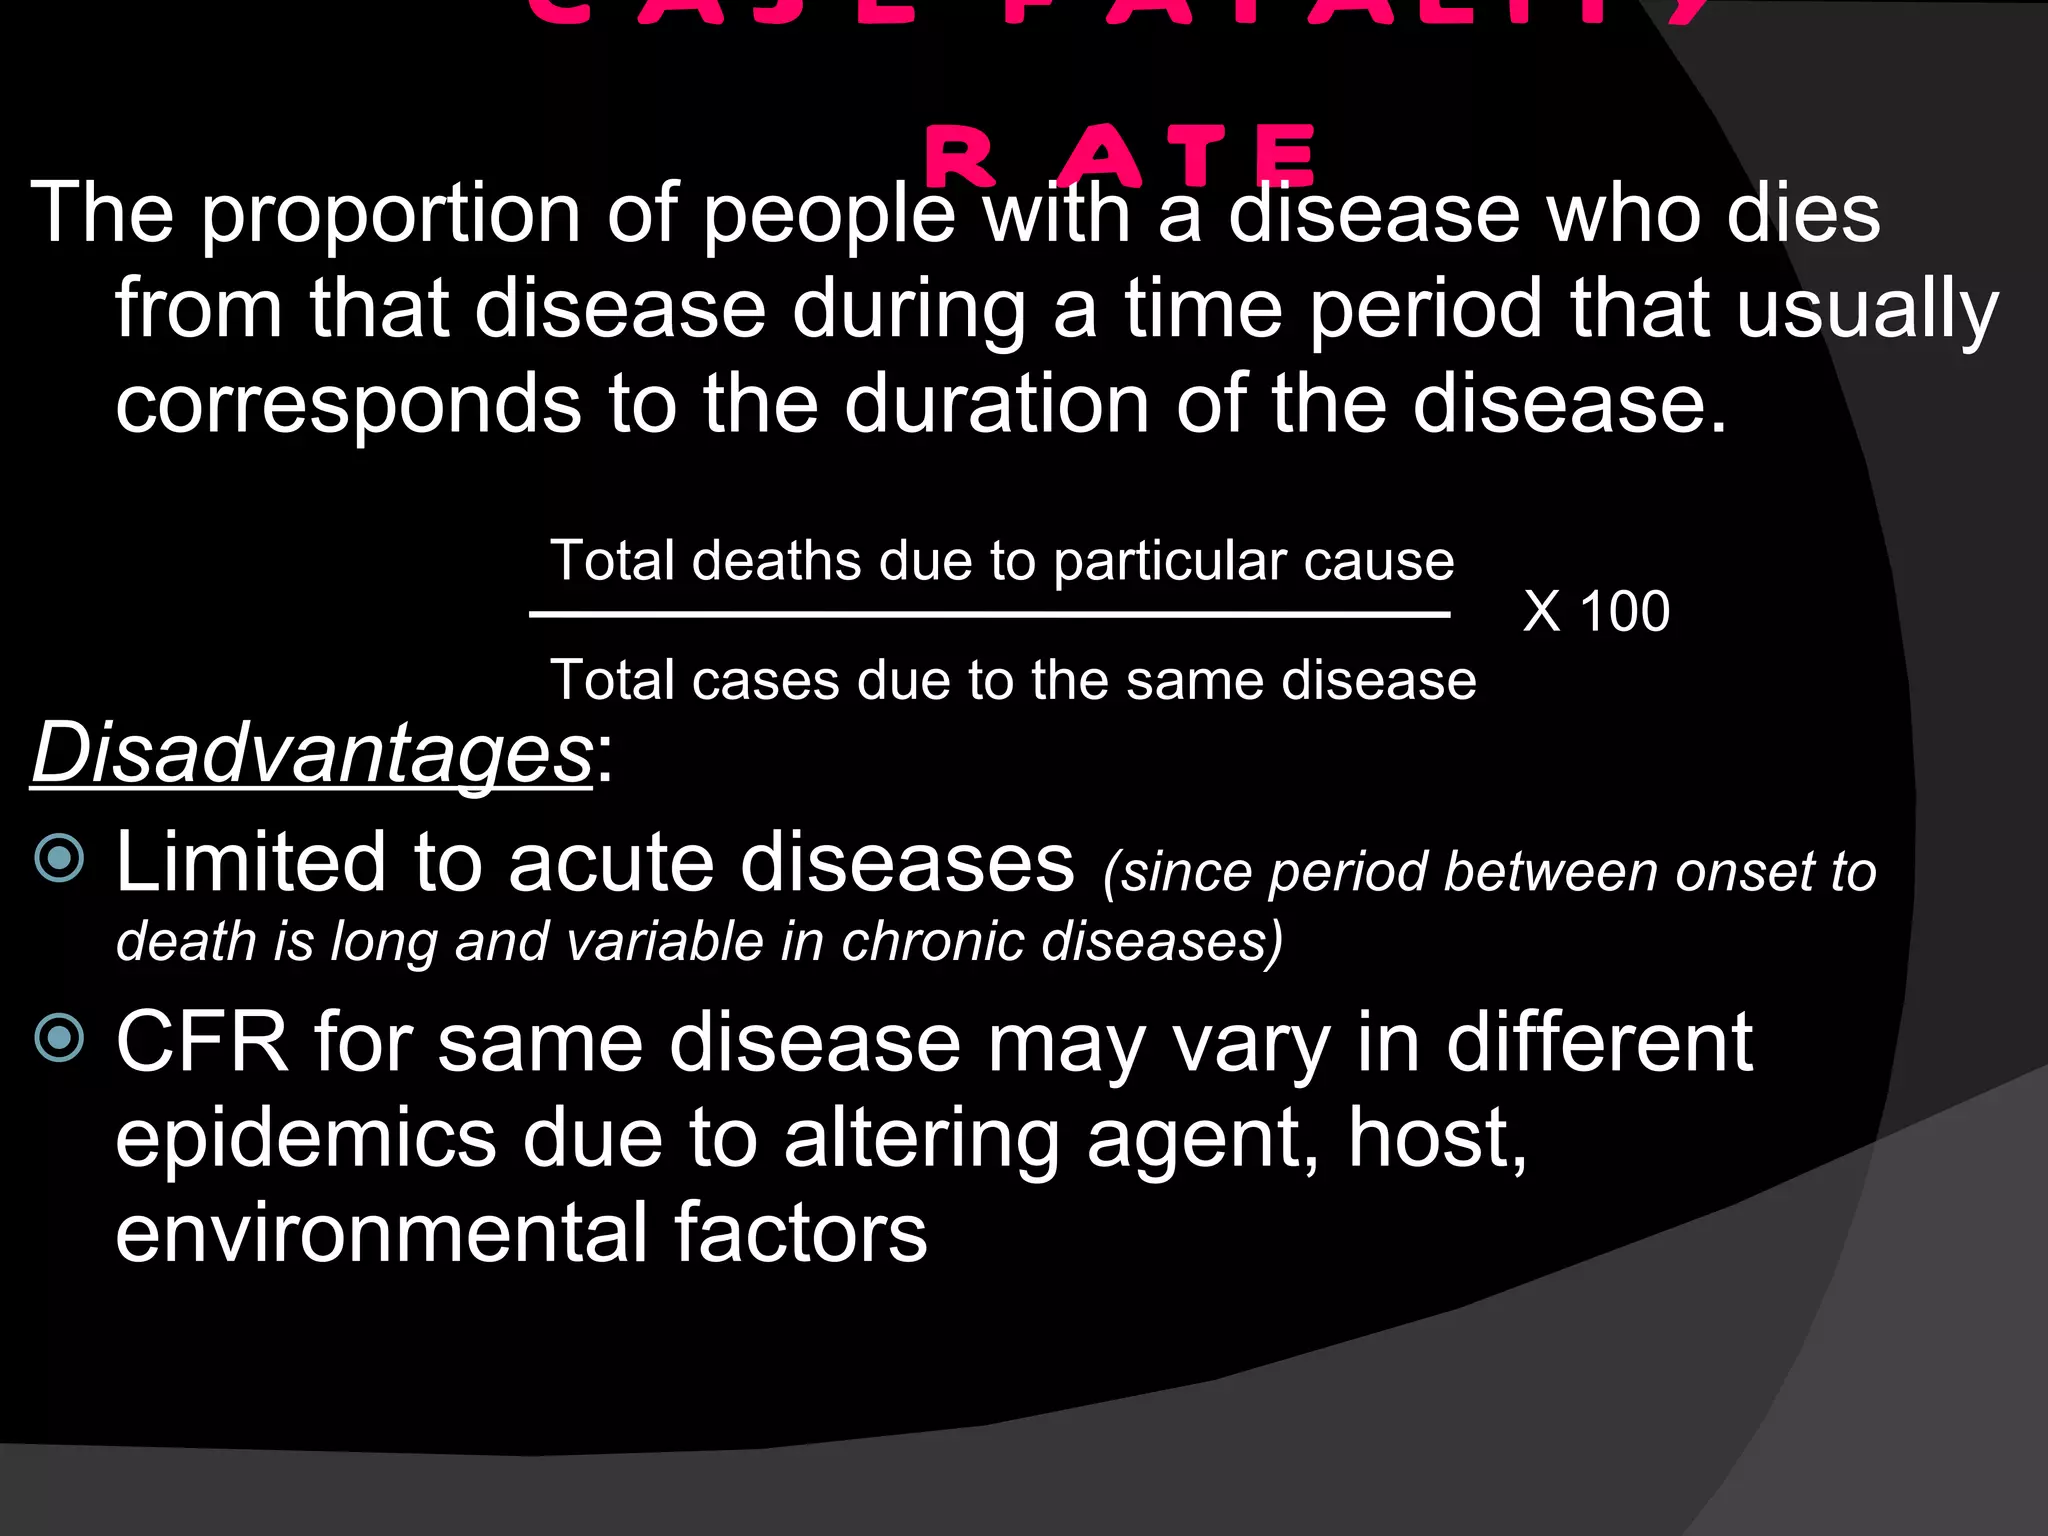
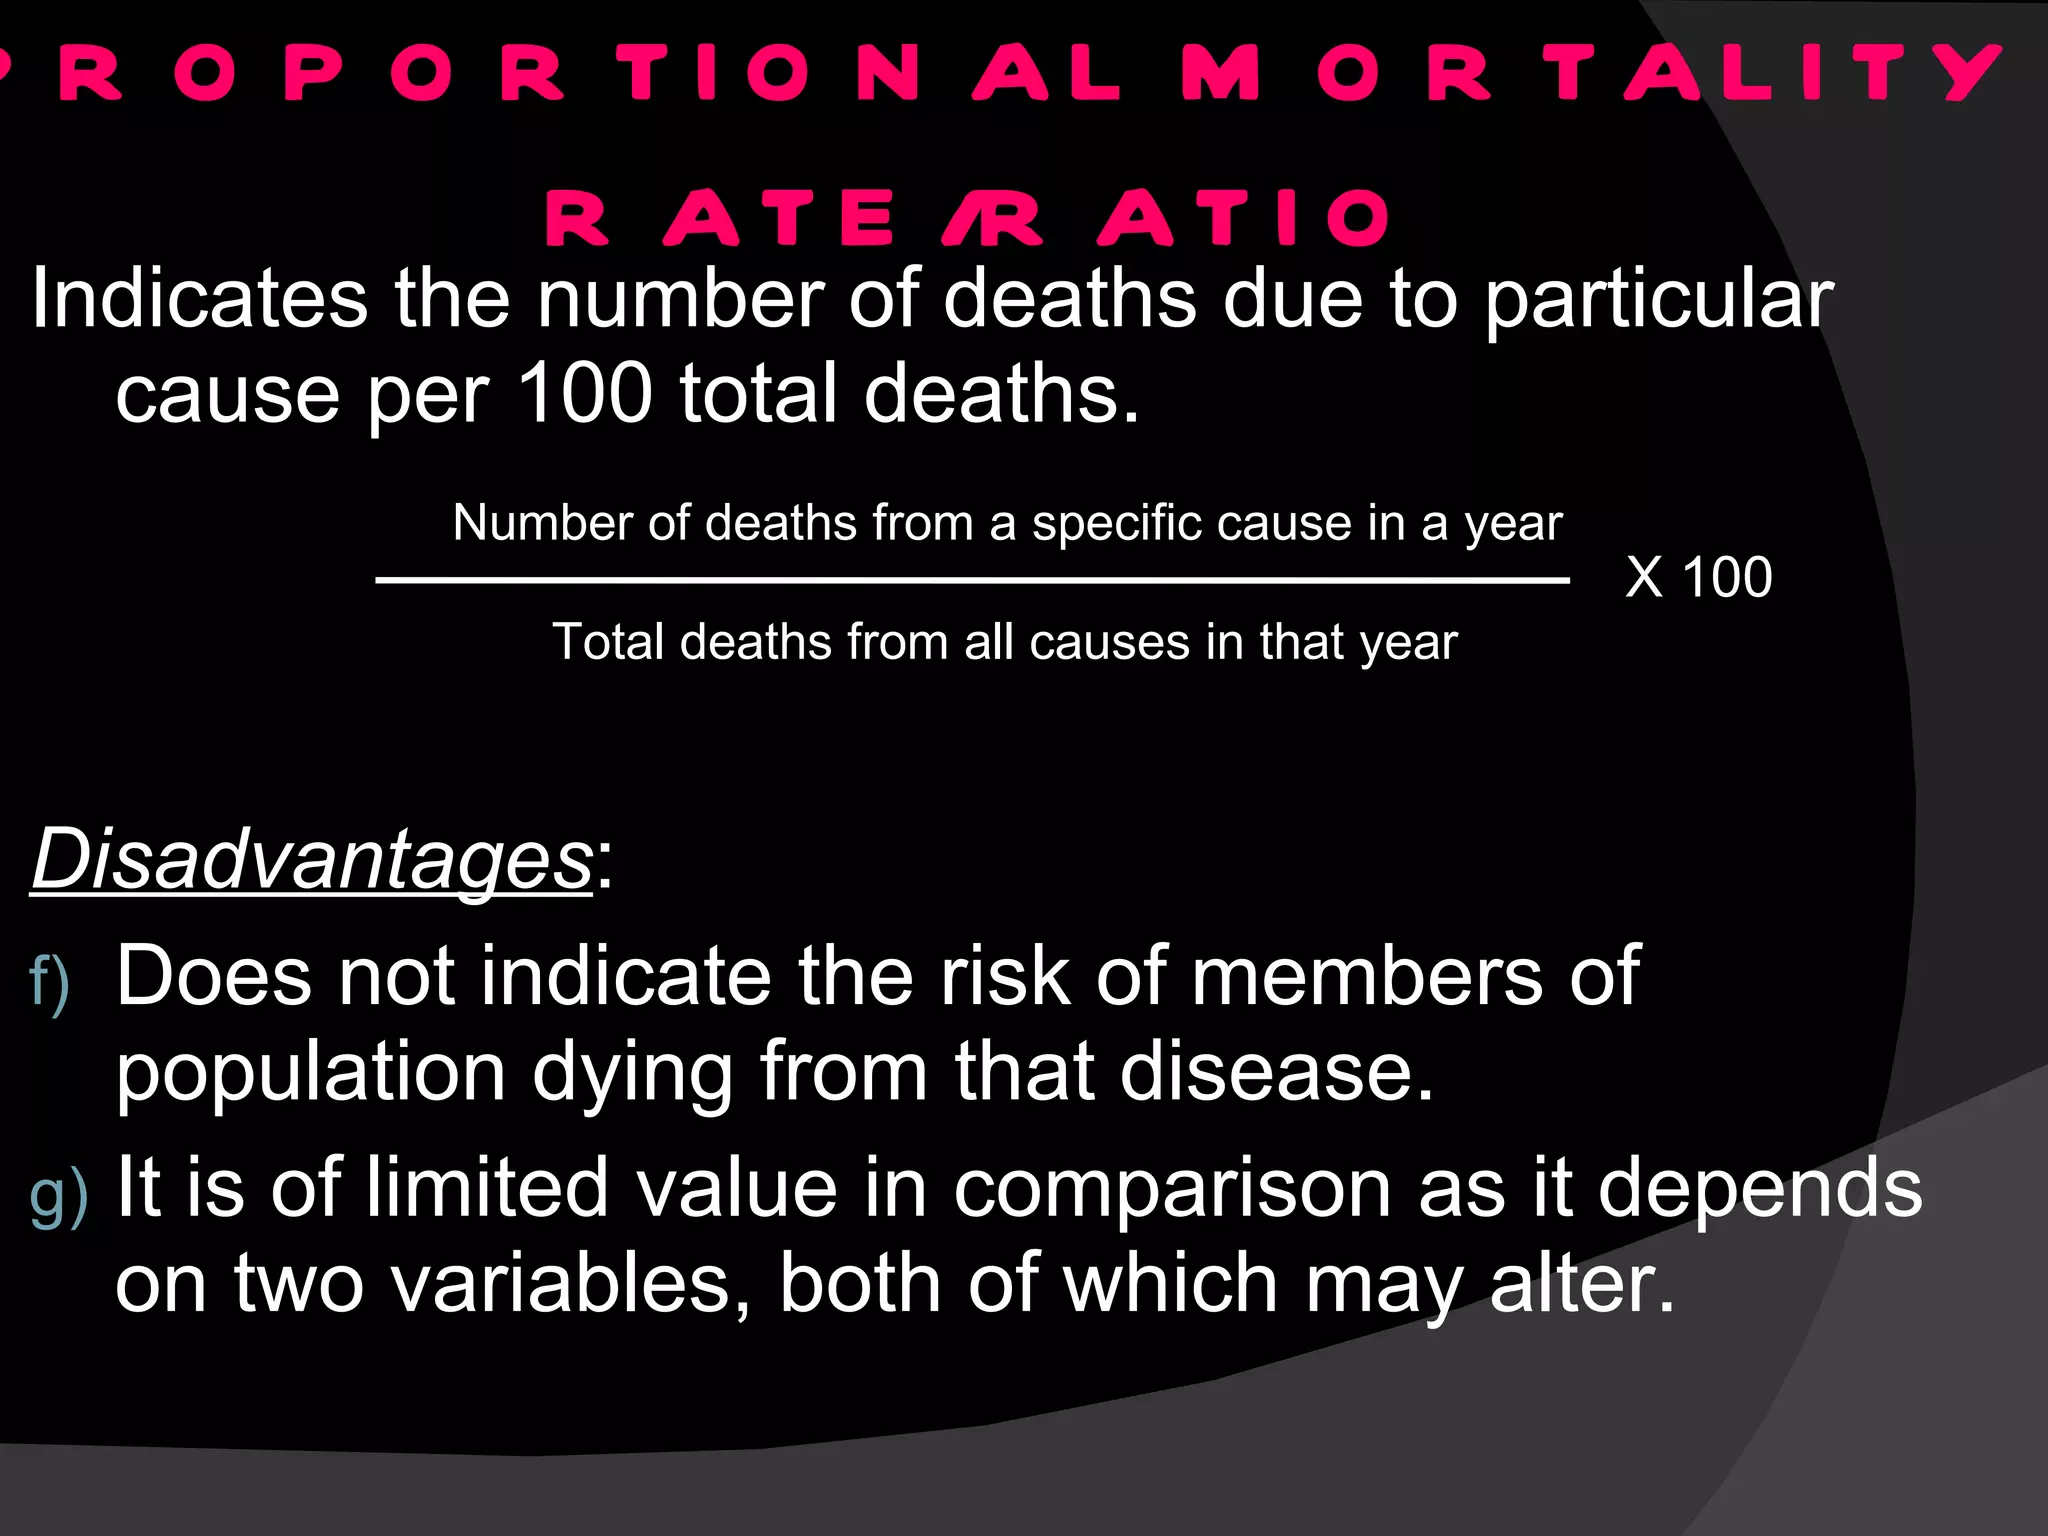
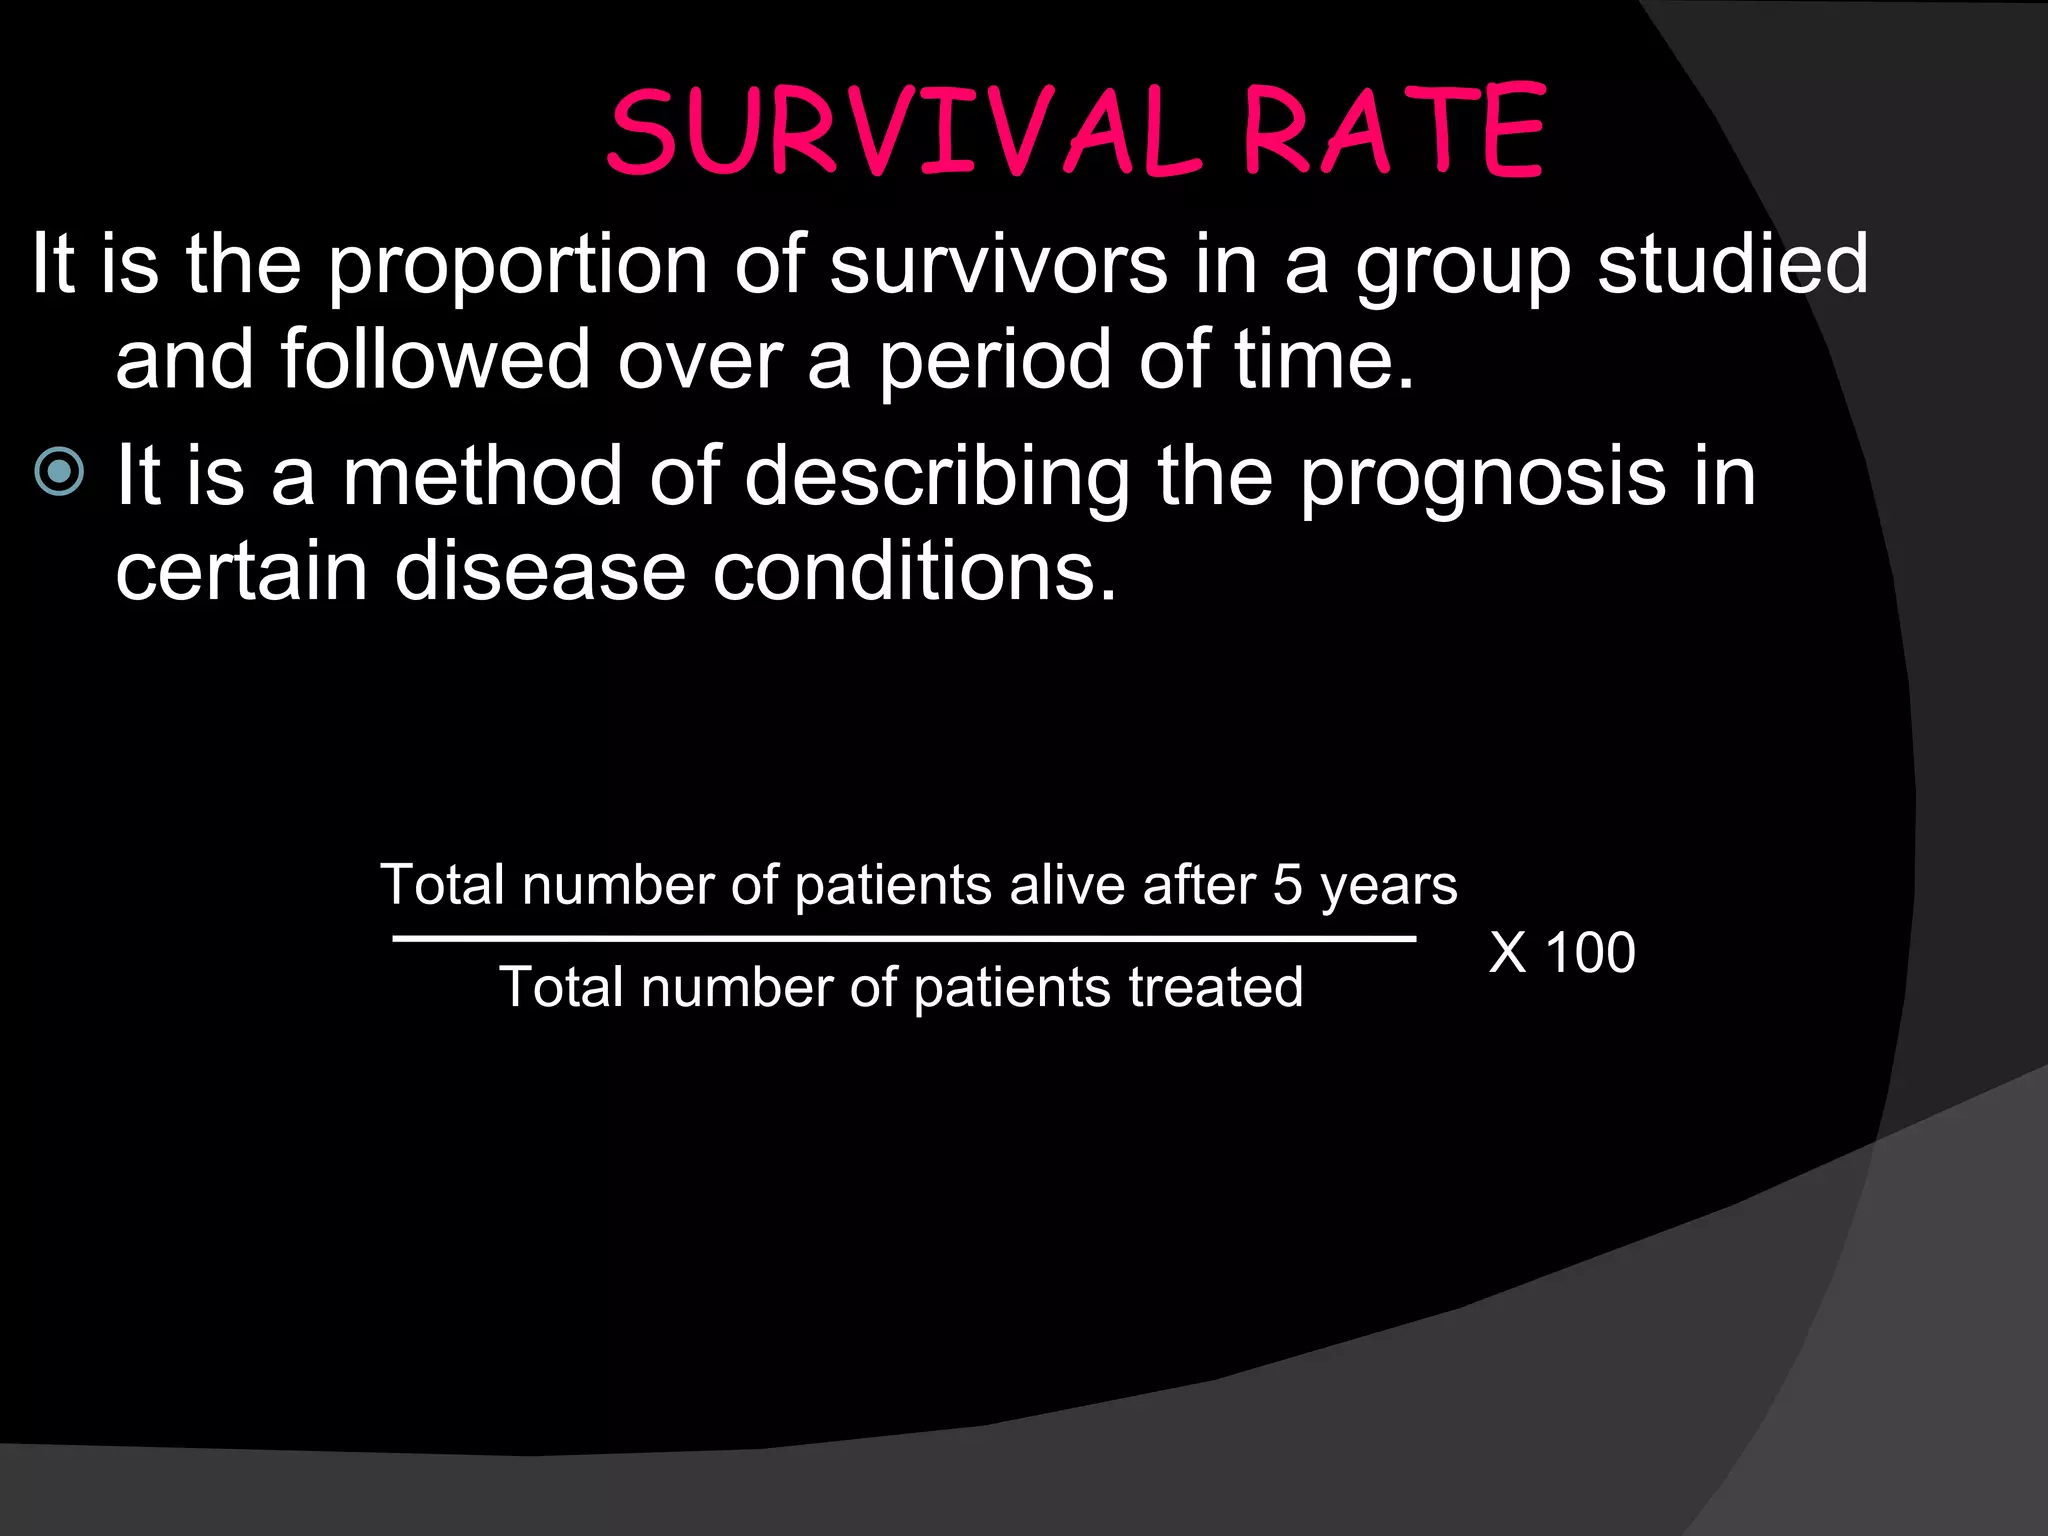
-   RAM NAIK. M 4 th  Semester
The scope of measurement is very broad and unlimited and includes Measurement of mortality. Measurement of morbidity. Measurement of disability. Measurement of natality. Measurement of presence, absence or distribution of the characteristic of disease. Measurement of medical needs, health care facilities, utilization of health services. Measurement of demographic variables.
Tools of measurement Rate  Ratio Proportions
RATE A rate measures the occurrence of some particular event in a population during a given period of time. Death rate= It has 3 categories Number of deaths in one year Mid-year population X 1000
CRUDE  RATES : These are the actual observed rates such as death rates and birth rates. These also known as unstandardized rates. SPECIFIC  RATES : These are the actual observed rates due to specific cause; or occurring in specific groups or during specific time periods. STANDARDIZED  RATES : These are obtained by direct or indirect method of standardization or adjustment
RATIO It expresses a relation in size between two random quantities. The numerator and denominator may involve an interval of time or may be instantaneous in time Expressed in the form of X:Y or  Ex:  The ratio ratio of WBC and RBC is 1/600. Sex ratio Doctor-population ratio X Y
PROPORTION It is a ratio which indicates the relation in magnitude of a part of a whole. The numerator is always included in the denominator. Ex: Number of children with scabies at certain time Total number of children in the village at same time X 100
MEASUREMENT OF MORTALITY
Definition:- Mortality is a term which means “death” or  describes death and related issues
 
National vital registration systems  (advanced countries) Sample registration systems  (China and India) Household surveys  (to estimate infant and child mortality) Special longitudinal investigations  (maternal mortality studies)   Major sources of mortality information
Limitations of mortality data Incomplete reporting of deaths Lack of accuracy Lack of uniformity-hampers the national and international comparability. Choosing a single cause of death -only underlying cause leaving the risk factors. Changing coding systems and changing fashion in diagnosis- affect the validity Disease with low fatality
Uses of mortality data Employed in explaining trends and differentials in overall mortality Clues for epidemiological research Assessment and monitoring of public health problems and programmes
Crude death rate Specific death rate Case fatality rate Proportion mortality rate Survival rate Adjusted/Standardized rates Mortality rates and ratios
CRUDE DEATH RATE  Is the simplest measure of mortality. The number of  deaths  (from all  causes)  per 1000 estimated mid-year population in one year in a given place . Disadvantage : They lack comparability for with communities in a population that differ by age, sex, race…. Number of deaths during the year Mid-year population X  1000
Components: A specified measurement period. The numerator, the number of deaths that occurred in a specified geographic area during a given period of time, and The denominator, the total number of people in the population at risk in the same geographic area for the same period of time  ("person-years at risk") .  A constant. The result of the fraction is usually multiplied by some factor of 10  (such as 1000) , so that the rate may be expressed as a whole number.
SPECIFIC DEATH RATES May be Cause or disease specific Related to specific groups: age-specific, sex-specific, age and sex specific Helps us to identify particular group(s) ‘ at risk ’ for preventive action.
 
Advantages : Can compare mortality at different ages Can compare mortality in the same age groups over time and/or between countries and areas Can be used to calculate life tables to create an age-independent measure of mortality  (life-expectancy)
CASE FATALITY RATE The proportion of people with a disease who dies from that disease during a time period that usually corresponds to the duration of the disease.  Disadvantages : Limited to acute diseases  (since period between onset to death is long and variable in chronic diseases) CFR for same disease may vary in different epidemics due to altering agent, host, environmental factors Total deaths due to particular cause Total cases due to the same disease X 100
PROPORTIONAL MORTALITY RATE/RATIO Indicates the number of deaths due to particular cause per 100 total deaths. Disadvantages : Does not indicate the risk of members of population dying from that disease. It is of limited value in comparison as it depends on two variables, both of which may alter. Number of deaths from a specific cause in a year Total deaths from all causes in that year X 100
SURVIVAL RATE It is the proportion of survivors in a group studied and followed over a period of time. It is a method of describing the prognosis in certain disease conditions. Total number of patients alive after 5 years Total number of patients treated X 100
ADJUSTED / STANDARDIZED RATES Advantages : Removes the confounding effect of different age structures and yields a single standardized rate, through which mortality rates can be compared directly Methods : Direct standardization Indirect standardization.
THANK YOU

MORTALITY by RAM NAIK

  • 1.
    - RAM NAIK. M 4 th Semester
  • 2.
    The scope ofmeasurement is very broad and unlimited and includes Measurement of mortality. Measurement of morbidity. Measurement of disability. Measurement of natality. Measurement of presence, absence or distribution of the characteristic of disease. Measurement of medical needs, health care facilities, utilization of health services. Measurement of demographic variables.
  • 3.
    Tools of measurementRate Ratio Proportions
  • 4.
    RATE A ratemeasures the occurrence of some particular event in a population during a given period of time. Death rate= It has 3 categories Number of deaths in one year Mid-year population X 1000
  • 5.
    CRUDE RATES: These are the actual observed rates such as death rates and birth rates. These also known as unstandardized rates. SPECIFIC RATES : These are the actual observed rates due to specific cause; or occurring in specific groups or during specific time periods. STANDARDIZED RATES : These are obtained by direct or indirect method of standardization or adjustment
  • 6.
    RATIO It expressesa relation in size between two random quantities. The numerator and denominator may involve an interval of time or may be instantaneous in time Expressed in the form of X:Y or Ex: The ratio ratio of WBC and RBC is 1/600. Sex ratio Doctor-population ratio X Y
  • 7.
    PROPORTION It isa ratio which indicates the relation in magnitude of a part of a whole. The numerator is always included in the denominator. Ex: Number of children with scabies at certain time Total number of children in the village at same time X 100
  • 8.
  • 9.
    Definition:- Mortality isa term which means “death” or describes death and related issues
  • 10.
  • 11.
    National vital registrationsystems (advanced countries) Sample registration systems (China and India) Household surveys (to estimate infant and child mortality) Special longitudinal investigations (maternal mortality studies) Major sources of mortality information
  • 12.
    Limitations of mortalitydata Incomplete reporting of deaths Lack of accuracy Lack of uniformity-hampers the national and international comparability. Choosing a single cause of death -only underlying cause leaving the risk factors. Changing coding systems and changing fashion in diagnosis- affect the validity Disease with low fatality
  • 13.
    Uses of mortalitydata Employed in explaining trends and differentials in overall mortality Clues for epidemiological research Assessment and monitoring of public health problems and programmes
  • 14.
    Crude death rateSpecific death rate Case fatality rate Proportion mortality rate Survival rate Adjusted/Standardized rates Mortality rates and ratios
  • 15.
    CRUDE DEATH RATE Is the simplest measure of mortality. The number of deaths (from all causes) per 1000 estimated mid-year population in one year in a given place . Disadvantage : They lack comparability for with communities in a population that differ by age, sex, race…. Number of deaths during the year Mid-year population X 1000
  • 16.
    Components: A specifiedmeasurement period. The numerator, the number of deaths that occurred in a specified geographic area during a given period of time, and The denominator, the total number of people in the population at risk in the same geographic area for the same period of time ("person-years at risk") . A constant. The result of the fraction is usually multiplied by some factor of 10 (such as 1000) , so that the rate may be expressed as a whole number.
  • 17.
    SPECIFIC DEATH RATESMay be Cause or disease specific Related to specific groups: age-specific, sex-specific, age and sex specific Helps us to identify particular group(s) ‘ at risk ’ for preventive action.
  • 18.
  • 19.
    Advantages : Cancompare mortality at different ages Can compare mortality in the same age groups over time and/or between countries and areas Can be used to calculate life tables to create an age-independent measure of mortality (life-expectancy)
  • 20.
    CASE FATALITY RATEThe proportion of people with a disease who dies from that disease during a time period that usually corresponds to the duration of the disease. Disadvantages : Limited to acute diseases (since period between onset to death is long and variable in chronic diseases) CFR for same disease may vary in different epidemics due to altering agent, host, environmental factors Total deaths due to particular cause Total cases due to the same disease X 100
  • 21.
    PROPORTIONAL MORTALITY RATE/RATIOIndicates the number of deaths due to particular cause per 100 total deaths. Disadvantages : Does not indicate the risk of members of population dying from that disease. It is of limited value in comparison as it depends on two variables, both of which may alter. Number of deaths from a specific cause in a year Total deaths from all causes in that year X 100
  • 22.
    SURVIVAL RATE Itis the proportion of survivors in a group studied and followed over a period of time. It is a method of describing the prognosis in certain disease conditions. Total number of patients alive after 5 years Total number of patients treated X 100
  • 23.
    ADJUSTED / STANDARDIZEDRATES Advantages : Removes the confounding effect of different age structures and yields a single standardized rate, through which mortality rates can be compared directly Methods : Direct standardization Indirect standardization.
  • 24.