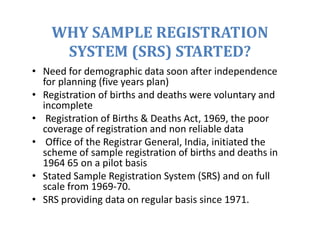
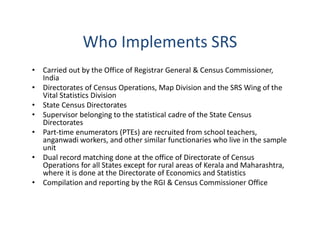
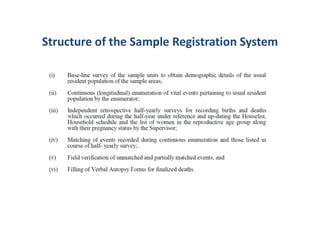
The Sample Registration System (SRS) was initiated in India in 1964-1965 to provide reliable demographic data for planning purposes, as birth and death registration was previously voluntary and incomplete. The SRS provides annual estimates of population composition, fertility, mortality, and medical attention at birth/death for India and major states. It covers about 8.1 million people based on a system of dual recording of births and deaths in representative sample units. Key estimates include population by age/sex, fertility rates, mortality rates, and maternal mortality. The SRS is implemented by the Office of the Registrar General and involves state census offices and part-time enumerators.
Although there is very less material in web ,I try to make the topic lucid . I also stuck in sampling part but i feel it helpful for readers .
Commends are welcome
TERMS OF DEMOGRAPHIC DATA SOURCES
Demography : study of statistical description and analysis of human population.
Population : summation of all the organism of the same group in a particular geographical area.
Population census : a complete population count at a point in time within a particular area.
Vital registration : registration on live Births, Deaths, Fetal deaths, Marriages, and Divorces.
Sample Survey: representative portion of the population .
DEMOGRAPHIC DATA
Demographic data is the study of the population its static and dynamic aspects.
Static aspect (age, sex, race etc.)
Dynamic aspect (fertility, morality, migration)
Hello
I am Maitri Singhai Student of Urban Planning this is my Presentation on the Demographic Indicators,I made in Sem 3 Under The subject Demography and Urbanization
THE POPULATION CENSUS IN INDIA is a main topic in indian demography..this ppt contains basic information regarding indian census...
it was presented & uploaded by:
MANOJKUMAR A
1st m.tech urban & regional planning..
IDS MANASAGANGOTHRI , MYSORE, KARNATAKA
How to conduct national family health survey? What are the changes that had happened till NFHS 5.What are the new parameters added in each 5 year survey till 2019-21 survey of NFHS 5
Our concern is with the sex ratio in infancy and childhood, and we use this in order to examine the magnitude and implications
of gender imbalance. More precisely, our focus in this paper is on the sex ratio (defined as the number of males per 100 females) from birth to 6 years of age—we shall refer to it simply as the child sex ratio (CSR). The narrowness of our focus has two advantages. First, whereas the overall population sex ratio is a complex aggregate that depends on many factors, the natural determinants of the child sex ratio are more limited, allowing us a cleaner analysis. Second, it is this ratio that is liable to be affected by selective abortions, whereas the population sex ratio moves only a little with these new developments.
this presentation will give a basic knowledge about age and sex structure, population pyramid with different countries age-sex structure along with Bangladesh perspective.
GHME 2013 Conference
Session: Measuring child mortality and causes of death
Date: June 18 2013
Presenter: Celia Szwarcwald
Institution:
National School of Public Health
Institute of Scientific and Technologic Information
Oswaldo Cruz Foundation
The prostate is an exocrine gland of the male mammalian reproductive system
It is a walnut-sized gland that forms part of the male reproductive system and is located in front of the rectum and just below the urinary bladder
Function is to store and secrete a clear, slightly alkaline fluid that constitutes 10-30% of the volume of the seminal fluid that along with the spermatozoa, constitutes semen
A healthy human prostate measures (4cm-vertical, by 3cm-horizontal, 2cm ant-post ).
It surrounds the urethra just below the urinary bladder. It has anterior, median, posterior and two lateral lobes
It’s work is regulated by androgens which are responsible for male sex characteristics
Generalised disease of the prostate due to hormonal derangement which leads to non malignant enlargement of the gland (increase in the number of epithelial cells and stromal tissue)to cause compression of the urethra leading to symptoms (LUTS
Anti ulcer drugs and their Advance pharmacology ||
Anti-ulcer drugs are medications used to prevent and treat ulcers in the stomach and upper part of the small intestine (duodenal ulcers). These ulcers are often caused by an imbalance between stomach acid and the mucosal lining, which protects the stomach lining.
||Scope: Overview of various classes of anti-ulcer drugs, their mechanisms of action, indications, side effects, and clinical considerations.
Title: Sense of Taste
Presenter: Dr. Faiza, Assistant Professor of Physiology
Qualifications:
MBBS (Best Graduate, AIMC Lahore)
FCPS Physiology
ICMT, CHPE, DHPE (STMU)
MPH (GC University, Faisalabad)
MBA (Virtual University of Pakistan)
Learning Objectives:
Describe the structure and function of taste buds.
Describe the relationship between the taste threshold and taste index of common substances.
Explain the chemical basis and signal transduction of taste perception for each type of primary taste sensation.
Recognize different abnormalities of taste perception and their causes.
Key Topics:
Significance of Taste Sensation:
Differentiation between pleasant and harmful food
Influence on behavior
Selection of food based on metabolic needs
Receptors of Taste:
Taste buds on the tongue
Influence of sense of smell, texture of food, and pain stimulation (e.g., by pepper)
Primary and Secondary Taste Sensations:
Primary taste sensations: Sweet, Sour, Salty, Bitter, Umami
Chemical basis and signal transduction mechanisms for each taste
Taste Threshold and Index:
Taste threshold values for Sweet (sucrose), Salty (NaCl), Sour (HCl), and Bitter (Quinine)
Taste index relationship: Inversely proportional to taste threshold
Taste Blindness:
Inability to taste certain substances, particularly thiourea compounds
Example: Phenylthiocarbamide
Structure and Function of Taste Buds:
Composition: Epithelial cells, Sustentacular/Supporting cells, Taste cells, Basal cells
Features: Taste pores, Taste hairs/microvilli, and Taste nerve fibers
Location of Taste Buds:
Found in papillae of the tongue (Fungiform, Circumvallate, Foliate)
Also present on the palate, tonsillar pillars, epiglottis, and proximal esophagus
Mechanism of Taste Stimulation:
Interaction of taste substances with receptors on microvilli
Signal transduction pathways for Umami, Sweet, Bitter, Sour, and Salty tastes
Taste Sensitivity and Adaptation:
Decrease in sensitivity with age
Rapid adaptation of taste sensation
Role of Saliva in Taste:
Dissolution of tastants to reach receptors
Washing away the stimulus
Taste Preferences and Aversions:
Mechanisms behind taste preference and aversion
Influence of receptors and neural pathways
Impact of Sensory Nerve Damage:
Degeneration of taste buds if the sensory nerve fiber is cut
Abnormalities of Taste Detection:
Conditions: Ageusia, Hypogeusia, Dysgeusia (parageusia)
Causes: Nerve damage, neurological disorders, infections, poor oral hygiene, adverse drug effects, deficiencies, aging, tobacco use, altered neurotransmitter levels
Neurotransmitters and Taste Threshold:
Effects of serotonin (5-HT) and norepinephrine (NE) on taste sensitivity
Supertasters:
25% of the population with heightened sensitivity to taste, especially bitterness
Increased number of fungiform papillae
micro teaching on communication m.sc nursing.pdfAnurag Sharma
Microteaching is a unique model of practice teaching. It is a viable instrument for the. desired change in the teaching behavior or the behavior potential which, in specified types of real. classroom situations, tends to facilitate the achievement of specified types of objectives.
Flu Vaccine Alert in Bangalore Karnatakaaddon Scans
As flu season approaches, health officials in Bangalore, Karnataka, are urging residents to get their flu vaccinations. The seasonal flu, while common, can lead to severe health complications, particularly for vulnerable populations such as young children, the elderly, and those with underlying health conditions.
Dr. Vidisha Kumari, a leading epidemiologist in Bangalore, emphasizes the importance of getting vaccinated. "The flu vaccine is our best defense against the influenza virus. It not only protects individuals but also helps prevent the spread of the virus in our communities," he says.
This year, the flu season is expected to coincide with a potential increase in other respiratory illnesses. The Karnataka Health Department has launched an awareness campaign highlighting the significance of flu vaccinations. They have set up multiple vaccination centers across Bangalore, making it convenient for residents to receive their shots.
To encourage widespread vaccination, the government is also collaborating with local schools, workplaces, and community centers to facilitate vaccination drives. Special attention is being given to ensuring that the vaccine is accessible to all, including marginalized communities who may have limited access to healthcare.
Residents are reminded that the flu vaccine is safe and effective. Common side effects are mild and may include soreness at the injection site, mild fever, or muscle aches. These side effects are generally short-lived and far less severe than the flu itself.
Healthcare providers are also stressing the importance of continuing COVID-19 precautions. Wearing masks, practicing good hand hygiene, and maintaining social distancing are still crucial, especially in crowded places.
Protect yourself and your loved ones by getting vaccinated. Together, we can help keep Bangalore healthy and safe this flu season. For more information on vaccination centers and schedules, residents can visit the Karnataka Health Department’s official website or follow their social media pages.
Stay informed, stay safe, and get your flu shot today!
Pulmonary Thromboembolism - etilogy, types, medical- Surgical and nursing man...VarunMahajani
Disruption of blood supply to lung alveoli due to blockage of one or more pulmonary blood vessels is called as Pulmonary thromboembolism. In this presentation we will discuss its causes, types and its management in depth.
HOT NEW PRODUCT! BIG SALES FAST SHIPPING NOW FROM CHINA!! EU KU DB BK substit...GL Anaacs
Contact us if you are interested:
Email / Skype : kefaya1771@gmail.com
Threema: PXHY5PDH
New BATCH Ku !!! MUCH IN DEMAND FAST SALE EVERY BATCH HAPPY GOOD EFFECT BIG BATCH !
Contact me on Threema or skype to start big business!!
Hot-sale products:
NEW HOT EUTYLONE WHITE CRYSTAL!!
5cl-adba precursor (semi finished )
5cl-adba raw materials
ADBB precursor (semi finished )
ADBB raw materials
APVP powder
5fadb/4f-adb
Jwh018 / Jwh210
Eutylone crystal
Protonitazene (hydrochloride) CAS: 119276-01-6
Flubrotizolam CAS: 57801-95-3
Metonitazene CAS: 14680-51-4
Payment terms: Western Union,MoneyGram,Bitcoin or USDT.
Deliver Time: Usually 7-15days
Shipping method: FedEx, TNT, DHL,UPS etc.Our deliveries are 100% safe, fast, reliable and discreet.
Samples will be sent for your evaluation!If you are interested in, please contact me, let's talk details.
We specializes in exporting high quality Research chemical, medical intermediate, Pharmaceutical chemicals and so on. Products are exported to USA, Canada, France, Korea, Japan,Russia, Southeast Asia and other countries.
Couples presenting to the infertility clinic- Do they really have infertility...Sujoy Dasgupta
Dr Sujoy Dasgupta presented the study on "Couples presenting to the infertility clinic- Do they really have infertility? – The unexplored stories of non-consummation" in the 13th Congress of the Asia Pacific Initiative on Reproduction (ASPIRE 2024) at Manila on 24 May, 2024.
Couples presenting to the infertility clinic- Do they really have infertility...
India sample registration system
1. Sample Registration System
Dr T R Dilip,
International Institute for Population Sciences
Course C1: Introduction to Demography and History of Population
MBD/MA/MSc/MPS
30th Sept 2021
2. WHY SAMPLE REGISTRATION
SYSTEM (SRS) STARTED?
• Need for demographic data soon after independence
for planning (five years plan)
• Registration of births and deaths were voluntary and
incomplete
• Registration of Births & Deaths Act, 1969, the poor
coverage of registration and non reliable data
• Office of the Registrar General, India, initiated the
scheme of sample registration of births and deaths in
1964 65 on a pilot basis
• Stated Sample Registration System (SRS) and on full
scale from 1969-70.
• SRS providing data on regular basis since 1971.
3. Who Implements SRS
• Carried out by the Office of Registrar General & Census Commissioner,
India
• Directorates of Census Operations, Map Division and the SRS Wing of the
Vital Statistics Division
• State Census Directorates
• Supervisor belonging to the statistical cadre of the State Census
Directorates
• Part-time enumerators (PTEs) are recruited from school teachers,
anganwadi workers, and other similar functionaries who live in the sample
unit
• Dual record matching done at the office of Directorate of Census
Operations for all States except for rural areas of Kerala and Maharashtra,
where it is done at the Directorate of Economics and Statistics
• Compilation and reporting by the RGI & Census Commissioner Office
4. SAMPLE REGISTRATION SYSTEM
IN INDIA: OVERVIEW
• SRS is the most regular source of demographic statistics in India
• SRS is one of the largest demographic surveys in the world covering
about 8.1 million population
• The SRS sample is revised every ten years based on the latest
census frame
• based on a system of dual recording of births and deaths in fairly
representative sample units spread all over the country
• SRS provides annual estimates of (a) population composition, (b)
fertility, (c) mortality, and (d) medical attention at the time of birth
or death which give some idea about access to medical care.
• Estimates available for India and bigger States/UTs (with population
>10 million) separately for rural and urban areas
5. WHAT ESTIMATES DOES SRS
PROVIDE?
• Population Composition: (age group & marital
status- M/F & R/U)
• Fertility Indicators: (CBR, Sex Ratio at Birth, ASFR,
GFR, TFR, GRR, Marital Fertility, Birth Order, Birth
Interval & medical attention at birth)
• Mortality Indicators: CDR, ASDR, IMR, NNMR,
U5MR, Perinatal mortality, Still Birth Rate, &
Medical Attention at Death.
• Maternal Mortality,
• Life Tables
6. SRS sampling frame
• The main objective of SRS is to provide reliable estimates of birth
rate, death rate and infant mortality rate at the natural division
level(NSS Based) for major States and at the State level for smaller
States.
• Based on Census: frame consists of villages or village segments in
rural areas and census enumeration blocks in urban areas
• earlier sample was based on the reliability of birth rate at the State
level
• The 2004 and 2014 sample is estimated using IMR with an
acceptable margin of error, along with financial and operational
constraints
10. KEY SRS Publications
Now Available : https://censusindia.gov.in/2011-Common/Sample_Registration_System.html
SRS Bulletins
SRS Statistical Report
Special Bulletin on Maternal Mortality in India
SRS Based Life Table
Compendium of India's Fertility and Mortality Indicators ,1971 –
2013
Causes of Death Statistics
12. Evaluations of SRS in India
Dates Study Design Findings Ref.
1970-
1975
Indirect estimate
(Brass 1975)
6% under reporting of adult deaths RGI, 1982
1971-
1976
Indirect est. (Brass
1975; Preston & Coale
1980)
10% under reporting of deaths.
Insignificant interstate variations.
Excluded Bihar & West bengal for poor
data quality.
Bhat et al.
1984
1978 Indirect est. (P/F ratios,
UN 1983, Ch-II)
6% under reporting of births. State
underestimates in 1978 ranged from
<1% (Guj) to >17% (KA)
RGI 1984,
Swamy et al.
1992
1980-
1981
Intensive inquiry of
10% subsample
3% under estimation of birth and death
rates. State underestimates around 1%
(Guj, Har, MP) to 11% (KA)
Grover 1988;
Swamy et al.
1992.
1985-
1986
Intensive inquiry of
10% subsample
State underestimates, <1% (AP, BI, Guj,
KE, MP,, MH, OR, TN) to >3% (AS, WB)
Swamy et al.
1992.
… … … …
1978-
1992
Comparison of SRS
with NFHS fertility est.
At least 10% under registration of births. Narasimhan
et al. 1997
12
14. Overall Accuracy of SRS Data
Coverage: Covers about 0.6% of India’s population. However, its
representative character allows for estimation of vital
statistics for the country and major states.
Completeness: Around 90% registration of events upto 1980s.
Interstate differences narrowed down by mid 1980s.
Completeness appears to have worsened during the
1990s and after. Interstate differences in
completeness appears to have widened also.
Missing data: Generally believed to be low, but no information
about missing data. Annual report should include a
table showing the number of births and deaths for
which age or sex information was not available and
how those events were treated through the
tabulation process. Also a table regarding timeliness
of monthly returns from the state level offices.
14
15. Timeliness of SRS Annual Reports
Production
Time:
Median production time: 2 ½ Years
1970s: 6 ½ Years
1980s: 2½ Years
1990s: 2 Years
2000-07: 1 Year 10 Months
Regularity: SD of Production Time: 32 Months
Lumping of annual reports in a publication year:
Publication Year 2000: 1997, 1998
Publication Year 2004: 2001, 2002
Publication Year 2006:
Latest available is 2018 data
2004, 2005
2020
15
16. Accessibility of SRS Publications & Data
Data Annual reports in print form only. Half yearly bulletins in
print; and pdf files through internet since April 1999,
electronic data better
Metadata: More elaborated can be made available. Annual report
gives details of sampling, system of data collection and
definition of terms.
But population figures in statement A or 1 are not
available by sex.
From 1993, the population figures are rounded to
nearest 000, reducing scope for consistency checks and
indirect estimation of accuracy of SRS statistics.
User Service: Sale counter at RGI’s head office delivers reports across
the counter and responds to requests over post.
Regional sale counters in state capital do not usually
stock all publications.
RGI library in Delhi does not have a reference set of all
SRS publications. 16
17. Sources of vital statistics in India and their usability.
17
Source &
Periodicity
Estimated
Parameters
Small area estimates Usability
SRS
Annual,
Since
1970
Fertility & Mortality
Indicators
State level est. for big
states, recently, intra state
regions .
Representative sample,
Regular reports, Reliable.
Census 10 Years
Pop. count by age
sex, area, IMR &
Child Mortality
Population count down to
village level, Mortality:
District level.
Reliable & valid pop. Data in
ab. 2 years. Ab 5-6 yr lag for
indirect est. of Fert. & Mort.
CRS
Annual,
1958
Fertility & Mortality
Indicators
District level and large cities
with 10000 pop.
Poor coverage till 2000,
Improved but not evaluated
Comparability over time due
to varying coverage, , Wide
interstate variation. Av time to
publication 45 months until
1994, Bur now < 2years
NFHS
Not well
defined
I:92-93,
II:98-99,
III:05-06,
IV:15-16,
V. 19-20
Fertility & IMR
(Indirect Estimates)
State level estimates.
Indirect estimates. Quick est
available within a year. Small
sample size.
18. Resources
• Mahapatra P. The Sample Registration System (SRS) in India, An Overview, as of 2017
https://www.researchgate.net/profile/Prasanta-
Mahapatra/publication/326098440_The_Sample_Registration_System_SRS_in_India_An_Overview
_as_of_2017/links/5b38dd820f7e9b0df5e21fd3/The-Sample-Registration-System-SRS-in-India-An-
Overview-as-of-2017.pdf
• Office of the Registrar General & Census Commissioner, SAMPLE REGISTRATION SYSTEM
STATISTICAL REPORT 2018 https://censusindia.gov.in/2011-
Common/CRS_2019/CRS2019_report.pdf
• RGI: Sample Registration System
https://censusindia.gov.in/Vital_Statistics/SRS/Sample_Registration_System.html
• RGI: SPECIAL BULLETIN ON MATERNAL MORTALITY IN INDIA 2016-18
http://censusindia.gov.in/vital_statistics/SRS_Bulletins/MMR%20Bulletin%202016-18.pdf
• RGI: SRS Bulletins:
https://censusindia.gov.in/vital_statistics/SRS_Bulletins/SRS%20Bulletin_2018.pdf
• RGI: Compendium of India's Fertility and Mortality Indicators ,1971 – 2013
https://censusindia.gov.in/vital_statistics/Compendium/Srs_data.html
• RGI, SRS Based Abridged Life Tables (2014-18):
http://censusindia.gov.in/Vital_Statistics/SRS_Life_Table/SRS%20based%20Abridged%20Life%20
Tables%202014-18.pdf
• Yadav, A.K. and Ram, F., 2015. Assessment of completeness of birth registrations (5+) by sample
registration system (SRS) of India and major states. Demography India, 44(1&2), pp.111-8.