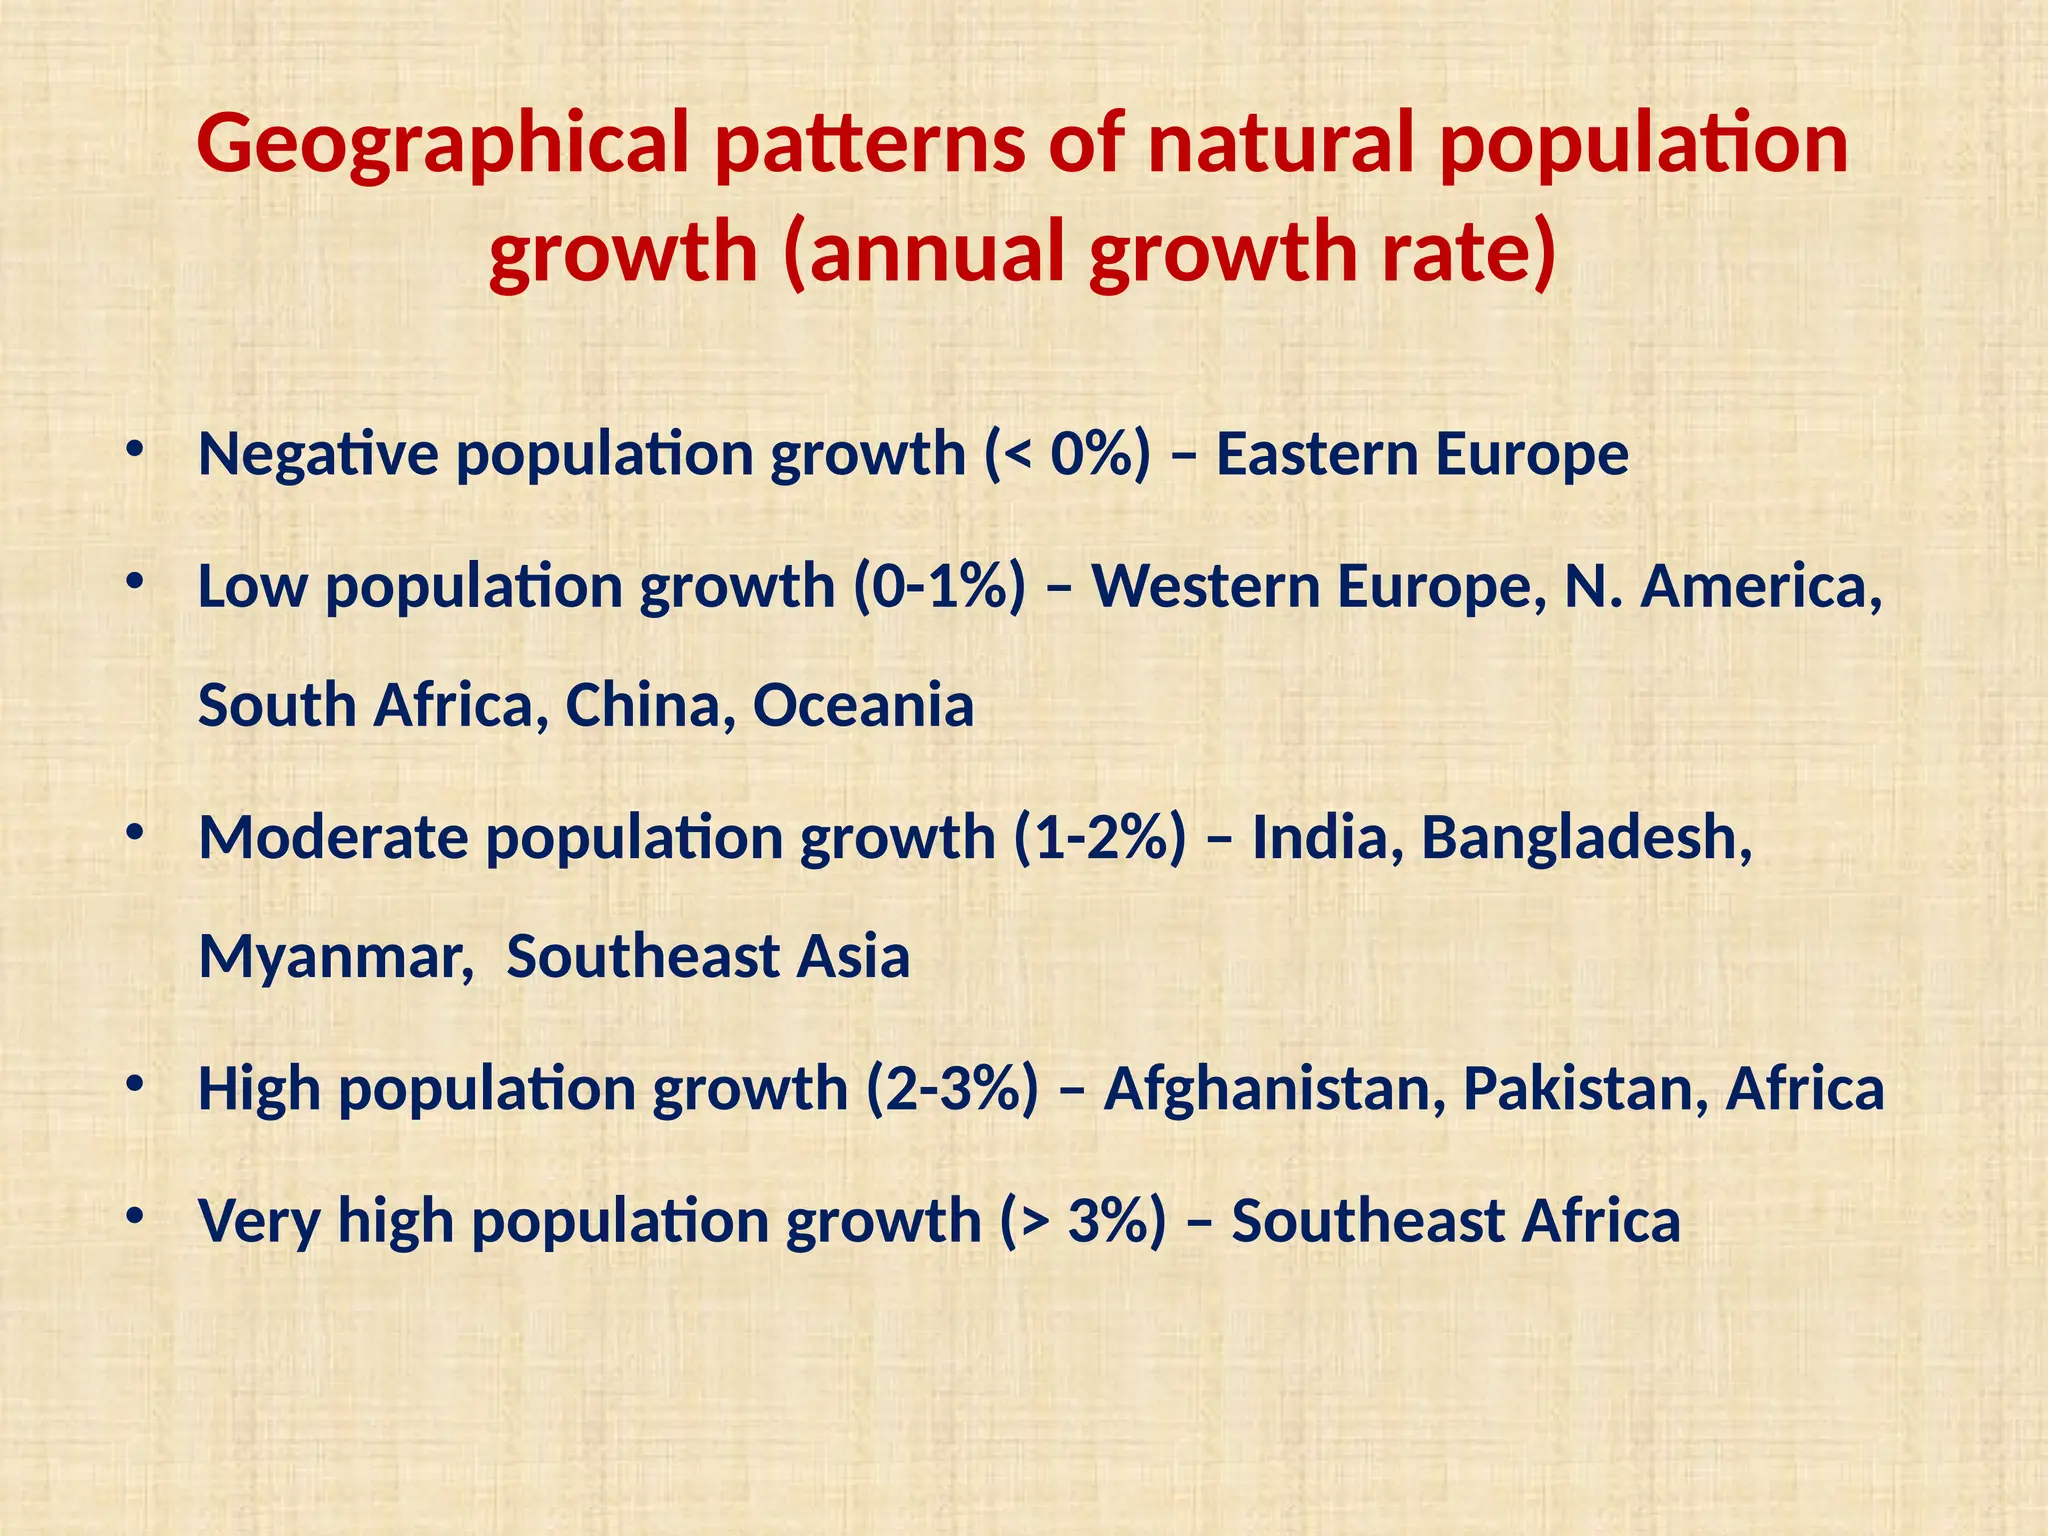
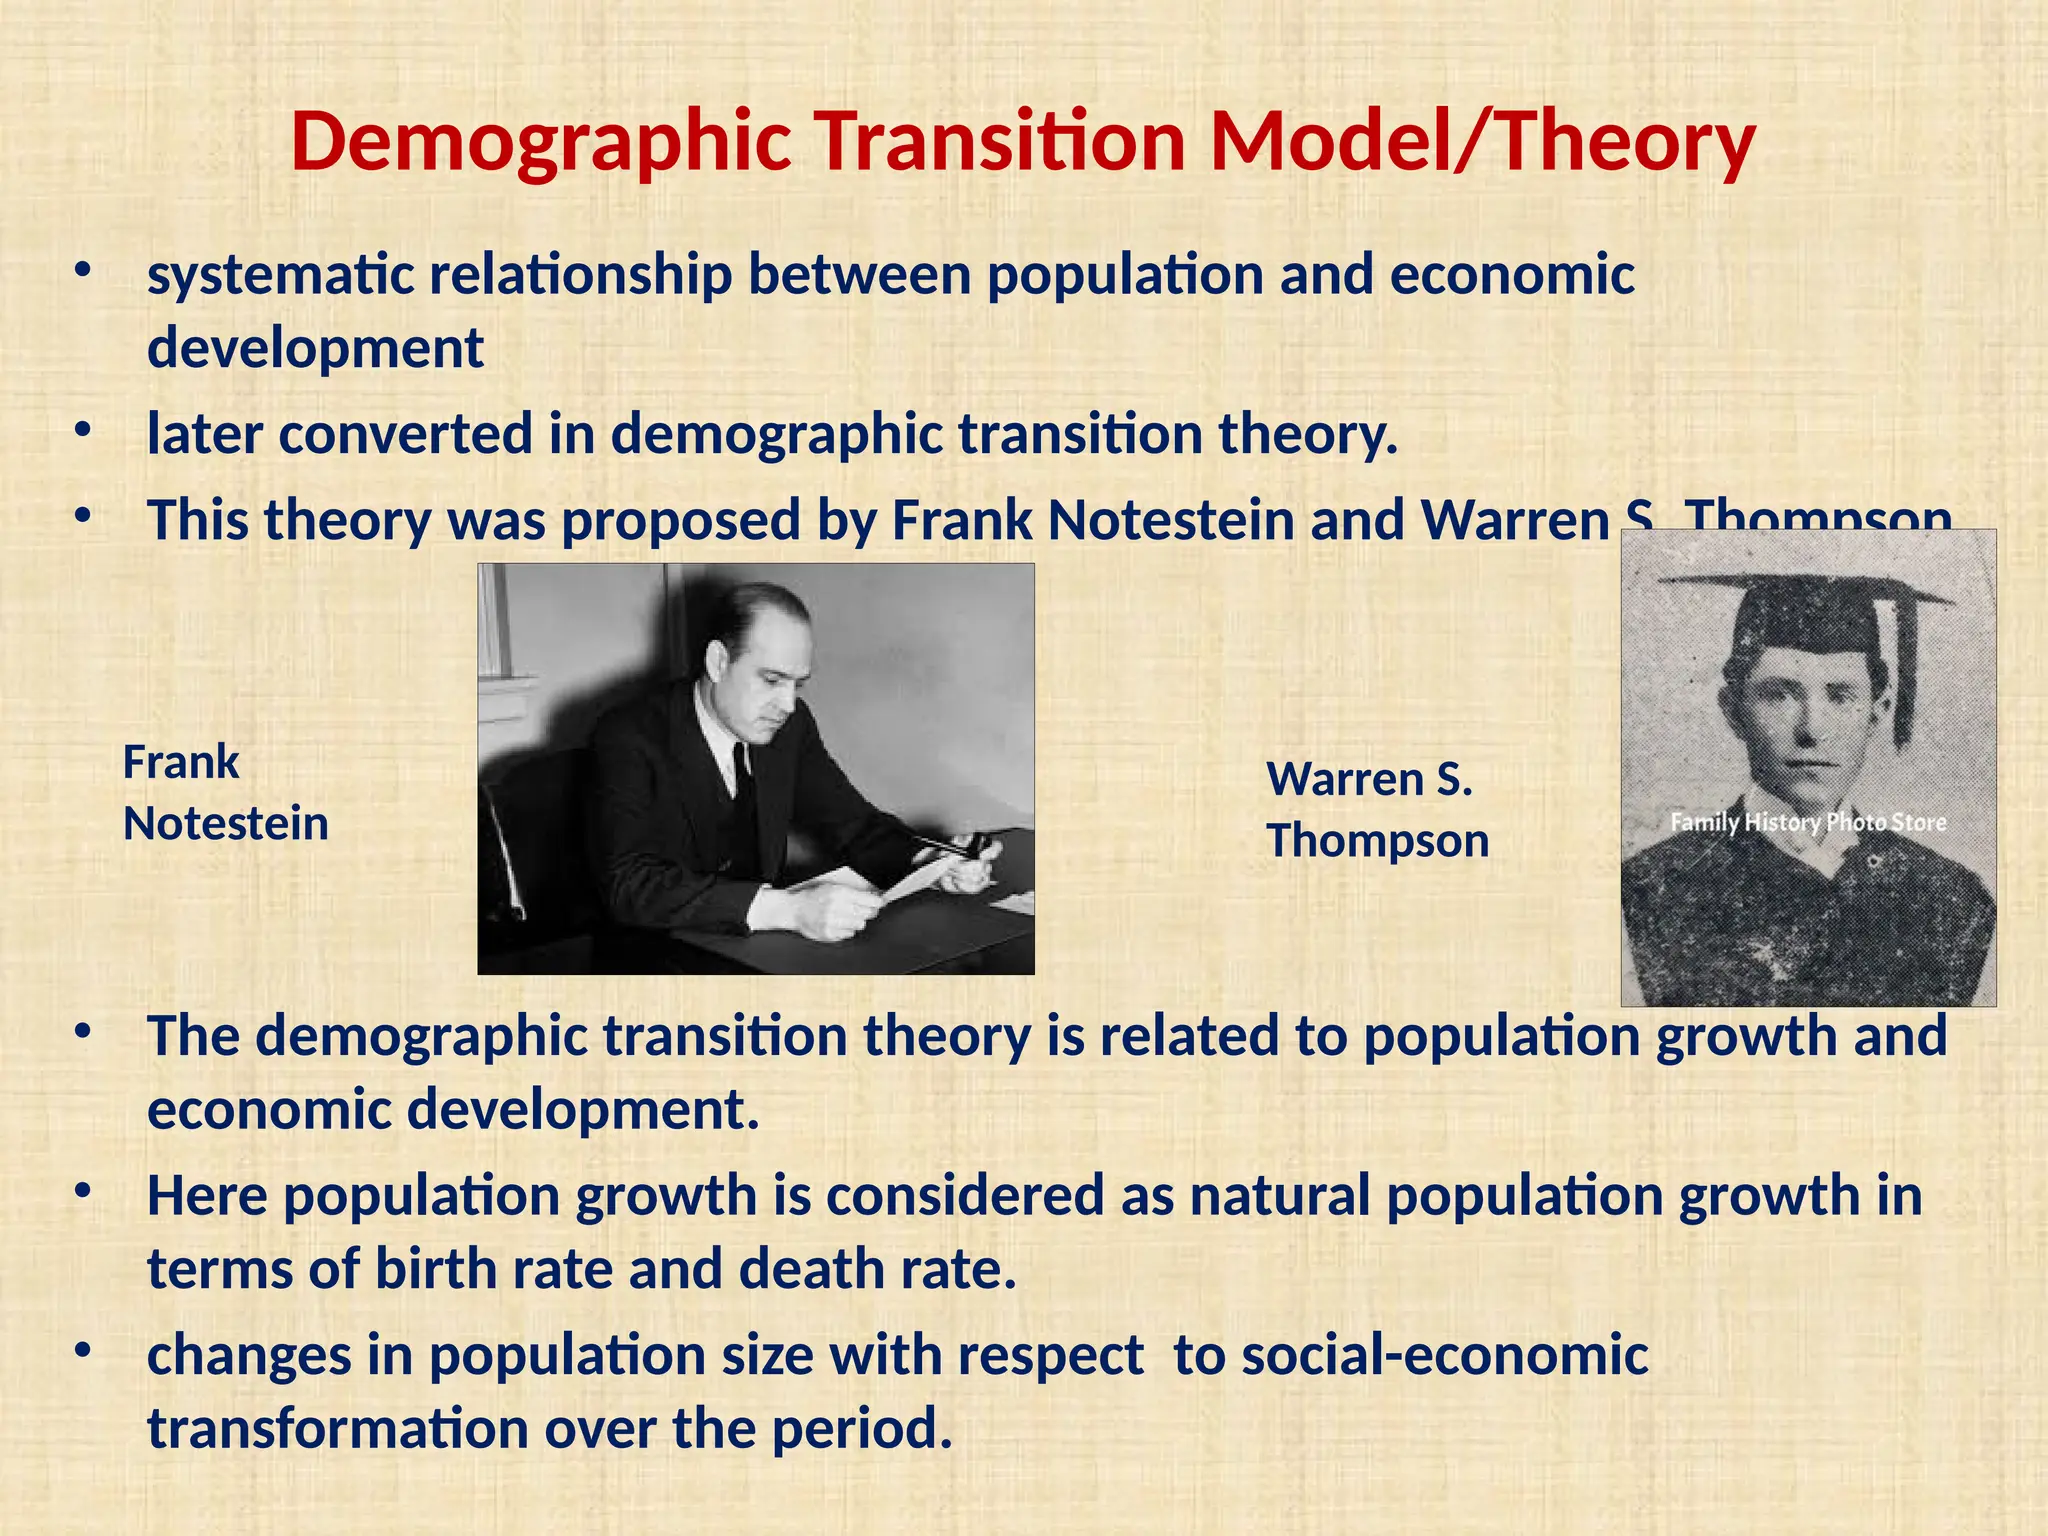
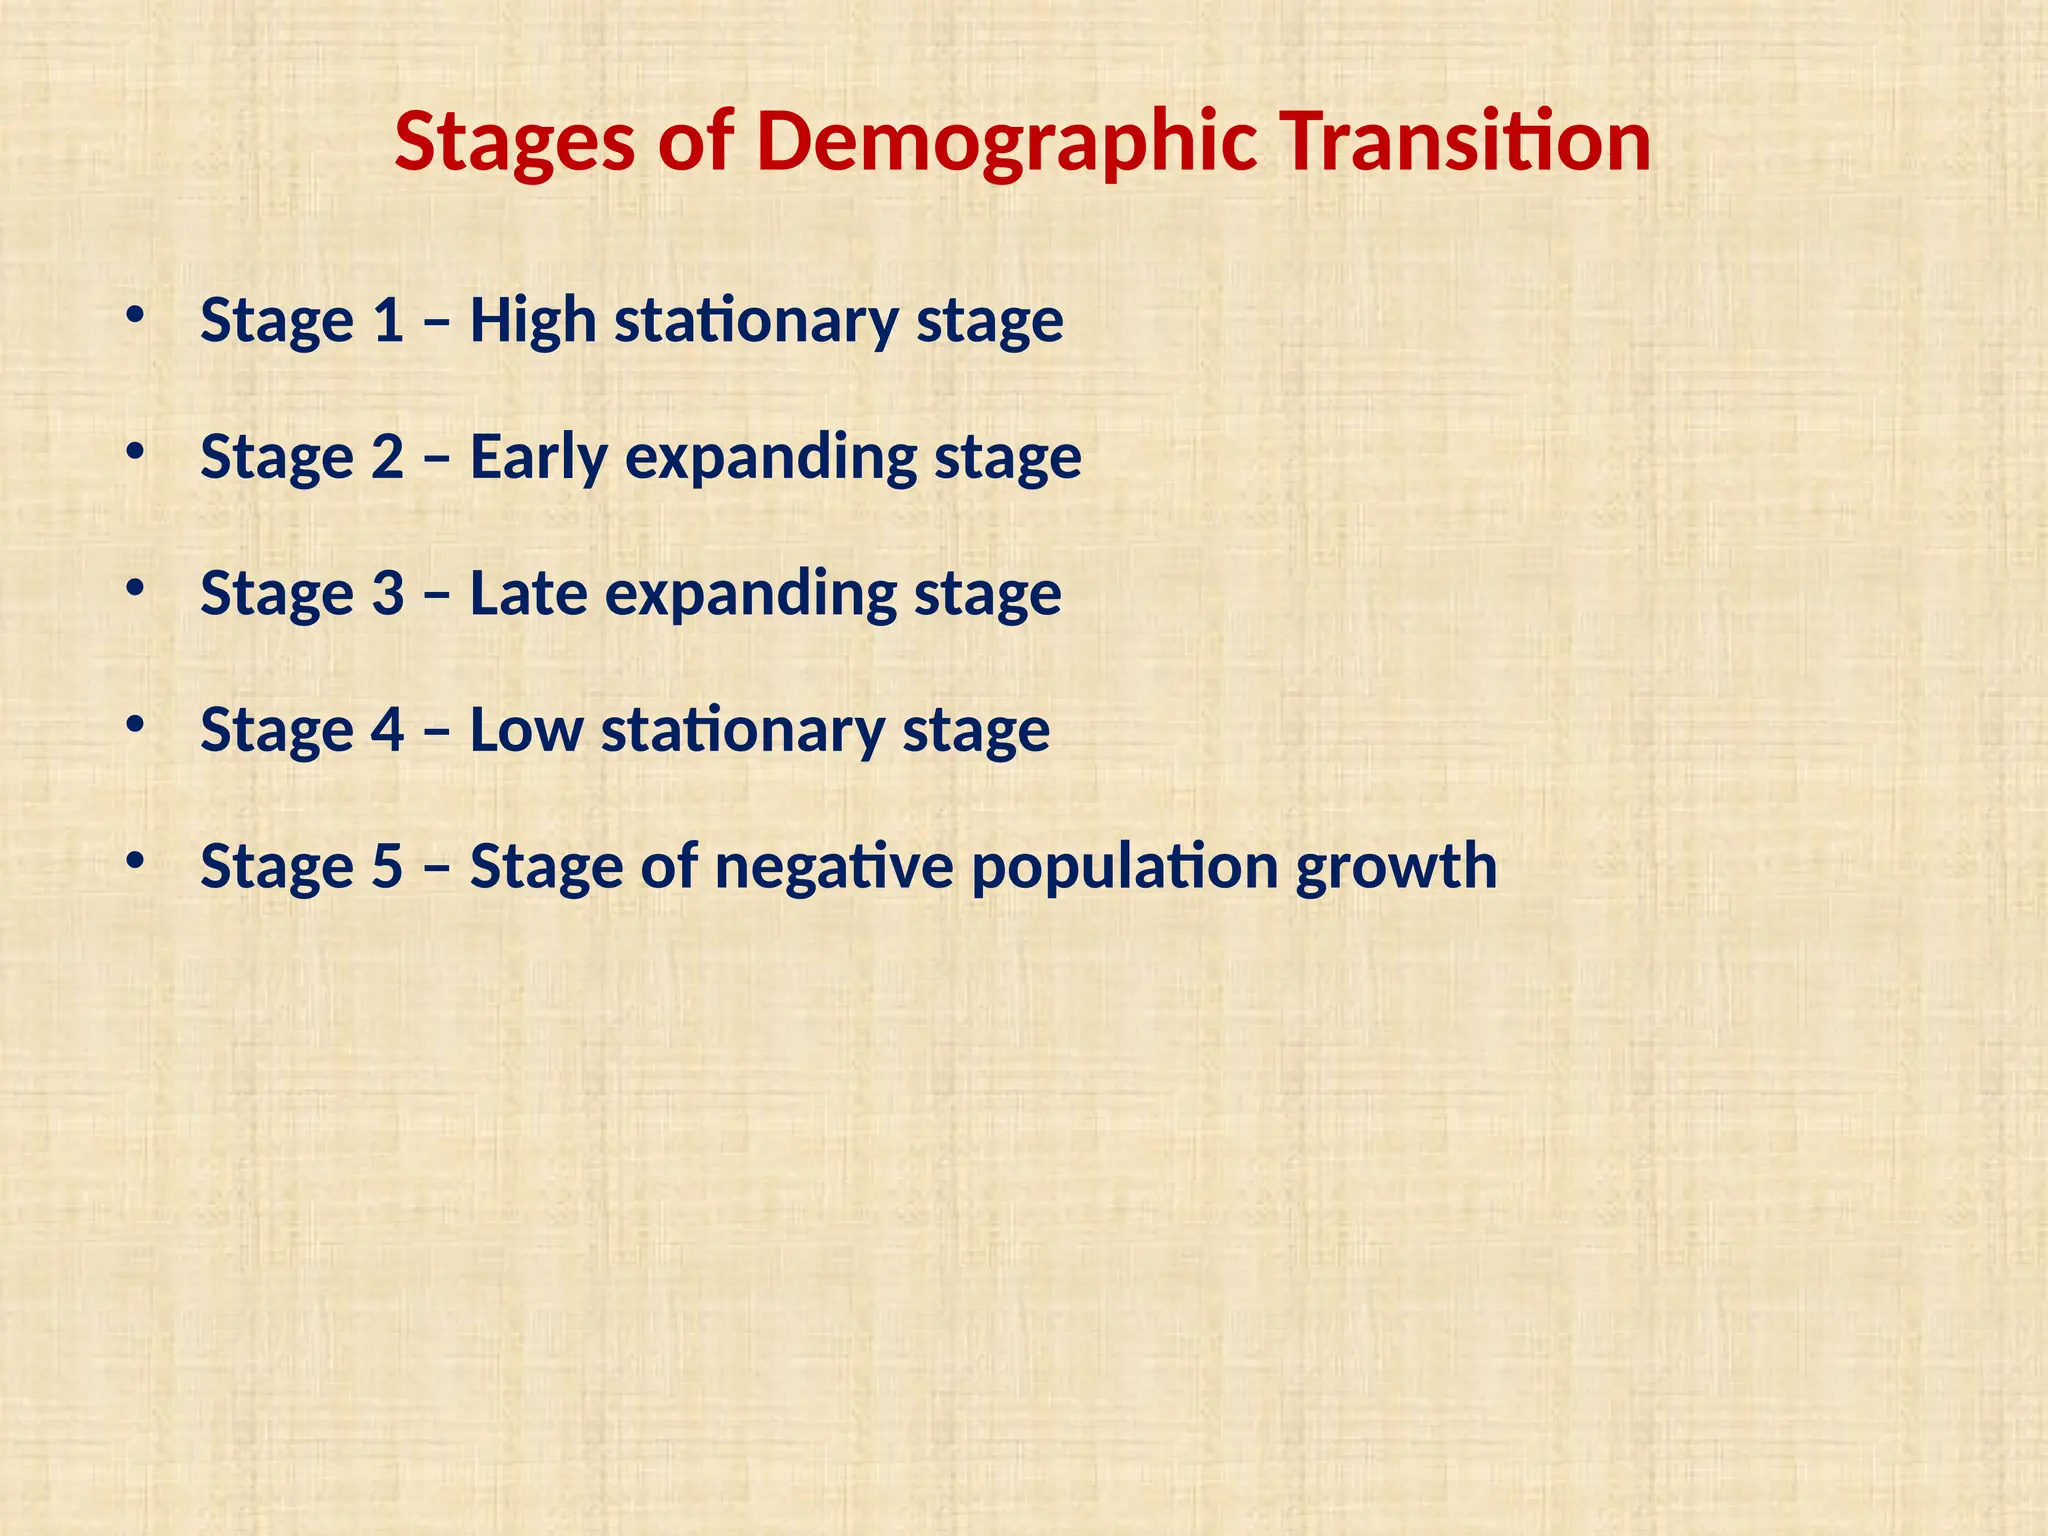
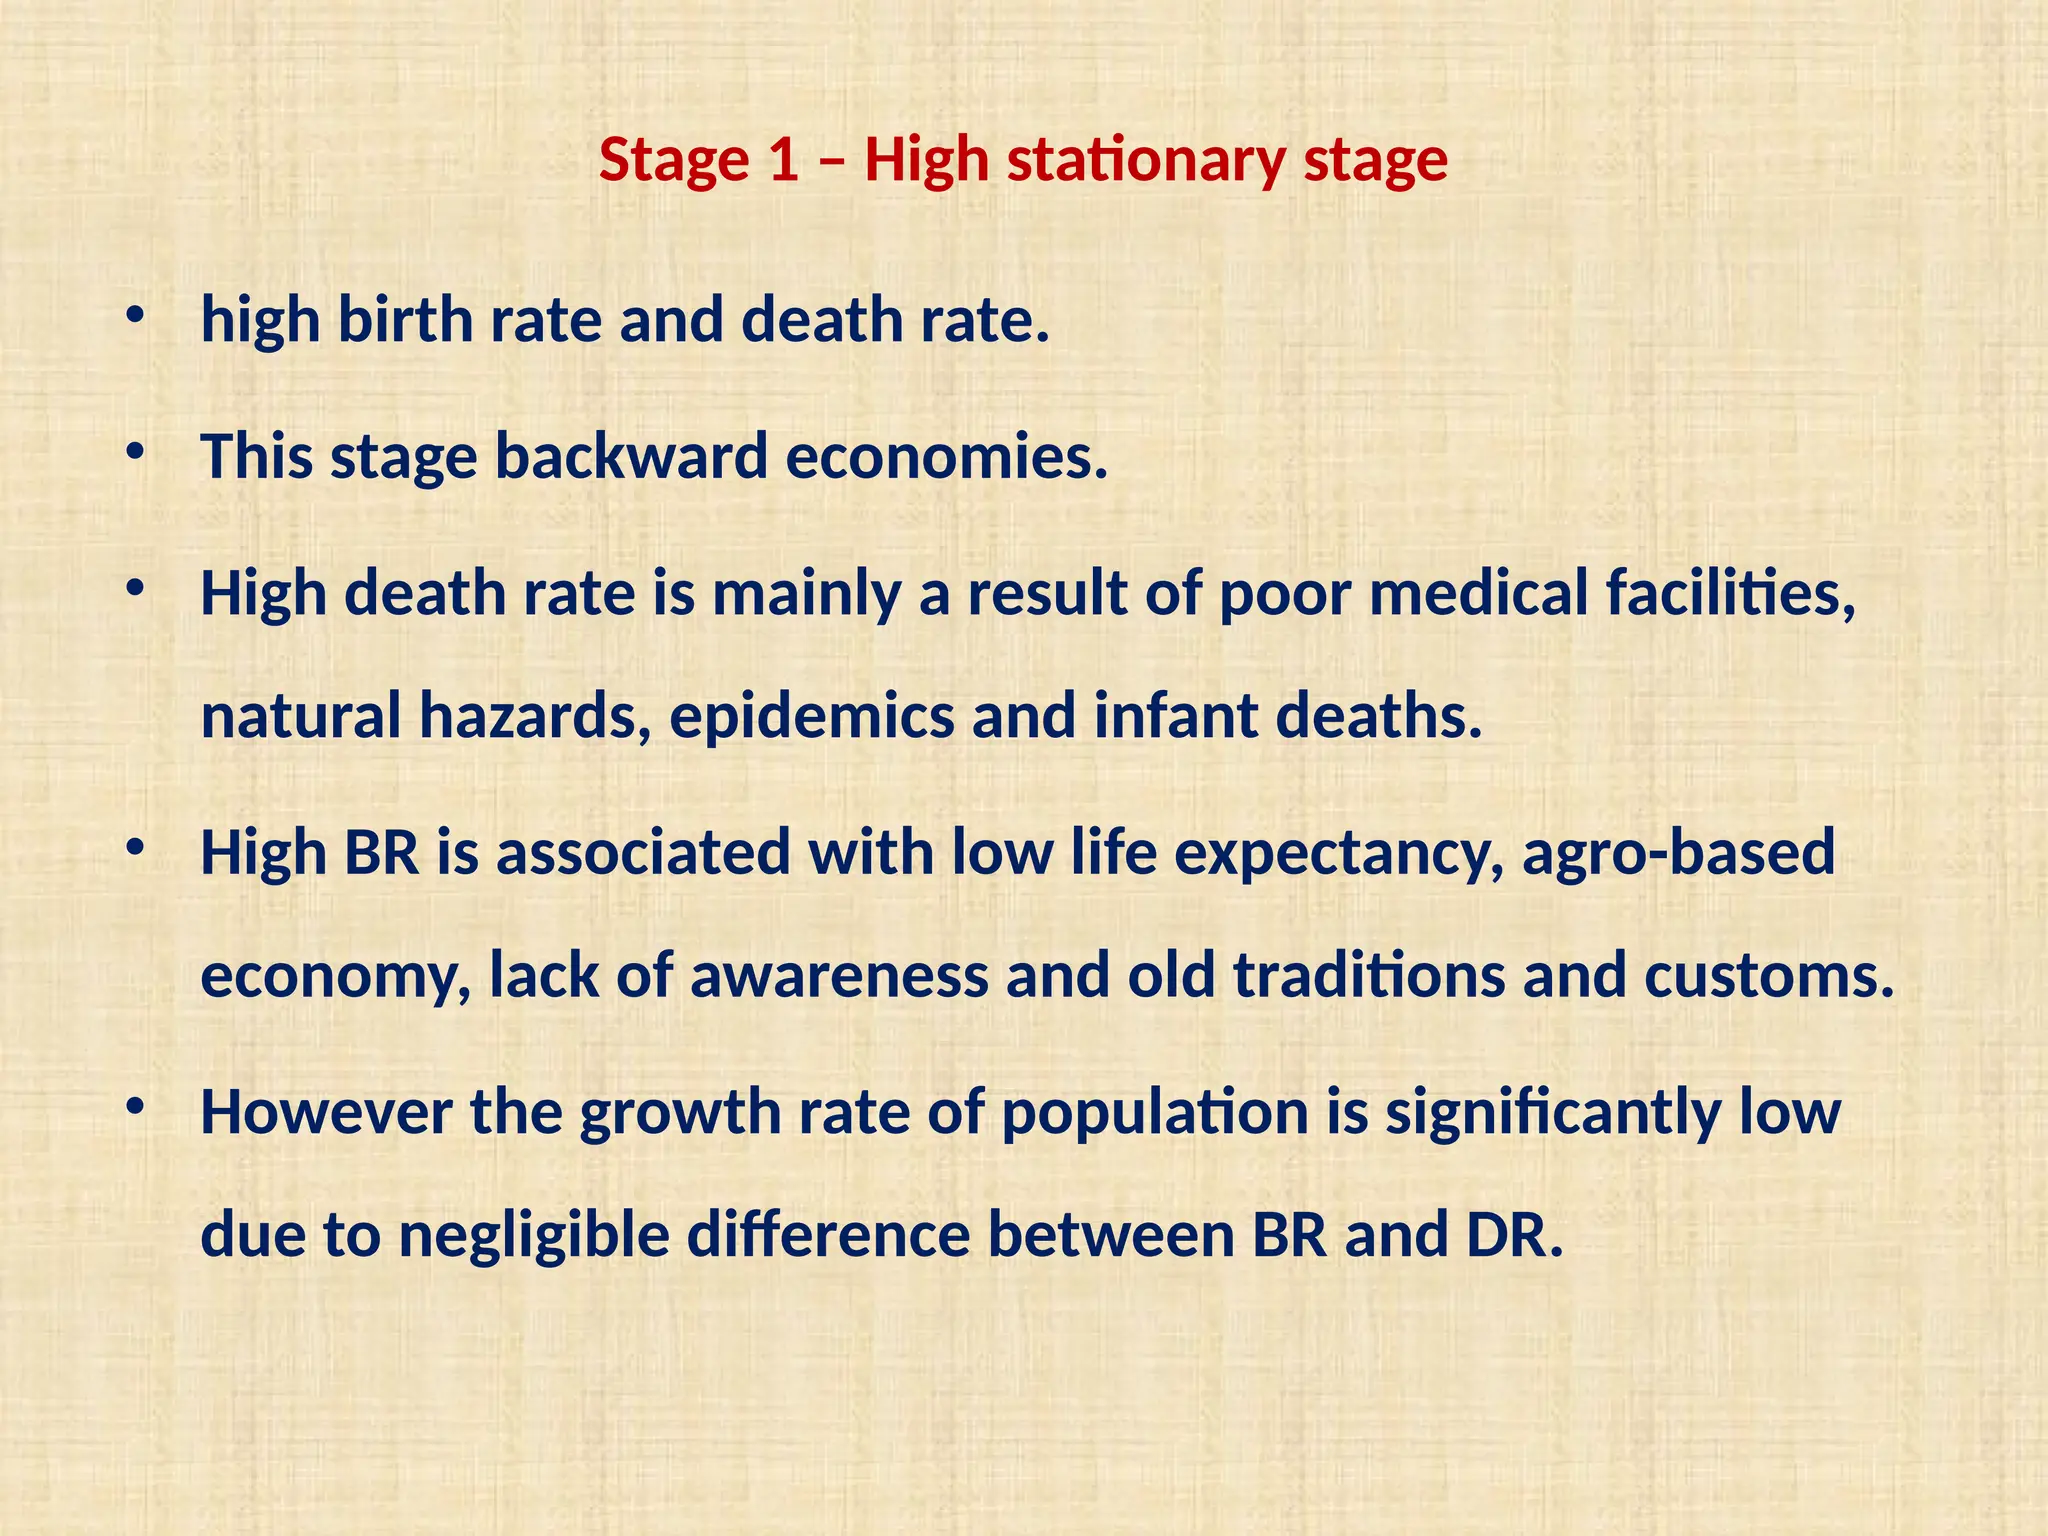
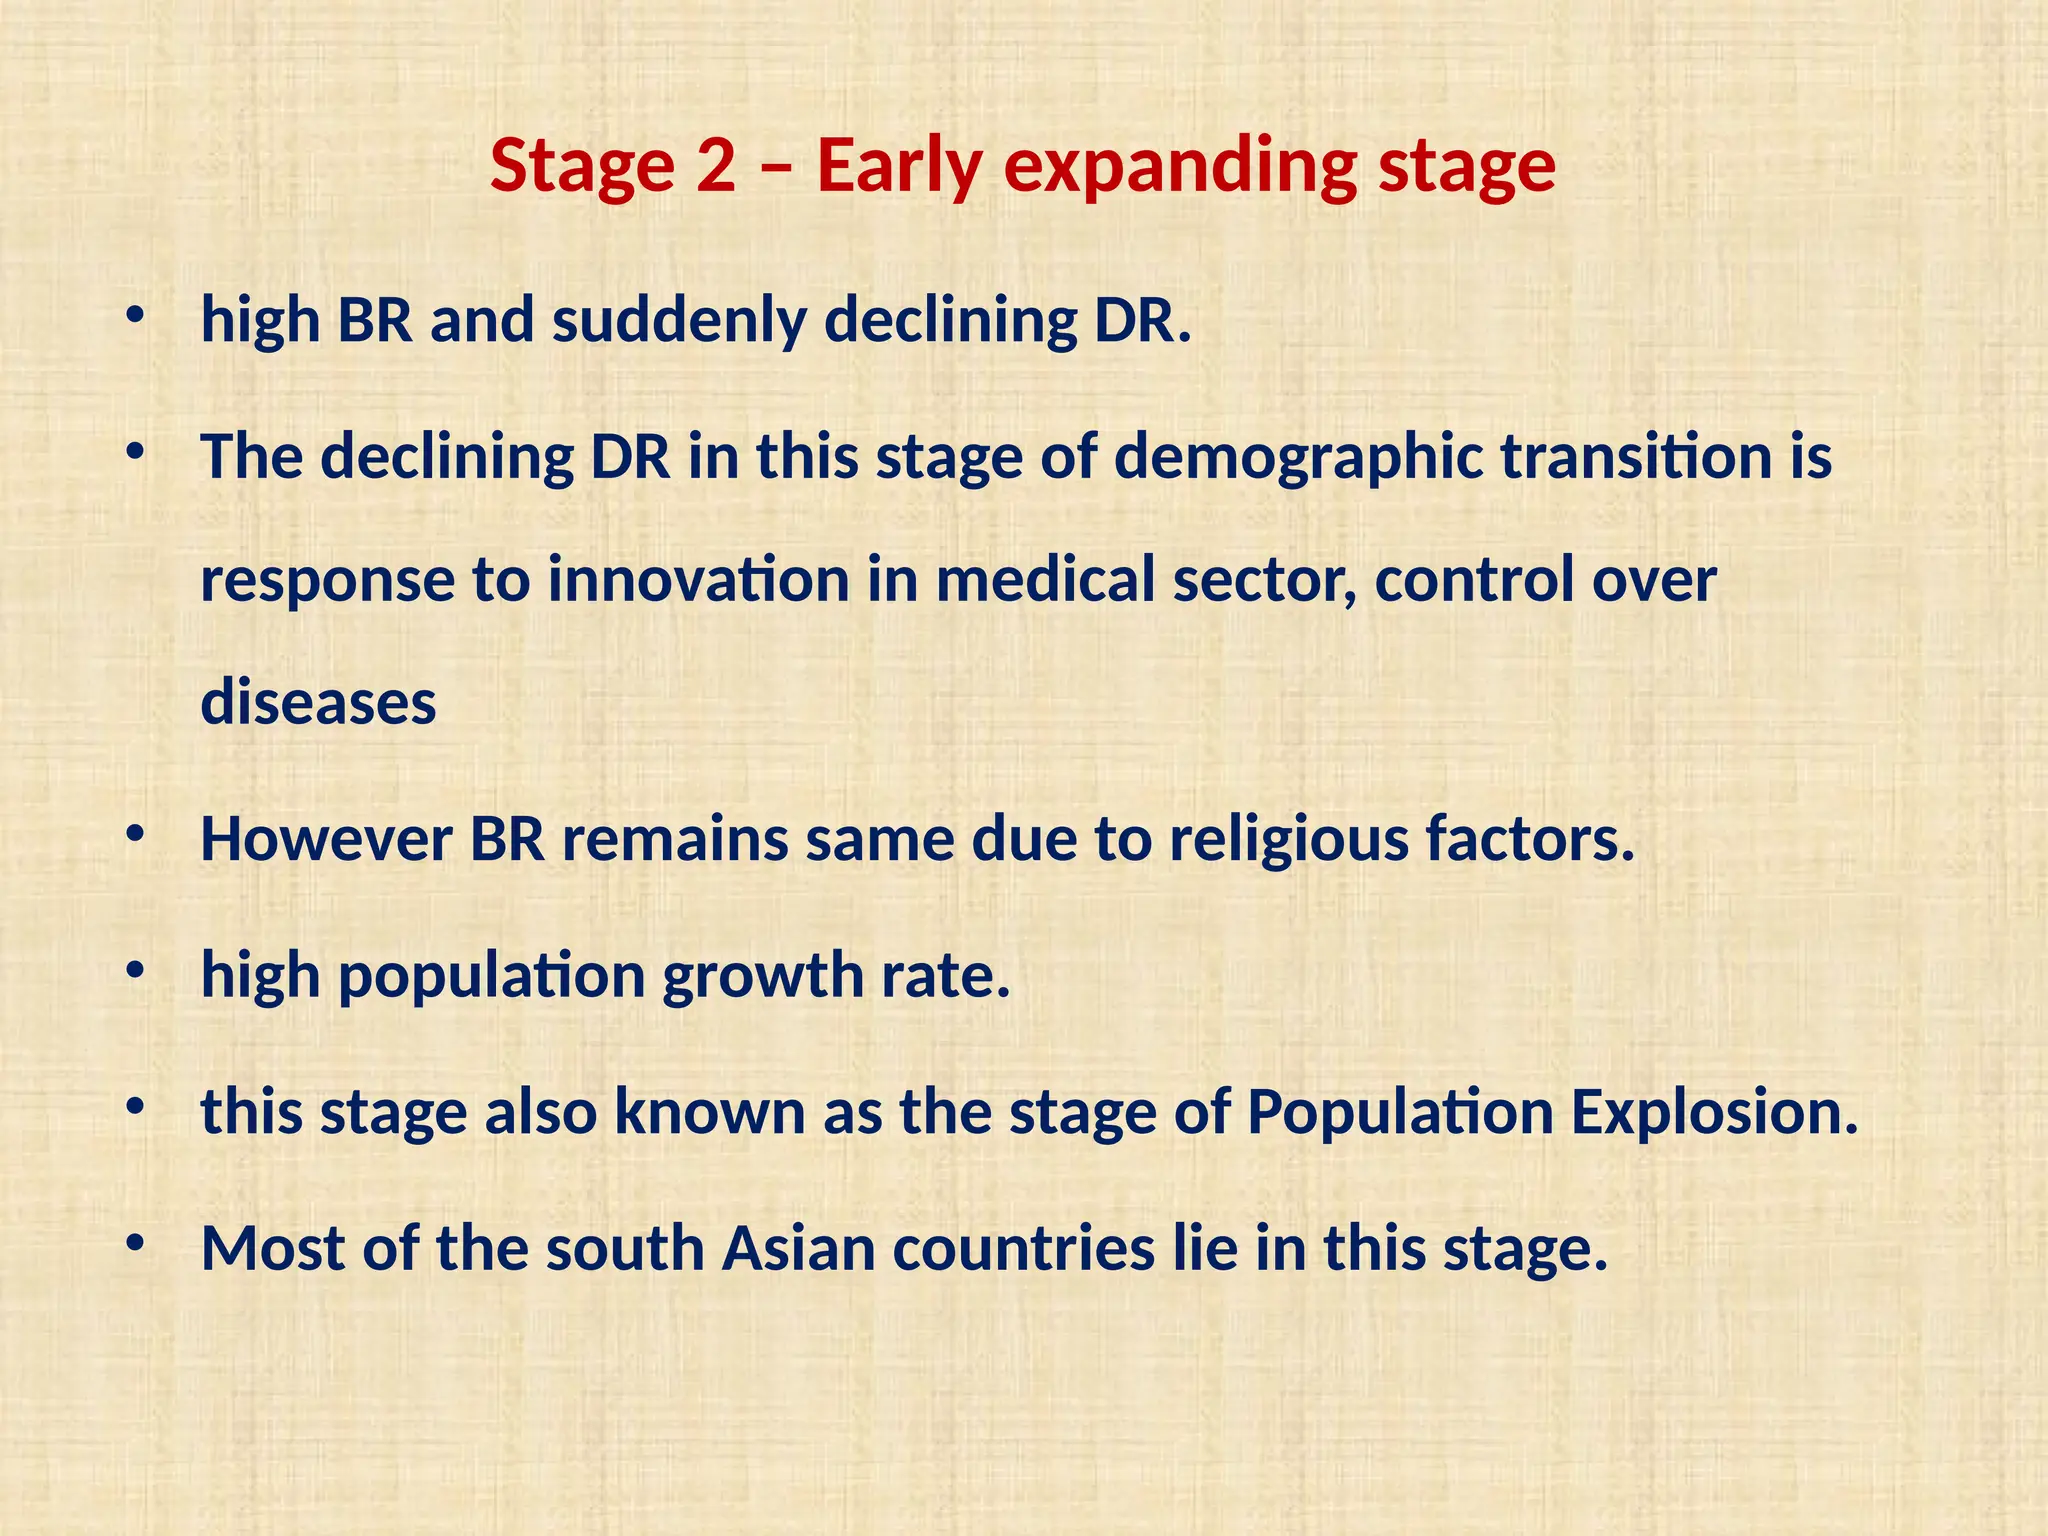
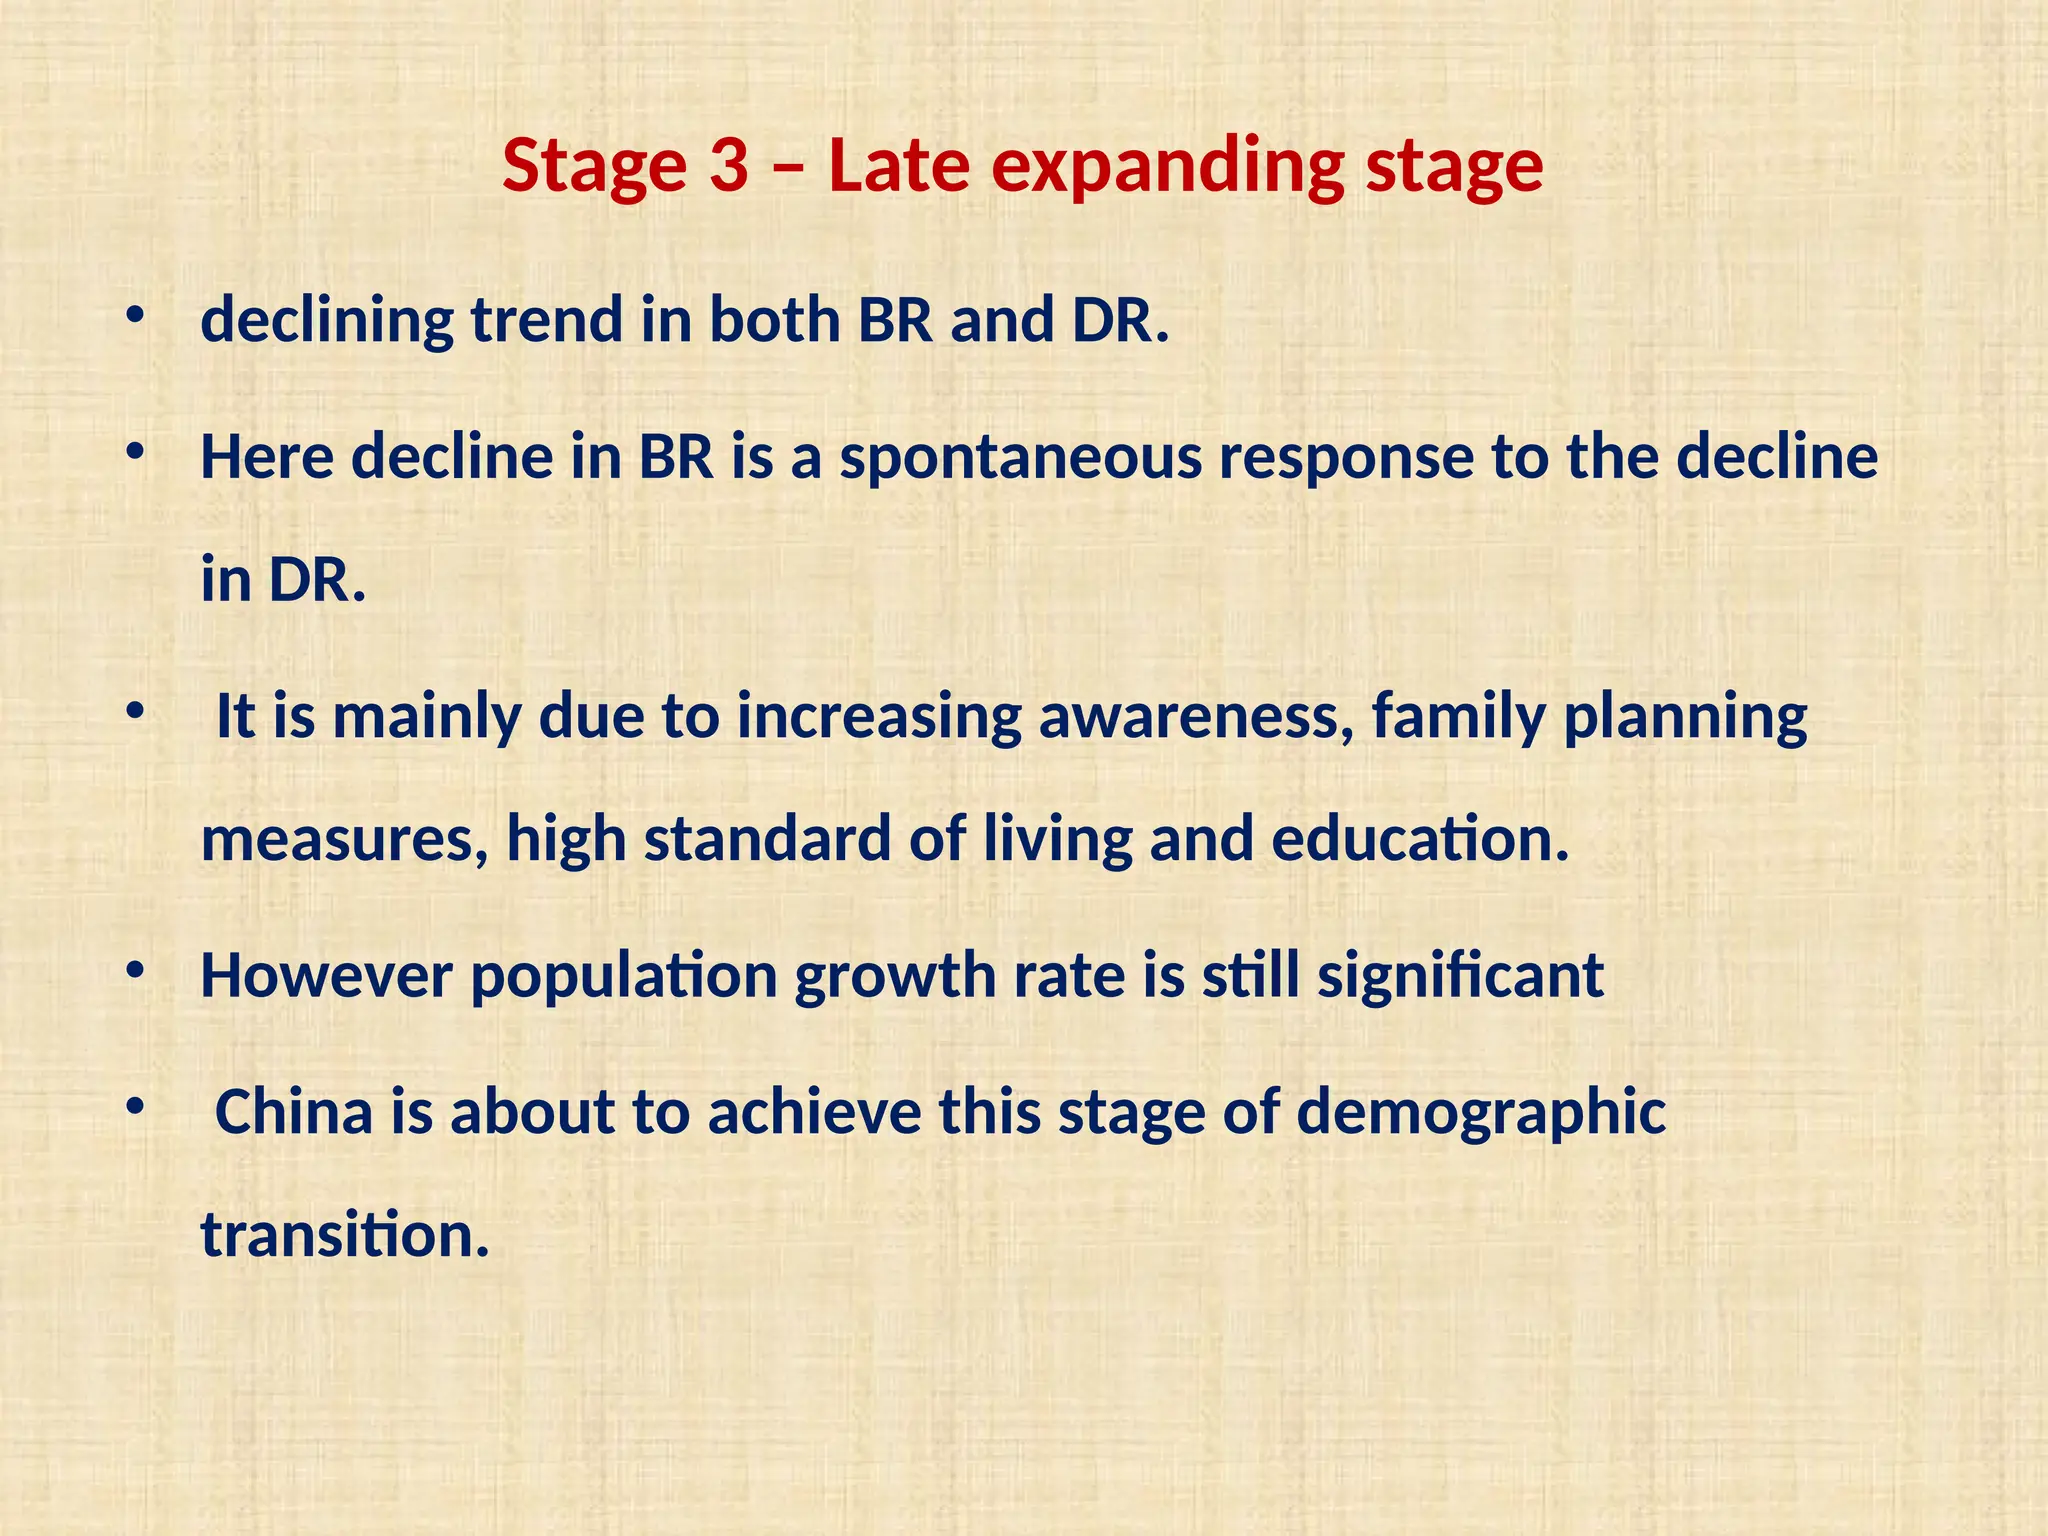
World population growth
• Population of a country determines the level of economic
development
• increase in population accelerates the use of natural resources.
• needed to understand the status of world population growth
• The world population is growing at an alarmic rate.
• The world population size has increased by many folds since
last fifty years.
• World population has increased with increasing growth rate.
Year 1650 1850 1930 1960 1975 1987 1998 2001 2011
Population
In Billion
0.5 1 2 3 4 5 6 6.5 6.9
Doubling
period in
Years
- 200 80 - 45 - - - -
World population growth
Phases of world population growth
• Period of agricultural revolution
• Period of industrial revolution
• Period of population explosion
• Period of declining population growth rate
Patterns of global population growth
• There is significant variation in population growth rate across
the world.
• More developed countries achieved population growth rate of
0.43% annually
• whereas it is 1.81% among less develop countries.
• African nations show highest annual population growth rates
of up to 2.57% followed by Latin America (1.77%), Asian
nations (1.61%), north America (1.05%) and Oceania (1.49%).
Geographical patterns of natural population
growth (annual growth rate)
• Negative population growth (< 0%) – Eastern Europe
• Low population growth (0-1%) – Western Europe, N. America,
South Africa, China, Oceania
• Moderate population growth (1-2%) – India, Bangladesh,
Myanmar, Southeast Asia
• High population growth (2-3%) – Afghanistan, Pakistan, Africa
• Very high population growth (> 3%) – Southeast Africa
Demographic Transition Model/Theory
• systematic relationship between population and economic
development
• later converted in demographic transition theory.
• This theory was proposed by Frank Notestein and Warren S. Thompson.
• The demographic transition theory is related to population growth and
economic development.
• Here population growth is considered as natural population growth in
terms of birth rate and death rate.
• changes in population size with respect to social-economic
transformation over the period.
Warren S.
Thompson
Frank
Notestein
Natural population growth
• It refers to the difference between the death rate and birth
rate and denoted as NPGR.
• NPGR = BR – DR where (NPGR = Natural population growth
rate, BR = birth rate , DR = Death rate)
• Birth Rate : it refers to the actual number of live births in a
year per 1000 population and denoted as BR.
• BR = Total number of births in a year / Total population X 1000
• Death Rate : it refers to the actual number of deaths in a year
per 1000 population and denoted as DR.
• DR = Total number of deaths in a year / Total population X 1000
Assumptions
• Change in population size is determined by BR and DR
• BR and DR never remain constant
• Decline in DR is always followed by decline in BR
• Change in population size is response to social –economic
transformation.
Stages of Demographic Transition
• Stage 1 – High stationary stage
• Stage 2 – Early expanding stage
• Stage 3 – Late expanding stage
• Stage 4 – Low stationary stage
• Stage 5 – Stage of negative population growth
Stage 1 – High stationary stage
• high birth rate and death rate.
• This stage backward economies.
• High death rate is mainly a result of poor medical facilities,
natural hazards, epidemics and infant deaths.
• High BR is associated with low life expectancy, agro-based
economy, lack of awareness and old traditions and customs.
• However the growth rate of population is significantly low
due to negligible difference between BR and DR.
Stage 2 – Early expanding stage
• high BR and suddenly declining DR.
• The declining DR in this stage of demographic transition is
response to innovation in medical sector, control over
diseases
• However BR remains same due to religious factors.
• high population growth rate.
• this stage also known as the stage of Population Explosion.
• Most of the south Asian countries lie in this stage.
Stage 3 – Late expanding stage
• declining trend in both BR and DR.
• Here decline in BR is a spontaneous response to the decline
in DR.
• It is mainly due to increasing awareness, family planning
measures, high standard of living and education.
• However population growth rate is still significant
• China is about to achieve this stage of demographic
transition.
Stage 4 – Low stationary stage
• low birth rate and death rate.
• implies the features of highly developed economies
• High standard of living and realization of significance of
small family.
• European countries lie in this stage of demographic
transition.
• population growth rate is almost zero.
• this stage is also known as stage of Zero Population growth.
Thank You

population growth and demographic transition model

  • 1.
    World population growth •Population of a country determines the level of economic development • increase in population accelerates the use of natural resources. • needed to understand the status of world population growth • The world population is growing at an alarmic rate. • The world population size has increased by many folds since last fifty years. • World population has increased with increasing growth rate.
  • 2.
    Year 1650 18501930 1960 1975 1987 1998 2001 2011 Population In Billion 0.5 1 2 3 4 5 6 6.5 6.9 Doubling period in Years - 200 80 - 45 - - - - World population growth
  • 3.
    Phases of worldpopulation growth • Period of agricultural revolution • Period of industrial revolution • Period of population explosion • Period of declining population growth rate
  • 4.
    Patterns of globalpopulation growth • There is significant variation in population growth rate across the world. • More developed countries achieved population growth rate of 0.43% annually • whereas it is 1.81% among less develop countries. • African nations show highest annual population growth rates of up to 2.57% followed by Latin America (1.77%), Asian nations (1.61%), north America (1.05%) and Oceania (1.49%).
  • 5.
    Geographical patterns ofnatural population growth (annual growth rate) • Negative population growth (< 0%) – Eastern Europe • Low population growth (0-1%) – Western Europe, N. America, South Africa, China, Oceania • Moderate population growth (1-2%) – India, Bangladesh, Myanmar, Southeast Asia • High population growth (2-3%) – Afghanistan, Pakistan, Africa • Very high population growth (> 3%) – Southeast Africa
  • 6.
    Demographic Transition Model/Theory •systematic relationship between population and economic development • later converted in demographic transition theory. • This theory was proposed by Frank Notestein and Warren S. Thompson. • The demographic transition theory is related to population growth and economic development. • Here population growth is considered as natural population growth in terms of birth rate and death rate. • changes in population size with respect to social-economic transformation over the period. Warren S. Thompson Frank Notestein
  • 7.
    Natural population growth •It refers to the difference between the death rate and birth rate and denoted as NPGR. • NPGR = BR – DR where (NPGR = Natural population growth rate, BR = birth rate , DR = Death rate) • Birth Rate : it refers to the actual number of live births in a year per 1000 population and denoted as BR. • BR = Total number of births in a year / Total population X 1000 • Death Rate : it refers to the actual number of deaths in a year per 1000 population and denoted as DR. • DR = Total number of deaths in a year / Total population X 1000
  • 8.
    Assumptions • Change inpopulation size is determined by BR and DR • BR and DR never remain constant • Decline in DR is always followed by decline in BR • Change in population size is response to social –economic transformation.
  • 9.
    Stages of DemographicTransition • Stage 1 – High stationary stage • Stage 2 – Early expanding stage • Stage 3 – Late expanding stage • Stage 4 – Low stationary stage • Stage 5 – Stage of negative population growth
  • 10.
    Stage 1 –High stationary stage • high birth rate and death rate. • This stage backward economies. • High death rate is mainly a result of poor medical facilities, natural hazards, epidemics and infant deaths. • High BR is associated with low life expectancy, agro-based economy, lack of awareness and old traditions and customs. • However the growth rate of population is significantly low due to negligible difference between BR and DR.
  • 11.
    Stage 2 –Early expanding stage • high BR and suddenly declining DR. • The declining DR in this stage of demographic transition is response to innovation in medical sector, control over diseases • However BR remains same due to religious factors. • high population growth rate. • this stage also known as the stage of Population Explosion. • Most of the south Asian countries lie in this stage.
  • 12.
    Stage 3 –Late expanding stage • declining trend in both BR and DR. • Here decline in BR is a spontaneous response to the decline in DR. • It is mainly due to increasing awareness, family planning measures, high standard of living and education. • However population growth rate is still significant • China is about to achieve this stage of demographic transition.
  • 13.
    Stage 4 –Low stationary stage • low birth rate and death rate. • implies the features of highly developed economies • High standard of living and realization of significance of small family. • European countries lie in this stage of demographic transition. • population growth rate is almost zero. • this stage is also known as stage of Zero Population growth.
  • 14.