This document provides an overview of Duncan's multiple range test, a statistical method used to compare all pairs of means and group means that are not significantly different. It explains the steps to perform Duncan's test, including calculating ranked means, finding critical values using tables, and comparing means to determine grouping. An example using data from a plant study demonstrates how to apply Duncan's test to analyze differences between varietal means.
Standard error is used in the place of deviation. it shows the variations among sample is correlate to sampling error. list of formula used for standard error for different statistics and applications of tests of significance in biological sciences
Standard error is used in the place of deviation. it shows the variations among sample is correlate to sampling error. list of formula used for standard error for different statistics and applications of tests of significance in biological sciences
Please Subscribe to this Channel for more solutions and lectures
http://www.youtube.com/onlineteaching
Chapter 12: Analysis of Variance
12.2: Two-Way ANOVA
Today’s overwhelming number of techniques applicable to data analysis makes it extremely difficult to define the most beneficial approach while considering all the significant variables.
The analysis of variance has been studied from several approaches, the most common of which uses a linear model that relates the response to the treatments and blocks. Note that the model is linear in parameters but may be nonlinear across factor levels. Interpretation is easy when data is balanced across factors but much deeper understanding is needed for unbalanced data.
Analysis of variance (ANOVA) is a collection of statistical models and their associated estimation procedures (such as the "variation" among and between groups) used to analyze the differences among means. ANOVA was developed by the statistician Ronald Fisher. ANOVA is based on the law of total variance, where the observed variance in a particular variable is partitioned into components attributable to different sources of variation. In its simplest form, ANOVA provides a statistical test of whether two or more population means are equal, and therefore generalizes the t-test beyond two means. In other words, the ANOVA is used to test the difference between two or more means.Analysis of variance (ANOVA) is an analysis tool used in statistics that splits an observed aggregate variability found inside a data set into two parts: systematic factors and random factors. The systematic factors have a statistical influence on the given data set, while the random factors do not. Analysts use the ANOVA test to determine the influence that independent variables have on the dependent variable in a regression study.
Sir Ronald Fisher pioneered the development of ANOVA for analyzing results of agricultural experiments.1 Today, ANOVA is included in almost every statistical package, which makes it accessible to investigators in all experimental sciences. It is easy to input a data set and run a simple ANOVA, but it is challenging to choose the appropriate ANOVA for different experimental designs, to examine whether data adhere to the modeling assumptions, and to interpret the results correctly. The purpose of this report, together with the next 2 articles in the Statistical Primer for Cardiovascular Research series, is to enhance understanding of ANVOA and to promote its successful use in experimental cardiovascular research. My colleagues and I attempt to accomplish those goals through examples and explanation, while keeping within reason the burden of notation, technical jargon, and mathematical equations.
Volkswagen Hidden Advert - Gamification in Recruitment - Dr. Manu Melwin Joymanumelwin
For more interesting case studies and updates about Gamification, visit my website
https://www.youtube.com/channel/UCm_r2ZYJJBwGJ2rAaRNTNBA/videos
Volkswagen was in need of skilled mechanics. So clearly, they should just jumped on the web and started advertising for open positions, right? Wrong. The best candidates may already be working somewhere else. Volkswagen chose a no less unusual place for their vacancy ads.
Swedish Armed Force - Who Cares? - Gamification in Recruitment - Dr. Manu Mel...manumelwin
For more interesting case studies and updates about Gamification, visit my website
https://www.youtube.com/channel/UCm_r2ZYJJBwGJ2rAaRNTNBA/videos
The Swedish Armed Forces are recruiting. They need young men and women for an occupation that in many ways is about giving up your own safety in order to help others. They wanted to activate the target group while simultaneously raising the question. Would people sacrifice their own freedom for someone they have no relation to? Are people prepared to show that they care in ways that don’t include sharing something on Facebook or tweeting a specific hash-tag?
IKEA - Assemble your career - Gamification in Recruitment - Dr. Manu Melwin Joymanumelwin
For more interesting case studies and updates about Gamification, visit my website
https://www.youtube.com/channel/UCm_r2ZYJJBwGJ2rAaRNTNBA/videos
In an attempt to recruit a large number of workers for their new megastore in Australia, IKEA amusingly decided to include what they called ‘Career Instructions’ into each of their flat packs. Based on their traditional furniture instructions, all customers took home the witty application forms without realising. The clever initiative not only minimised the costs on advertising, but it also ensured IKEA fans were targeted.
Bletchley Park’s crossword - Gamification in Recruitment - Dr. Manu Melwin Joymanumelwin
For more interesting case studies and updates about Gamification, visit my website
https://www.youtube.com/channel/UCm_r2ZYJJBwGJ2rAaRNTNBA/videos
One great historical example of gamification is the Daily Telegraph’s crossword, which British Intelligence agents created along with Alan Turing, to help them recruit new code breakers from the public.
Yates’ algorithm for 2n factorial experiment - Dr. Manu Melwin Joy - School o...manumelwin
In statistics, a Yates analysis is an approach to analyzing data obtained from a designed experiment, where a factorial design has been used. This algorithm was named after the English statistician Frank Yates and is called Yates' algorithm.
Factorial design - Dr. Manu Melwin Joy - School of Management Studies, Cochin...manumelwin
In statistics, a full factorial experiment is an experiment whose design consists of two or more factors, each with discrete possible values or "levels", and whose experimental units take on all possible combinations of these levels across all such factors.
Latin square design- Dr. Manu Melwin Joy - School of Management Studies, Coch...manumelwin
The Latin square design is used where the researcher desires to control the variation in an experiment that is related to rows and columns in the field.
Randomized complete block design - Dr. Manu Melwin Joy - School of Management...manumelwin
A completely randomized design (CRD) is one where the treatments are assigned completely at random so that each experimental unit has the same chance of receiving any one treatment.
For the CRD, any difference among experimental units receiving the same treatment is considered as experimental error.
ANOVA - Dr. Manu Melwin Joy - School of Management Studies, Cochin University...manumelwin
Analysis of Variance technique is used to test whether the mean of several samples differ significantly. An agronomist may like to know whether yield per acre will be the same if four different varieties of wheat are sown in different identical plots. A diary farm may like to test whether there is significant difference between the quality and quantity of milk obtained from different classes of cattle. A business manager may like to find out whether there is any difference in the average sales by four salesmen.
Design of experiments - Dr. Manu Melwin Joy - School of Management Studies, C...manumelwin
Planning an experiment to obtain appropriate data and drawing inference out of the data with respect to any problem under investigation is known as design and analysis of experiments.
This might range anywhere from the formulations of the objectives of the experiment in clear terms to the final stage of the drafting reports incorporating the important findings of the enquiry
How information system is transforming business - - Dr. Manu Melwin Joy - Sch...manumelwin
In 2010, American businesses will spend over $562 billion on information systems hardware, software, and telecommunications equipment. In addition, they will spend another $800 billion on business and management consulting and services—much of which involves redesigning firms’ business operations to take advantage of these new technologies.
Internet revolution - Dr. Manu Melwin Joy - School of Management Studies, Coc...manumelwin
The computer networking revolution began in the early 1960s and has led us to today s technology. The Internet was first invented for military purposes, and then expanded to the purpose of communication among scientists. The invention also came about in part by the increasing need for computers in the 1960s. The Internet is bringing a revolution along with it. Access to information combined with global supply and demand is reshaping established conventions and destroying old world definitions.
Smart phone revolution - Dr. Manu Melwin Joy - School of Management Studies, ...manumelwin
A smartphone is a handheld personal computer with a mobile operating system and an integrated mobile broadband cellular network connection for voice, SMS, and Internet data communication; most if not all smartphones also support Wi-Fi. Smartphones are typically pocket-sized, as opposed to tablets, which are much larger.Smartphones became widespread in the late 2000s. In the third quarter of 2012, one billion smartphones were in use worldwide. Global smartphone sales surpassed the sales figures for feature phones in early 2013.
Definition of information system - Dr. Manu Melwin Joy - School of Management...manumelwin
An information system is a set of interrelated components that collect, process, store, and distribute information to support decision making and control in an organization.
PESTEL Analysis - Manu Melwin Joy - School of Management Studies, Cochin Univ...manumelwin
Image result for pestel analysis
A PESTEL analysis is a framework or tool used by marketers to analyse and monitor the macro-environmental (external marketing environment) factors that have an impact on an organisation. The result of which is used to identify threats and weaknesses which is used in a SWOT analysis.
Oxytocin and Trust - Neuro Human Resource Management (NHRM) - Manu Melwin Joymanumelwin
Neuro human resource management is a new field of human resource management which uses medical technologies such as functional Magnetic Resonance Imaging (fMRI) to study the brain's responses to enhance employee experience. The term Neuro Human Resource Management (NHRM) was coined by noted HR expert Dr. Manu Melwin Joy in April 2017.
Industrial marketing (B2B) is the marketing of goods and services by one business to another. Industrial goods are those an industry uses to produce an end product from one or more raw materials.
Industrial marketing (B2B) is the marketing of goods and services by one business to another. Industrial goods are those an industry uses to produce an end product from one or more raw materials.
Green marketing is the of products that are presumed to be environmentally safe. It incorporates a broad range of activities, including product modification, changes to the production process, sustainable packaging, as well as modifying advertising.
Gamification in customer engagement - 5 success stories - Manu Melwin Joymanumelwin
For more interesting case studies and updates about Gamification, visit my website
https://www.youtube.com/channel/UCm_r2ZYJJBwGJ2rAaRNTNBA/videos
Air Miles Reward Miles
Cocacola Shake It
Disney Movie Rewards
Ionopolis
My Starbucks Rewards
Levelwise PageRank with Loop-Based Dead End Handling Strategy : SHORT REPORT ...Subhajit Sahu
Abstract — Levelwise PageRank is an alternative method of PageRank computation which decomposes the input graph into a directed acyclic block-graph of strongly connected components, and processes them in topological order, one level at a time. This enables calculation for ranks in a distributed fashion without per-iteration communication, unlike the standard method where all vertices are processed in each iteration. It however comes with a precondition of the absence of dead ends in the input graph. Here, the native non-distributed performance of Levelwise PageRank was compared against Monolithic PageRank on a CPU as well as a GPU. To ensure a fair comparison, Monolithic PageRank was also performed on a graph where vertices were split by components. Results indicate that Levelwise PageRank is about as fast as Monolithic PageRank on the CPU, but quite a bit slower on the GPU. Slowdown on the GPU is likely caused by a large submission of small workloads, and expected to be non-issue when the computation is performed on massive graphs.
StarCompliance is a leading firm specializing in the recovery of stolen cryptocurrency. Our comprehensive services are designed to assist individuals and organizations in navigating the complex process of fraud reporting, investigation, and fund recovery. We combine cutting-edge technology with expert legal support to provide a robust solution for victims of crypto theft.
Our Services Include:
Reporting to Tracking Authorities:
We immediately notify all relevant centralized exchanges (CEX), decentralized exchanges (DEX), and wallet providers about the stolen cryptocurrency. This ensures that the stolen assets are flagged as scam transactions, making it impossible for the thief to use them.
Assistance with Filing Police Reports:
We guide you through the process of filing a valid police report. Our support team provides detailed instructions on which police department to contact and helps you complete the necessary paperwork within the critical 72-hour window.
Launching the Refund Process:
Our team of experienced lawyers can initiate lawsuits on your behalf and represent you in various jurisdictions around the world. They work diligently to recover your stolen funds and ensure that justice is served.
At StarCompliance, we understand the urgency and stress involved in dealing with cryptocurrency theft. Our dedicated team works quickly and efficiently to provide you with the support and expertise needed to recover your assets. Trust us to be your partner in navigating the complexities of the crypto world and safeguarding your investments.
Show drafts
volume_up
Empowering the Data Analytics Ecosystem: A Laser Focus on Value
The data analytics ecosystem thrives when every component functions at its peak, unlocking the true potential of data. Here's a laser focus on key areas for an empowered ecosystem:
1. Democratize Access, Not Data:
Granular Access Controls: Provide users with self-service tools tailored to their specific needs, preventing data overload and misuse.
Data Catalogs: Implement robust data catalogs for easy discovery and understanding of available data sources.
2. Foster Collaboration with Clear Roles:
Data Mesh Architecture: Break down data silos by creating a distributed data ownership model with clear ownership and responsibilities.
Collaborative Workspaces: Utilize interactive platforms where data scientists, analysts, and domain experts can work seamlessly together.
3. Leverage Advanced Analytics Strategically:
AI-powered Automation: Automate repetitive tasks like data cleaning and feature engineering, freeing up data talent for higher-level analysis.
Right-Tool Selection: Strategically choose the most effective advanced analytics techniques (e.g., AI, ML) based on specific business problems.
4. Prioritize Data Quality with Automation:
Automated Data Validation: Implement automated data quality checks to identify and rectify errors at the source, minimizing downstream issues.
Data Lineage Tracking: Track the flow of data throughout the ecosystem, ensuring transparency and facilitating root cause analysis for errors.
5. Cultivate a Data-Driven Mindset:
Metrics-Driven Performance Management: Align KPIs and performance metrics with data-driven insights to ensure actionable decision making.
Data Storytelling Workshops: Equip stakeholders with the skills to translate complex data findings into compelling narratives that drive action.
Benefits of a Precise Ecosystem:
Sharpened Focus: Precise access and clear roles ensure everyone works with the most relevant data, maximizing efficiency.
Actionable Insights: Strategic analytics and automated quality checks lead to more reliable and actionable data insights.
Continuous Improvement: Data-driven performance management fosters a culture of learning and continuous improvement.
Sustainable Growth: Empowered by data, organizations can make informed decisions to drive sustainable growth and innovation.
By focusing on these precise actions, organizations can create an empowered data analytics ecosystem that delivers real value by driving data-driven decisions and maximizing the return on their data investment.
Opendatabay - Open Data Marketplace.pptxOpendatabay
Opendatabay.com unlocks the power of data for everyone. Open Data Marketplace fosters a collaborative hub for data enthusiasts to explore, share, and contribute to a vast collection of datasets.
First ever open hub for data enthusiasts to collaborate and innovate. A platform to explore, share, and contribute to a vast collection of datasets. Through robust quality control and innovative technologies like blockchain verification, opendatabay ensures the authenticity and reliability of datasets, empowering users to make data-driven decisions with confidence. Leverage cutting-edge AI technologies to enhance the data exploration, analysis, and discovery experience.
From intelligent search and recommendations to automated data productisation and quotation, Opendatabay AI-driven features streamline the data workflow. Finding the data you need shouldn't be a complex. Opendatabay simplifies the data acquisition process with an intuitive interface and robust search tools. Effortlessly explore, discover, and access the data you need, allowing you to focus on extracting valuable insights. Opendatabay breaks new ground with a dedicated, AI-generated, synthetic datasets.
Leverage these privacy-preserving datasets for training and testing AI models without compromising sensitive information. Opendatabay prioritizes transparency by providing detailed metadata, provenance information, and usage guidelines for each dataset, ensuring users have a comprehensive understanding of the data they're working with. By leveraging a powerful combination of distributed ledger technology and rigorous third-party audits Opendatabay ensures the authenticity and reliability of every dataset. Security is at the core of Opendatabay. Marketplace implements stringent security measures, including encryption, access controls, and regular vulnerability assessments, to safeguard your data and protect your privacy.
2. Prepared By
Dr. Manu Melwin Joy
Assistant Professor
School of Management Studies
Cochin University of Science and Technology
Kerala, India.
Phone – 9744551114
Mail – manumelwinjoy@cusat.ac.in
Kindly restrict the use of slides for personal purpose.
Please seek permission to reproduce the same in public forms and
presentations.
3. Multiple comparison of means
• Numerous procedures can be used for
multiple comparison of means.
– Fisher’s Least Significant Difference.
– Tukey’s significant difference.
– Student – Newman Keuls (SNK).
– Duncan’s multiple range test.
4. Multiple comparison of means
• In any MC procedure, if the observed
difference between any two means is greater
than a critical value, the two means are
considered to be different.
5. Ducan’s multiple range test
• In 1955, Duncan devised a method to
compare each treatment mean with every
other treatment mean. The procedure is
simple and powerful and has become very
popular among researchers, especially in the
plant science area.
6. Ducan’s multiple range test
• The following example will be helpful to
understand the procedure. There are 2
candidates (variety A and variety B) and 4
comparators (varieties C to F) in a randomized
complete block design with four replications.
We want to compare the mean leaf length of
these varieties.
7. • The data and the Analysis of Variance
(ANOVA) are presented below.
8. Ducan’s multiple range test
• From the ANOVA F test, it is evident that there
are significant differences between the variety
means: however, it does not in any way
indicate which means are different or the
magnitude of differences. A pairwise t test
could be used to compare each candidate with
each comparator or a DMR test could be
performed to find the differences between the
various mean combinations.
11. Ducan’s multiple range test
• Step 3: Use the Duncan’s Multiple Range
Table (Appendix 1) for ranked order of
means at p = 0.01. This table is found in
the back of almost every statistics text
book. First, look vertically for the
appropriate df value which is the df value
for error in the ANOVA table (in this
example 15 ) then move horizontally to find
the rp values for the ranked order of mean
(in this example look for Rank 2 to Rank 6)
14. Ducan’s multiple range test
• Step 5: Compare the ranked means in all possible
combinations. Beginning with the largest mean,
each variety mean is compared to the smallest mean
using the appropriate critical value (Dp). For
example, the largest mean (Var B) and the smallest
mean (Var A) are 6 steps apart in the ranked order
therefore the correct critical value for comparing
them would be 6.59.
15. Ducan’s multiple range test
• The mean difference between these two varieties is 22.15,
which is higher than the Duncan’s critical value therefore we
can conclude that these two means are significantly different
at P=0.01. Similarly, when comparing the second largest
mean (Var E) with the smallest mean (Var A) we would use the
critical value of 6.50 because these two means are 5 steps
apart in the ranked order. The results of mean comparisons in
all possible combinations using the appropriate Dp values are
summarized below:
17. Ducan’s multiple range test
• Step 6: We can now summarize the results from the above
comparison as:
• There are no significant differences between varietal means
of B, E and C: however, they are significantly different from D,
F and A.
• There is no significant difference between the varietal means
of D and F; there is also no significant difference between the
varietal means of F and A: therefore, variety F falls within the
grouping range of both variety D and A. However, variety D is
significantly different from variety A.
18. Ducan’s multiple range test
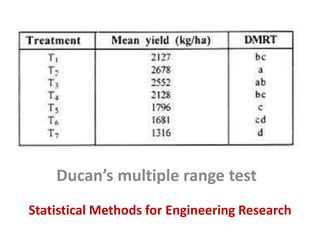
• This is usually presented in the following format:
• Variety B 69.90a
• Variety E 68.88a
• Variety C 66.83a
• Variety D 57.93b
• Variety F 52.33 bc
• Variety A 47.75c