Download as PDF, PPTX
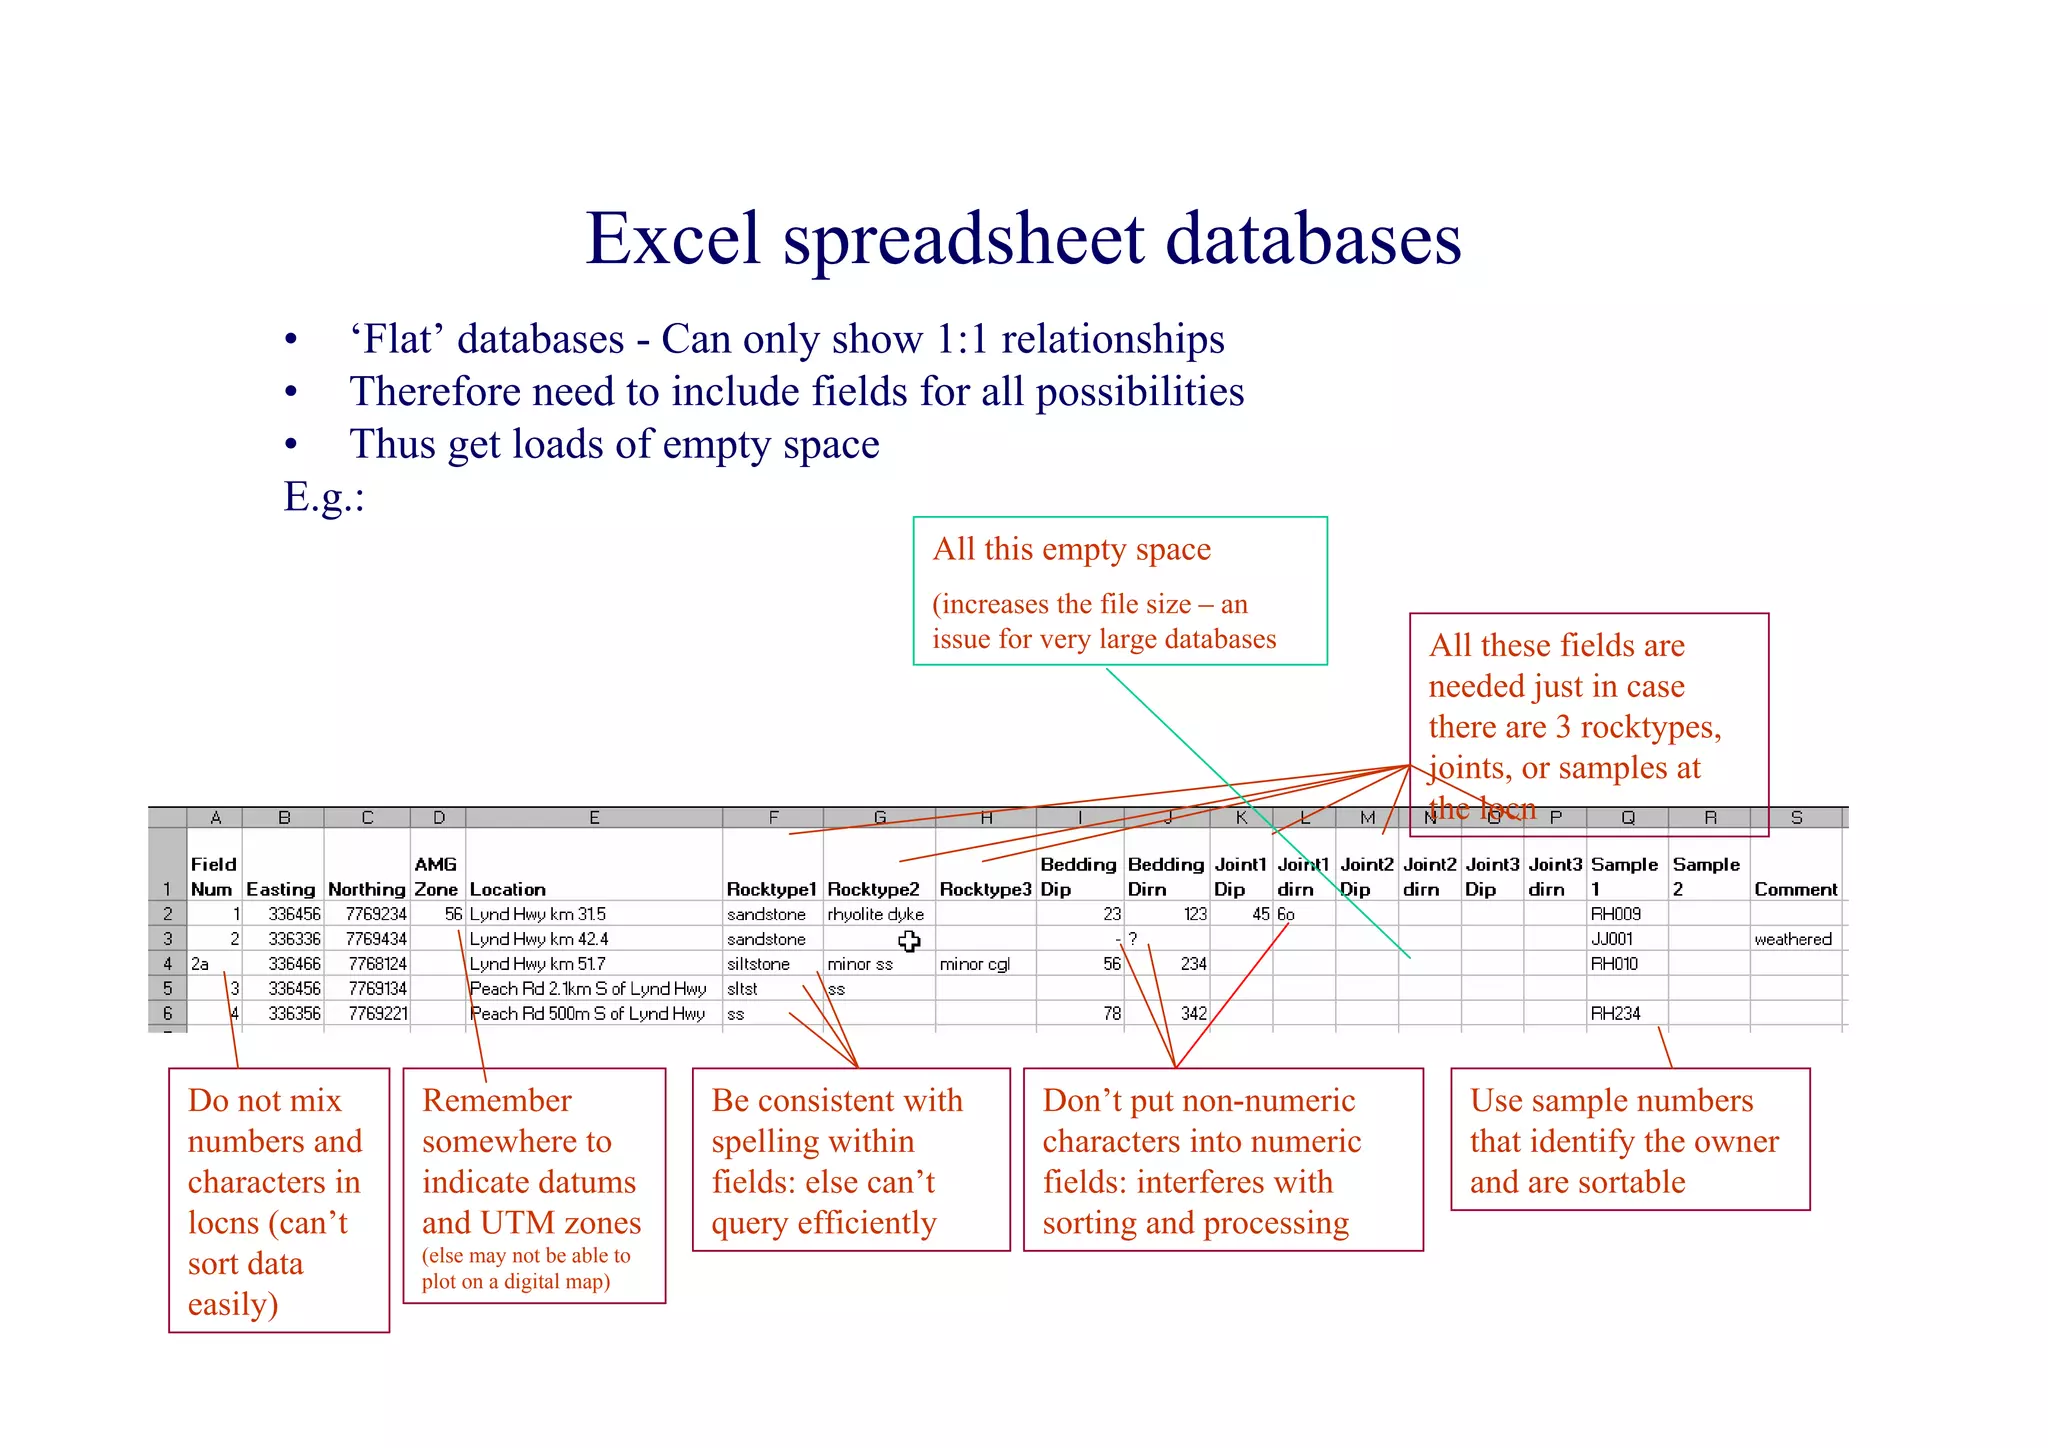
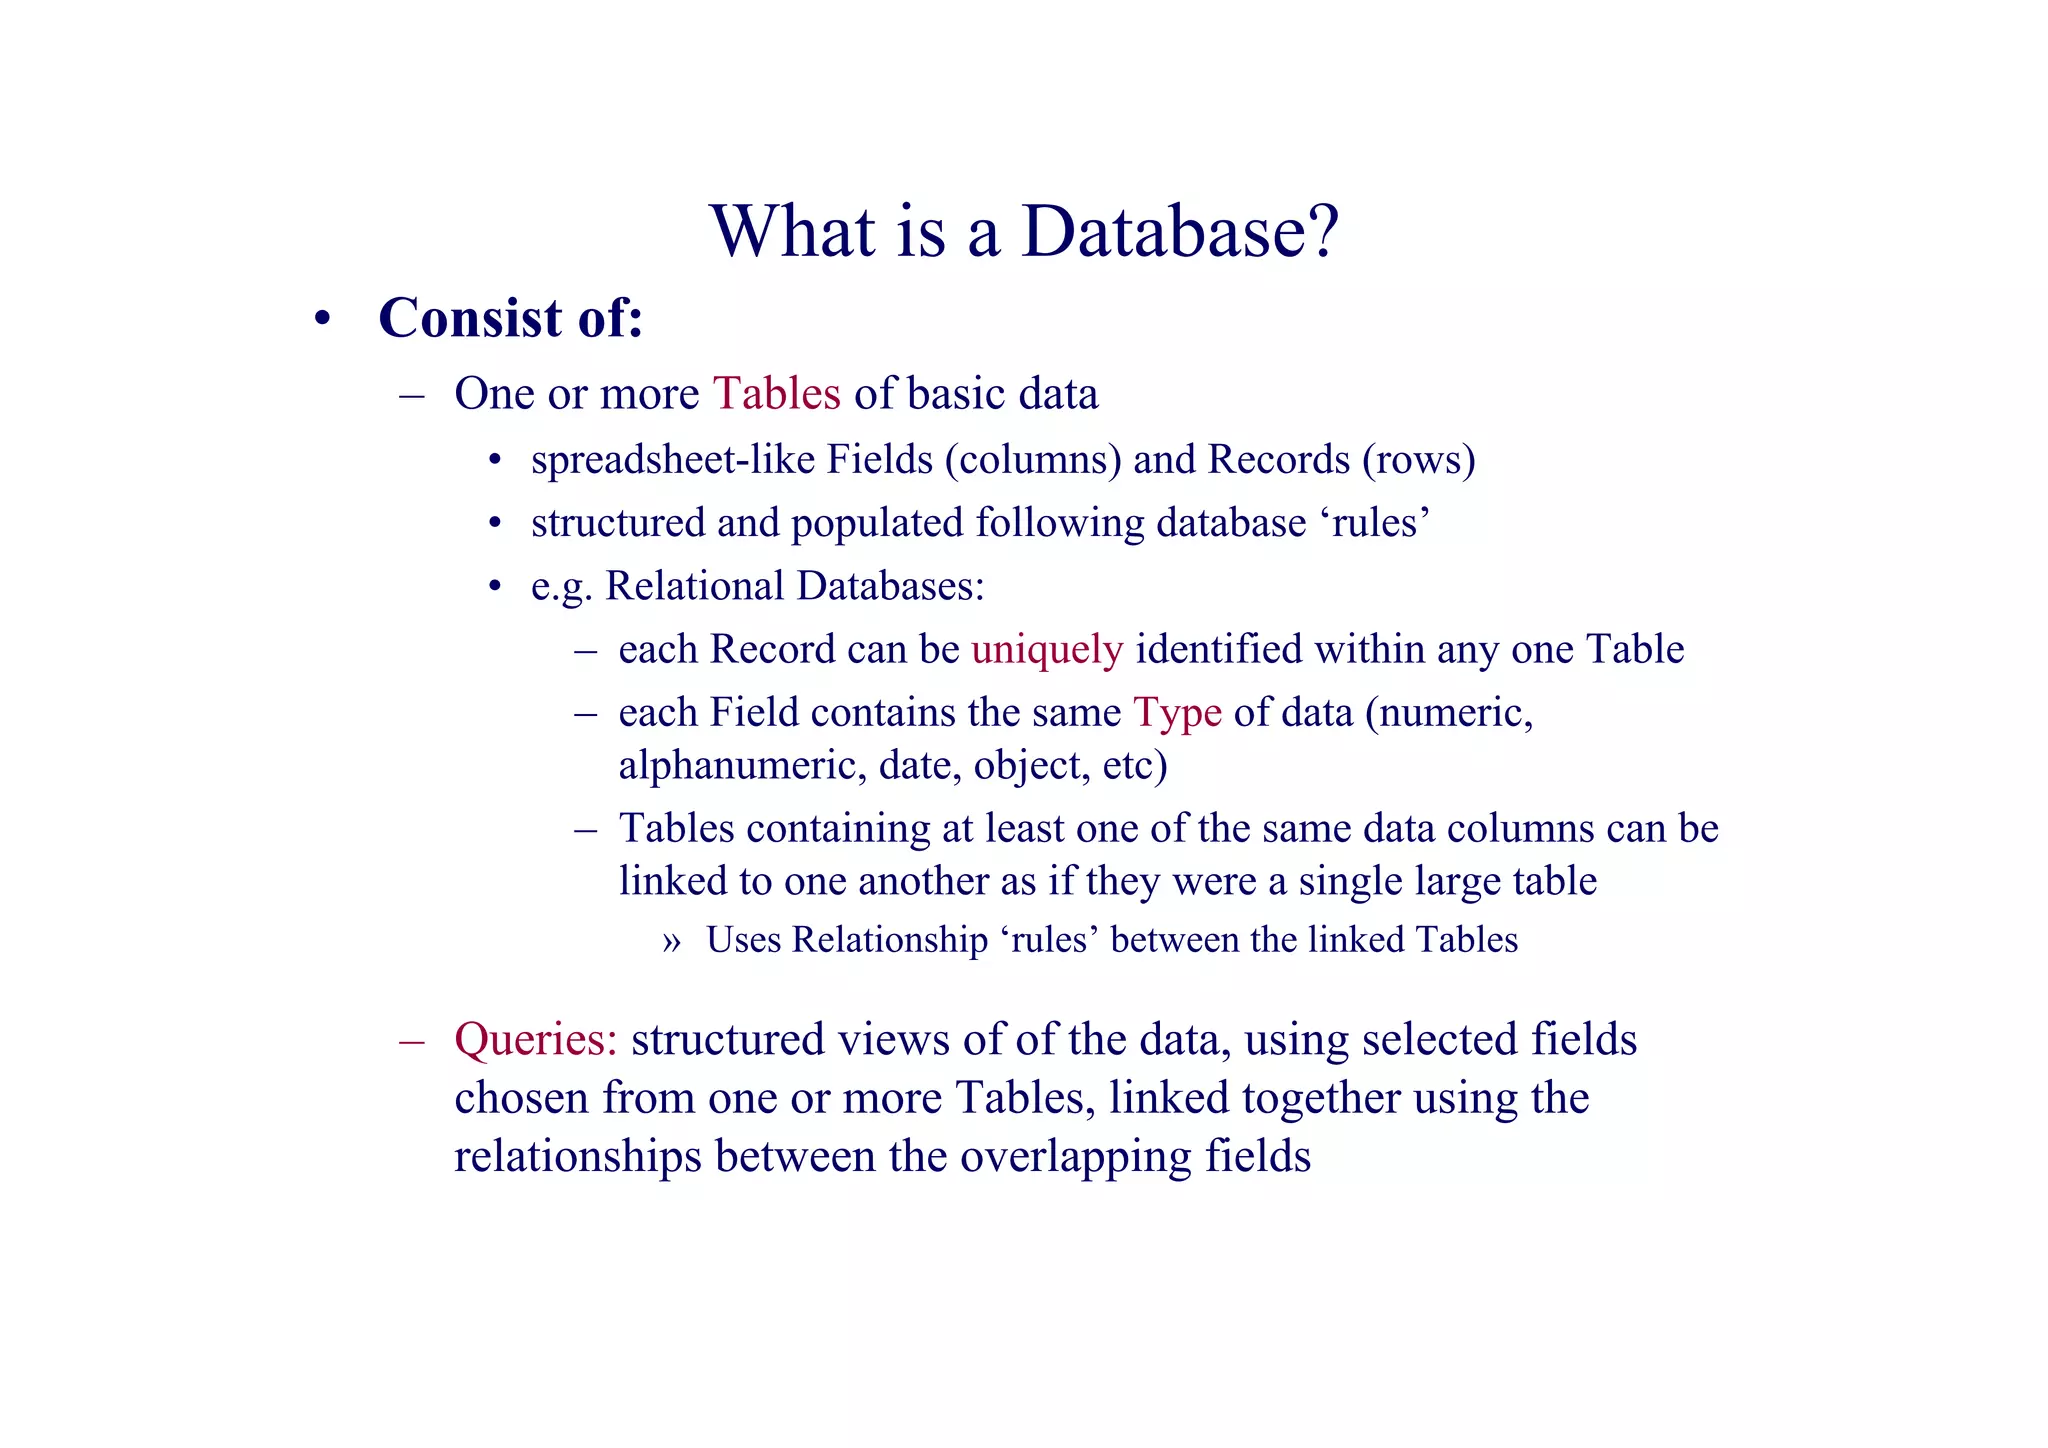
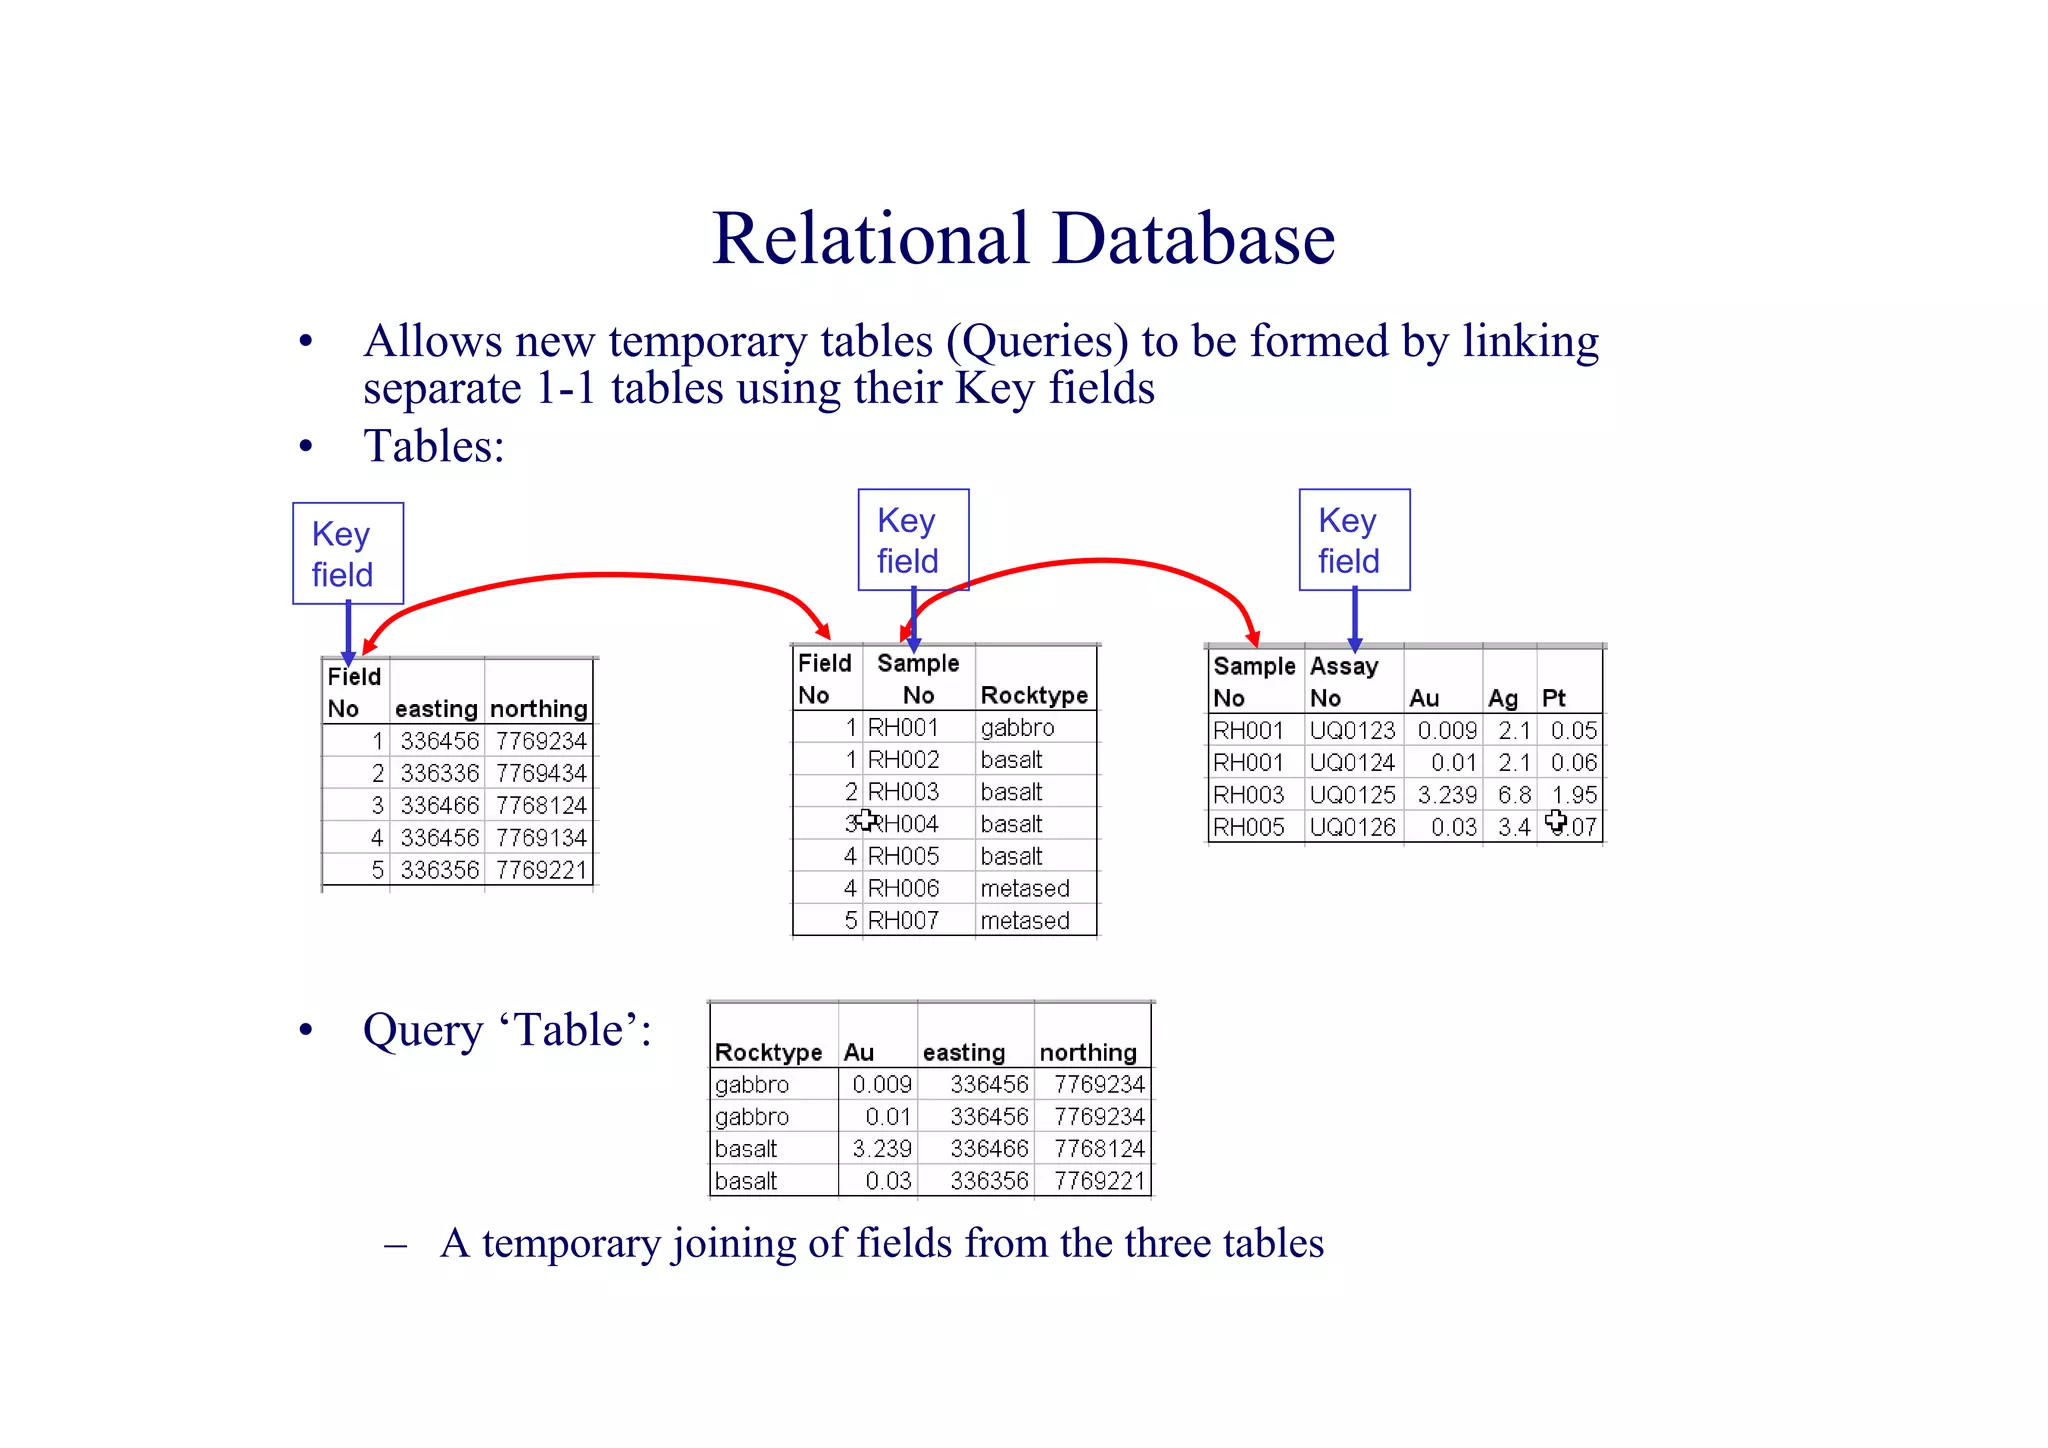
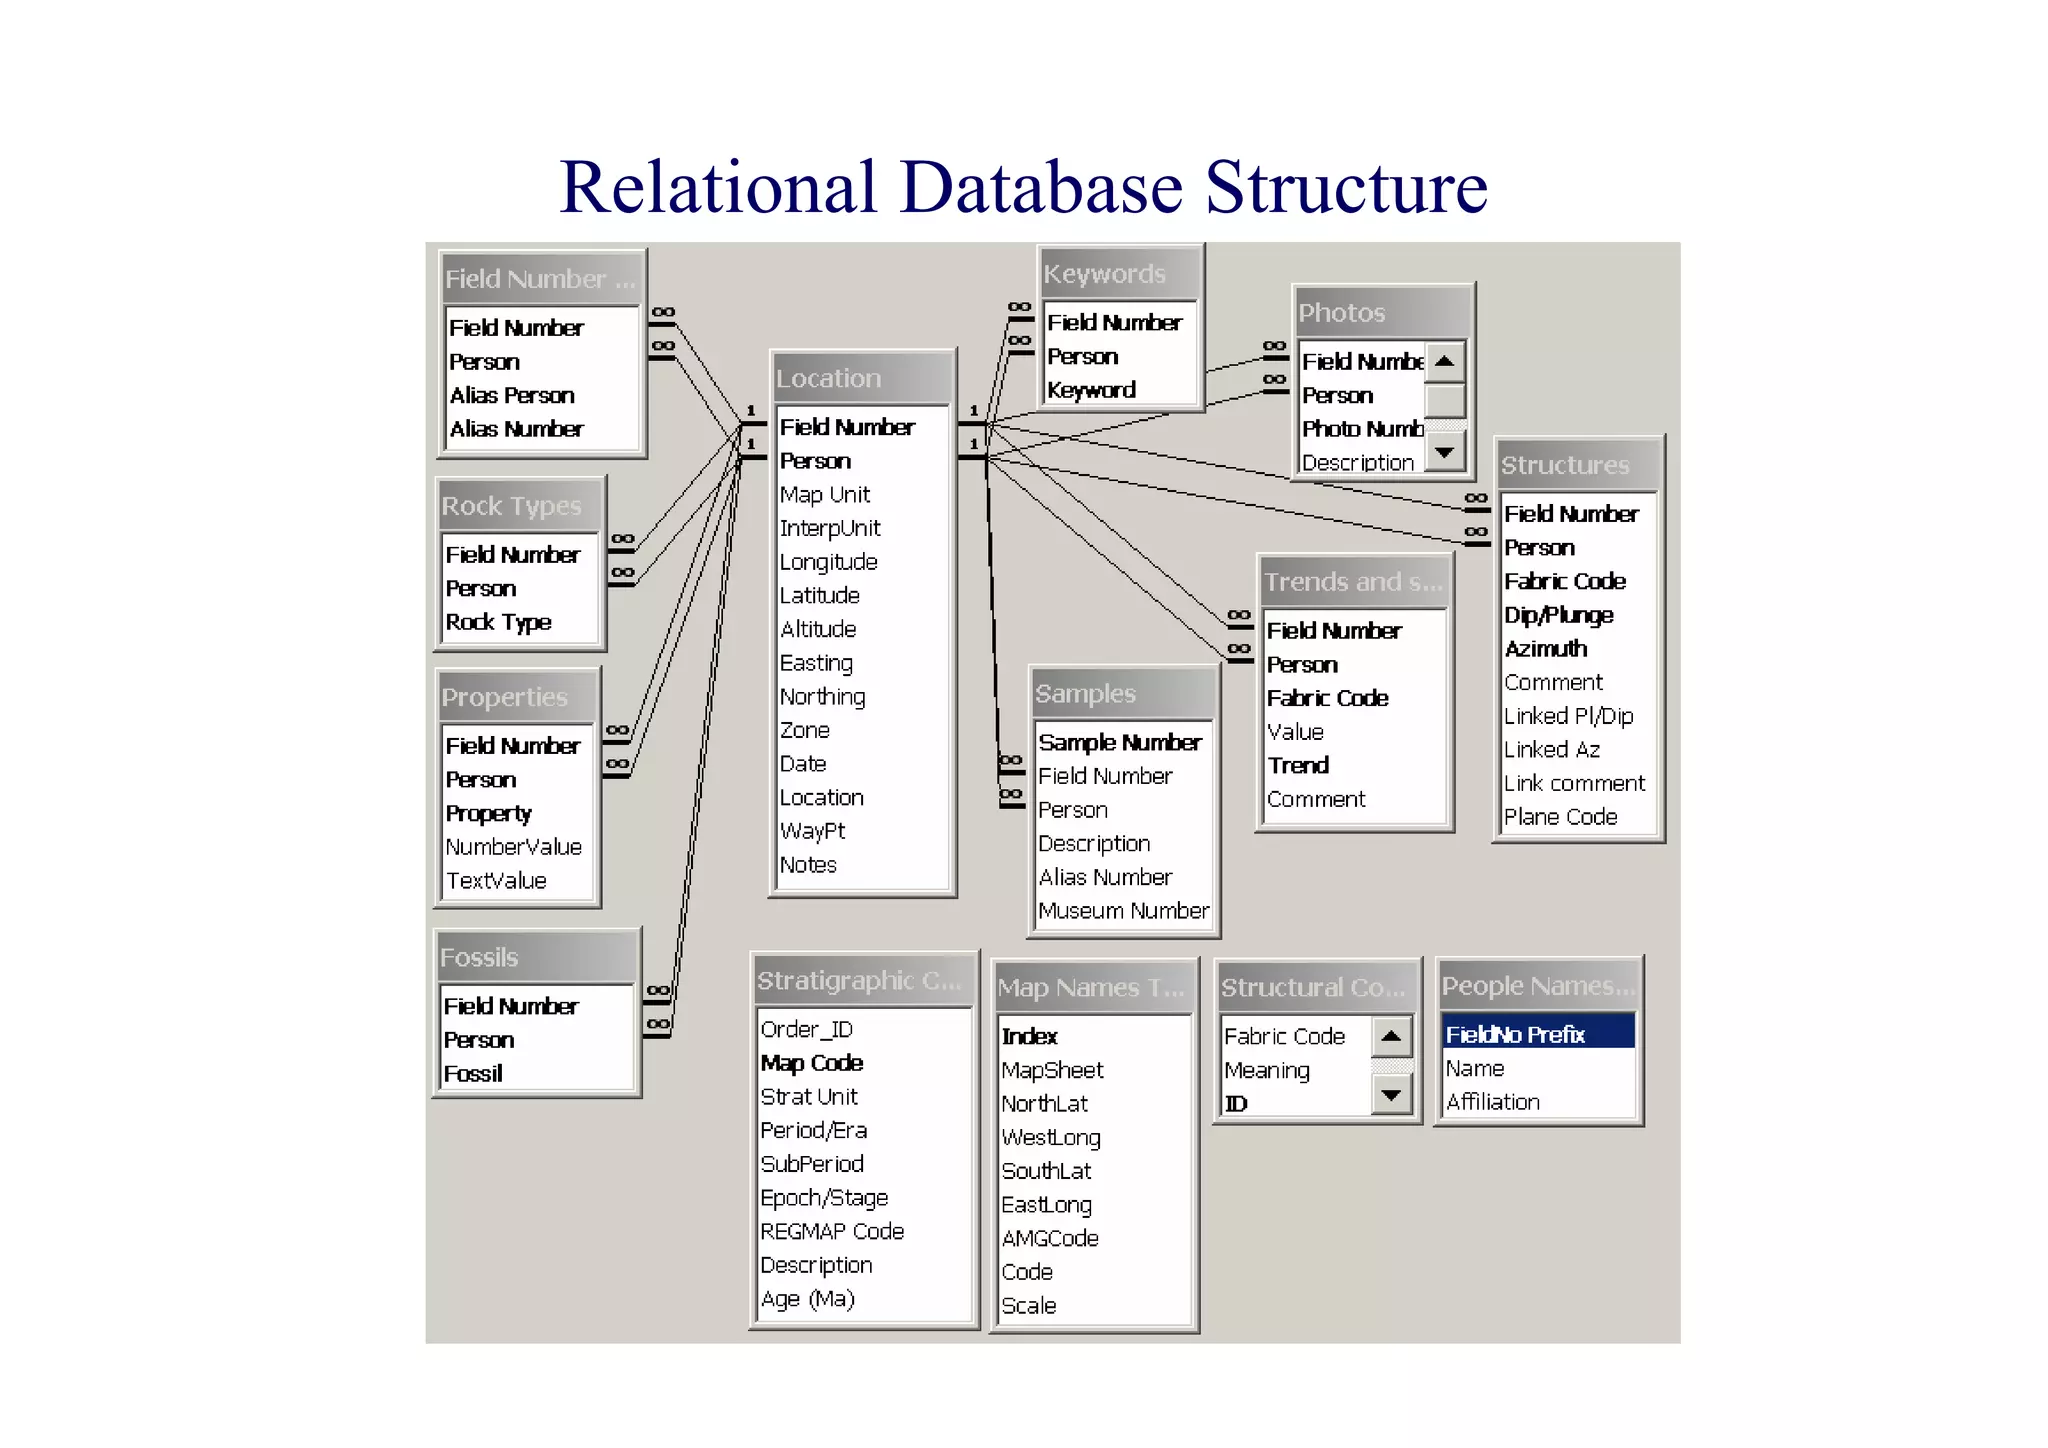
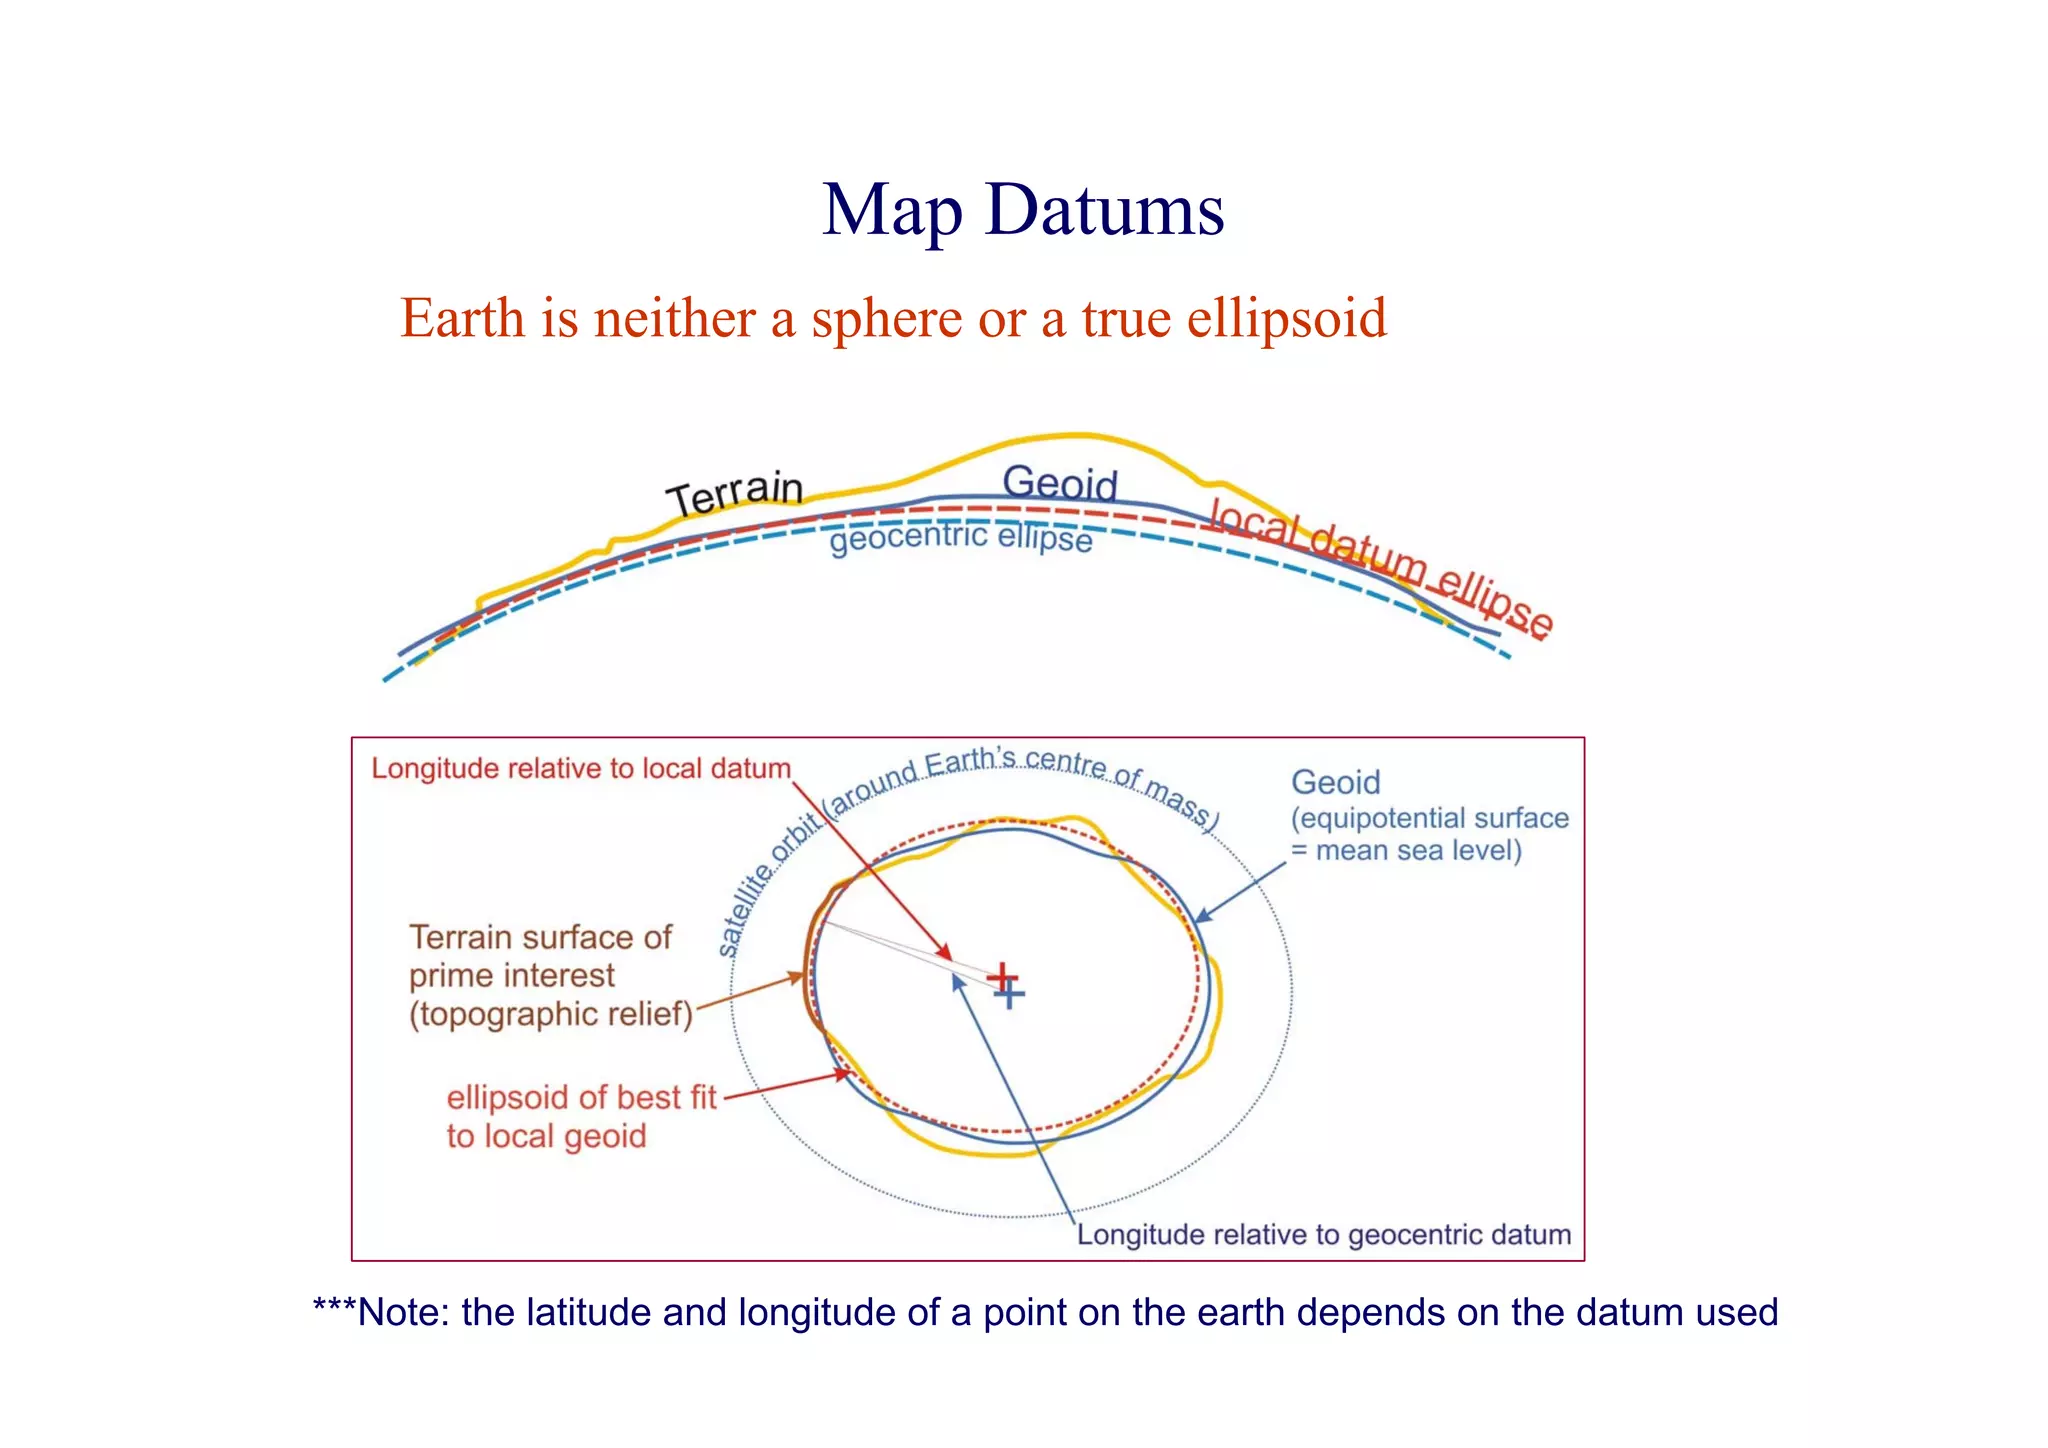
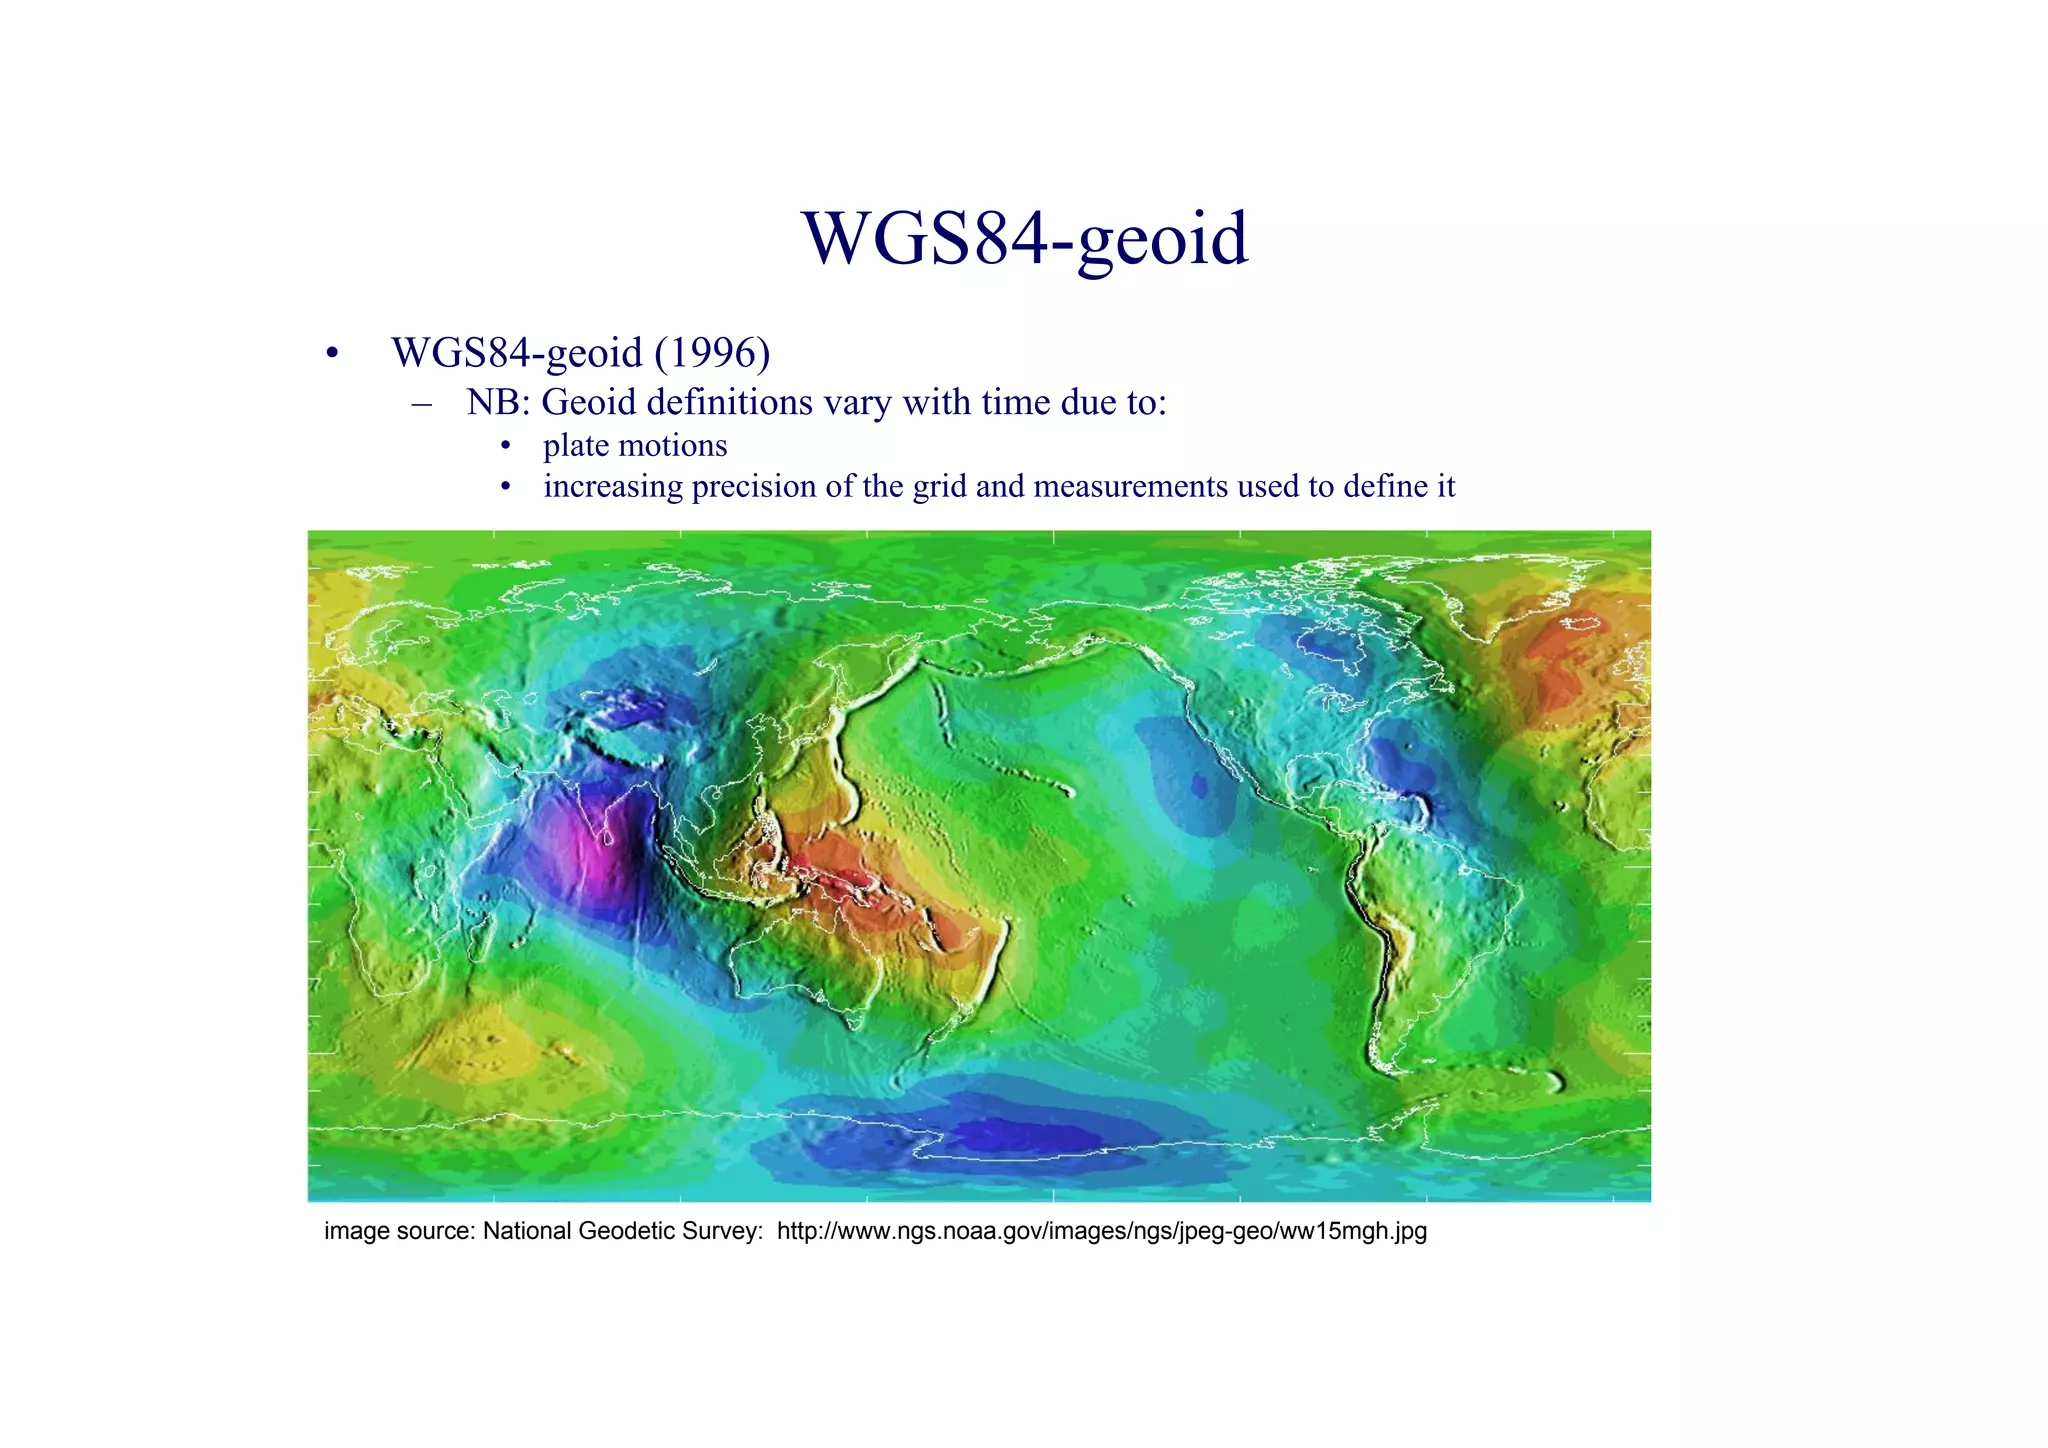
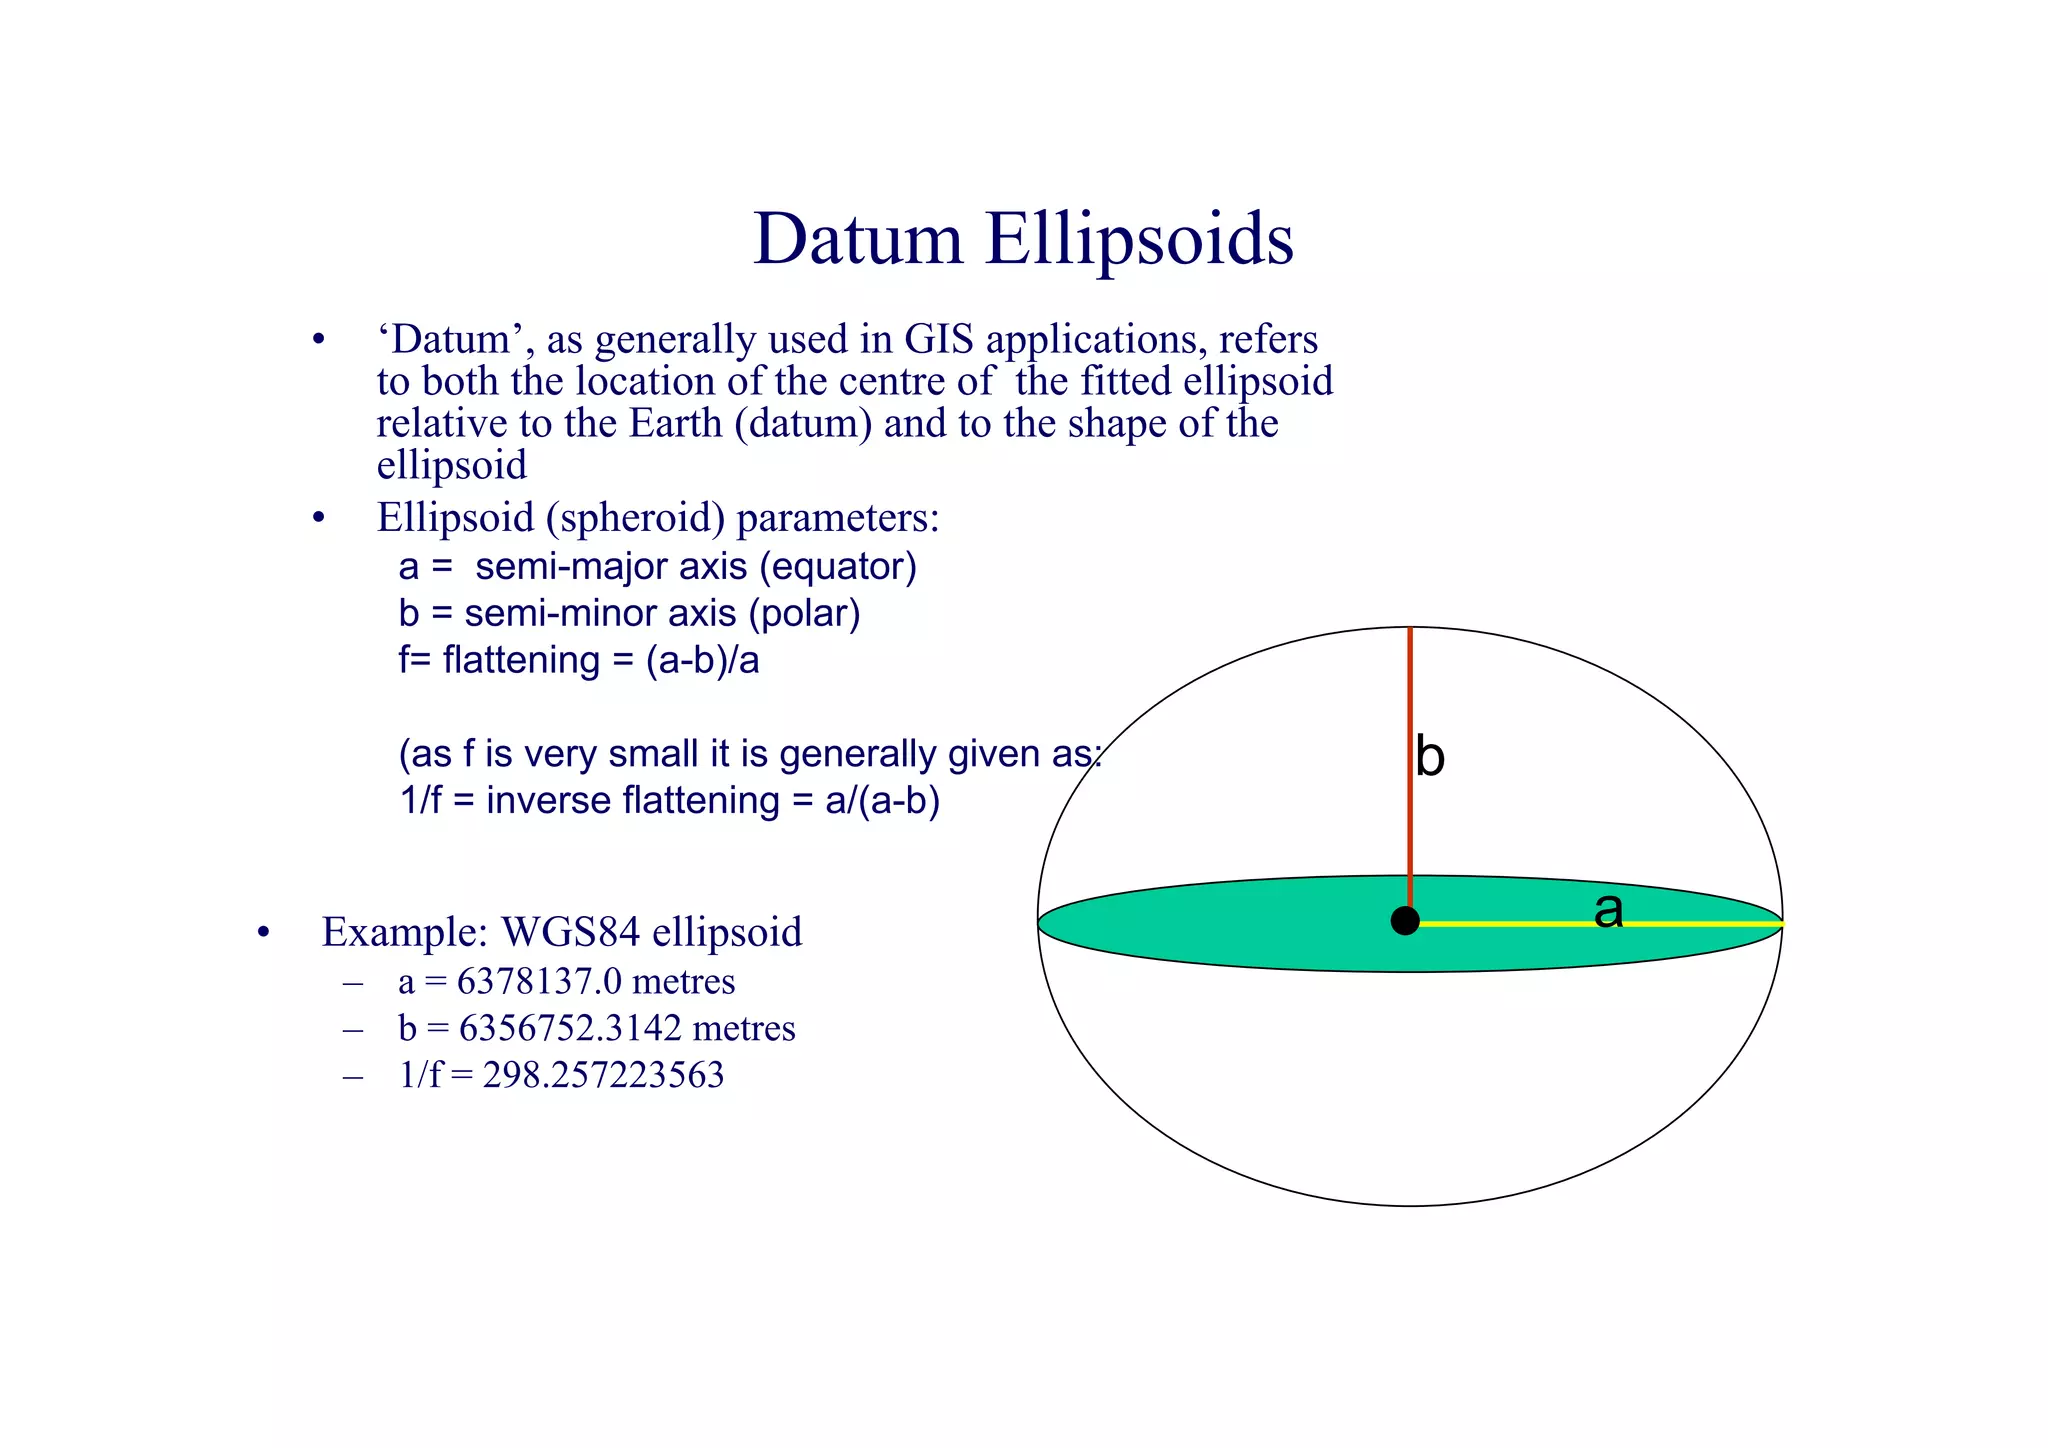
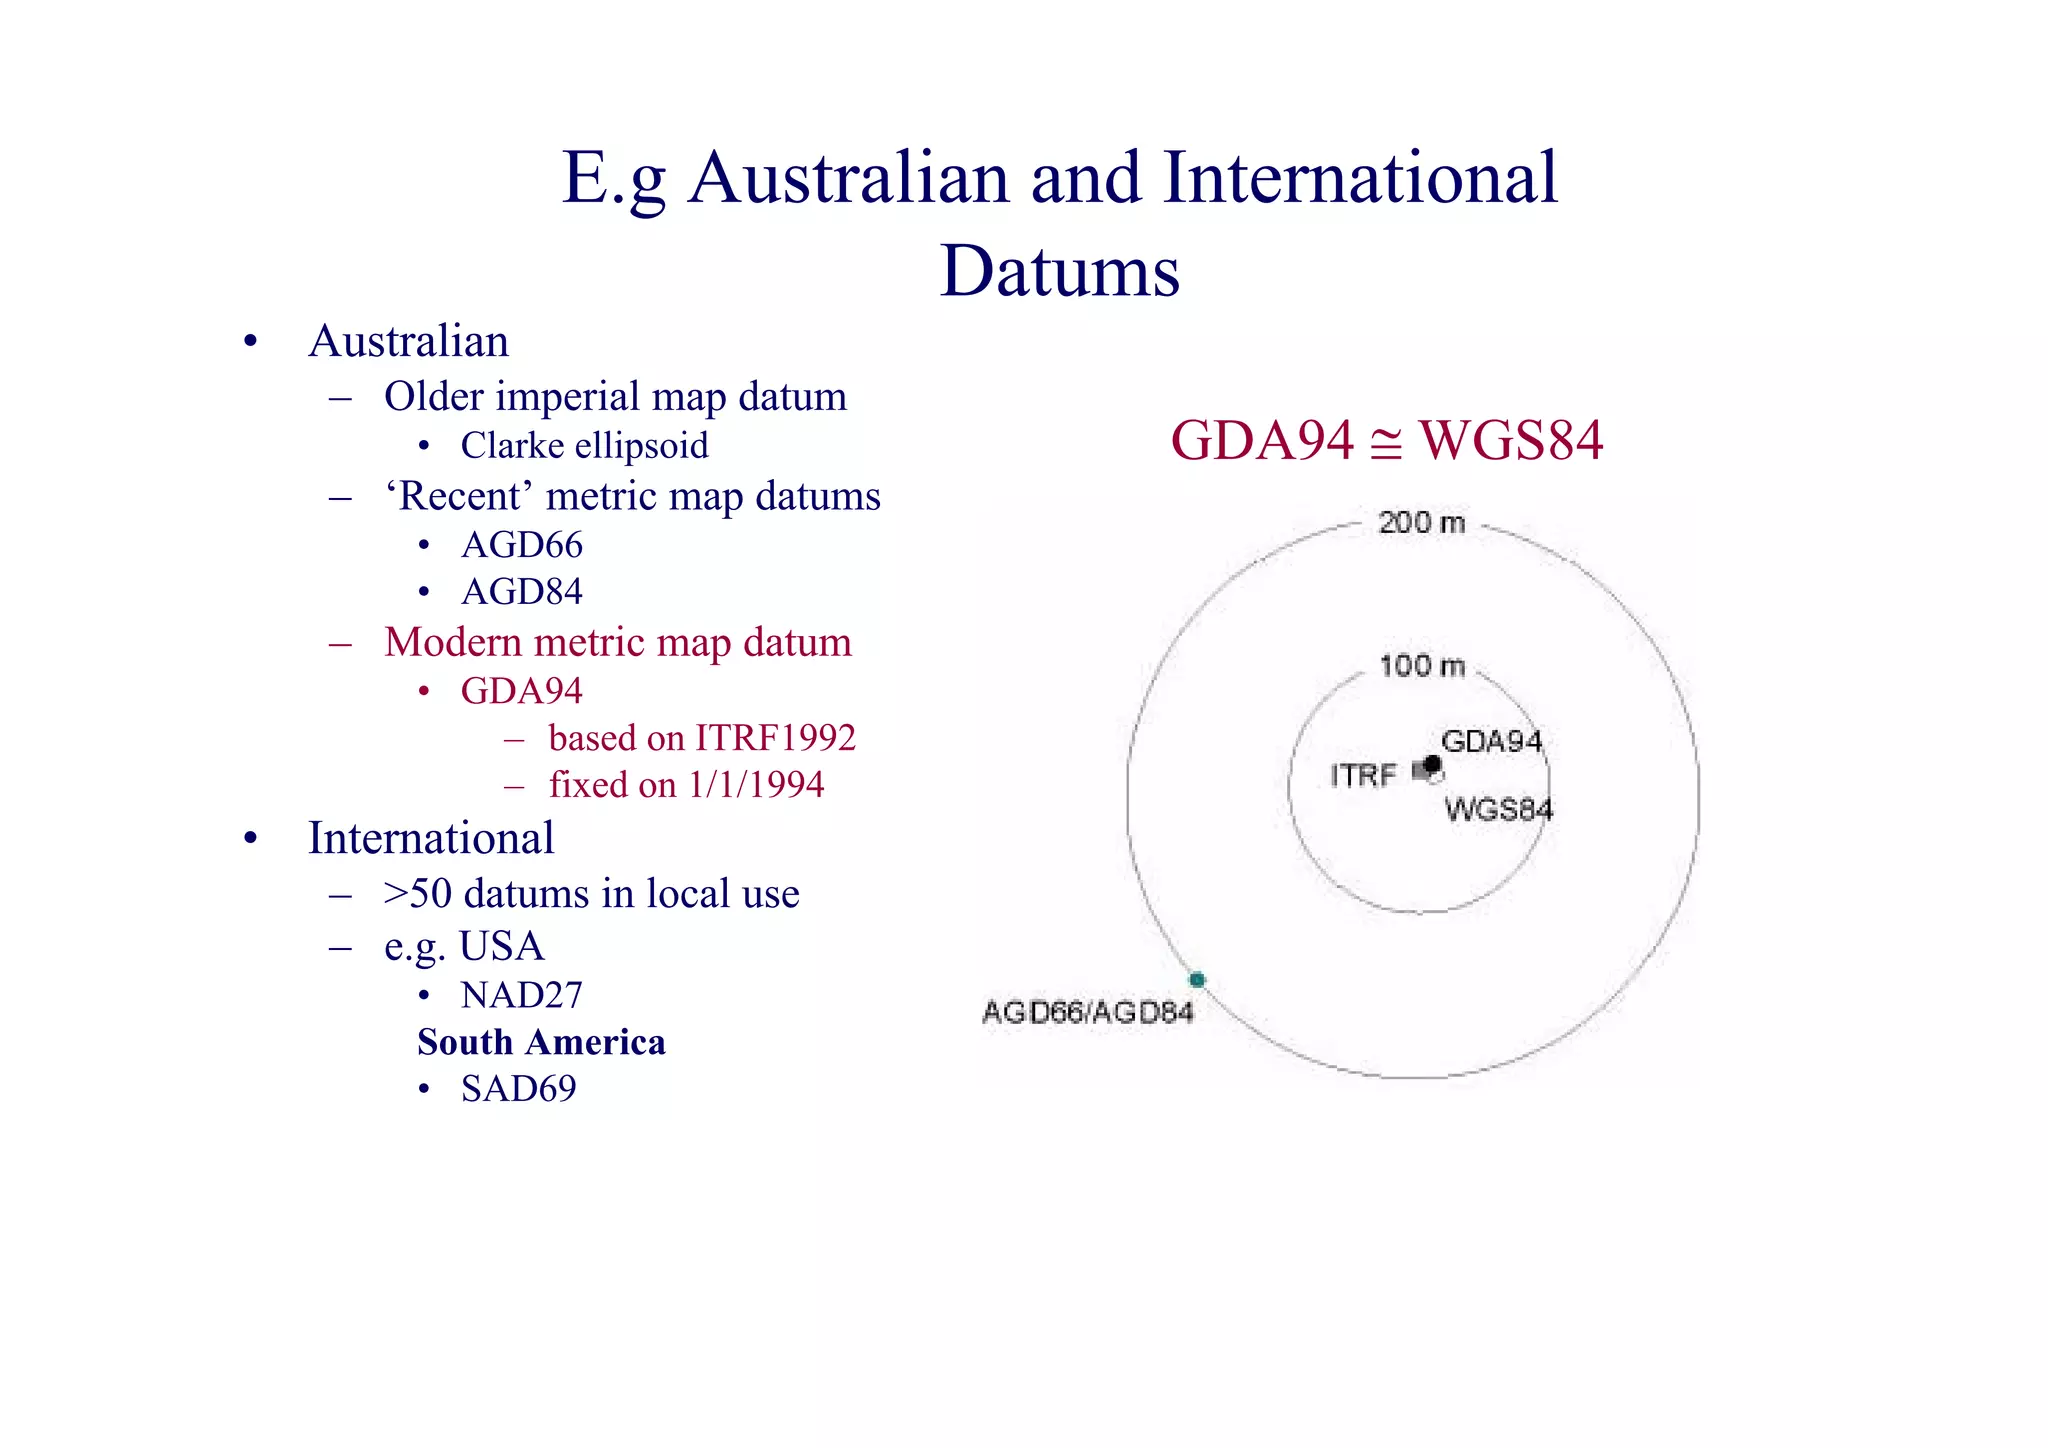
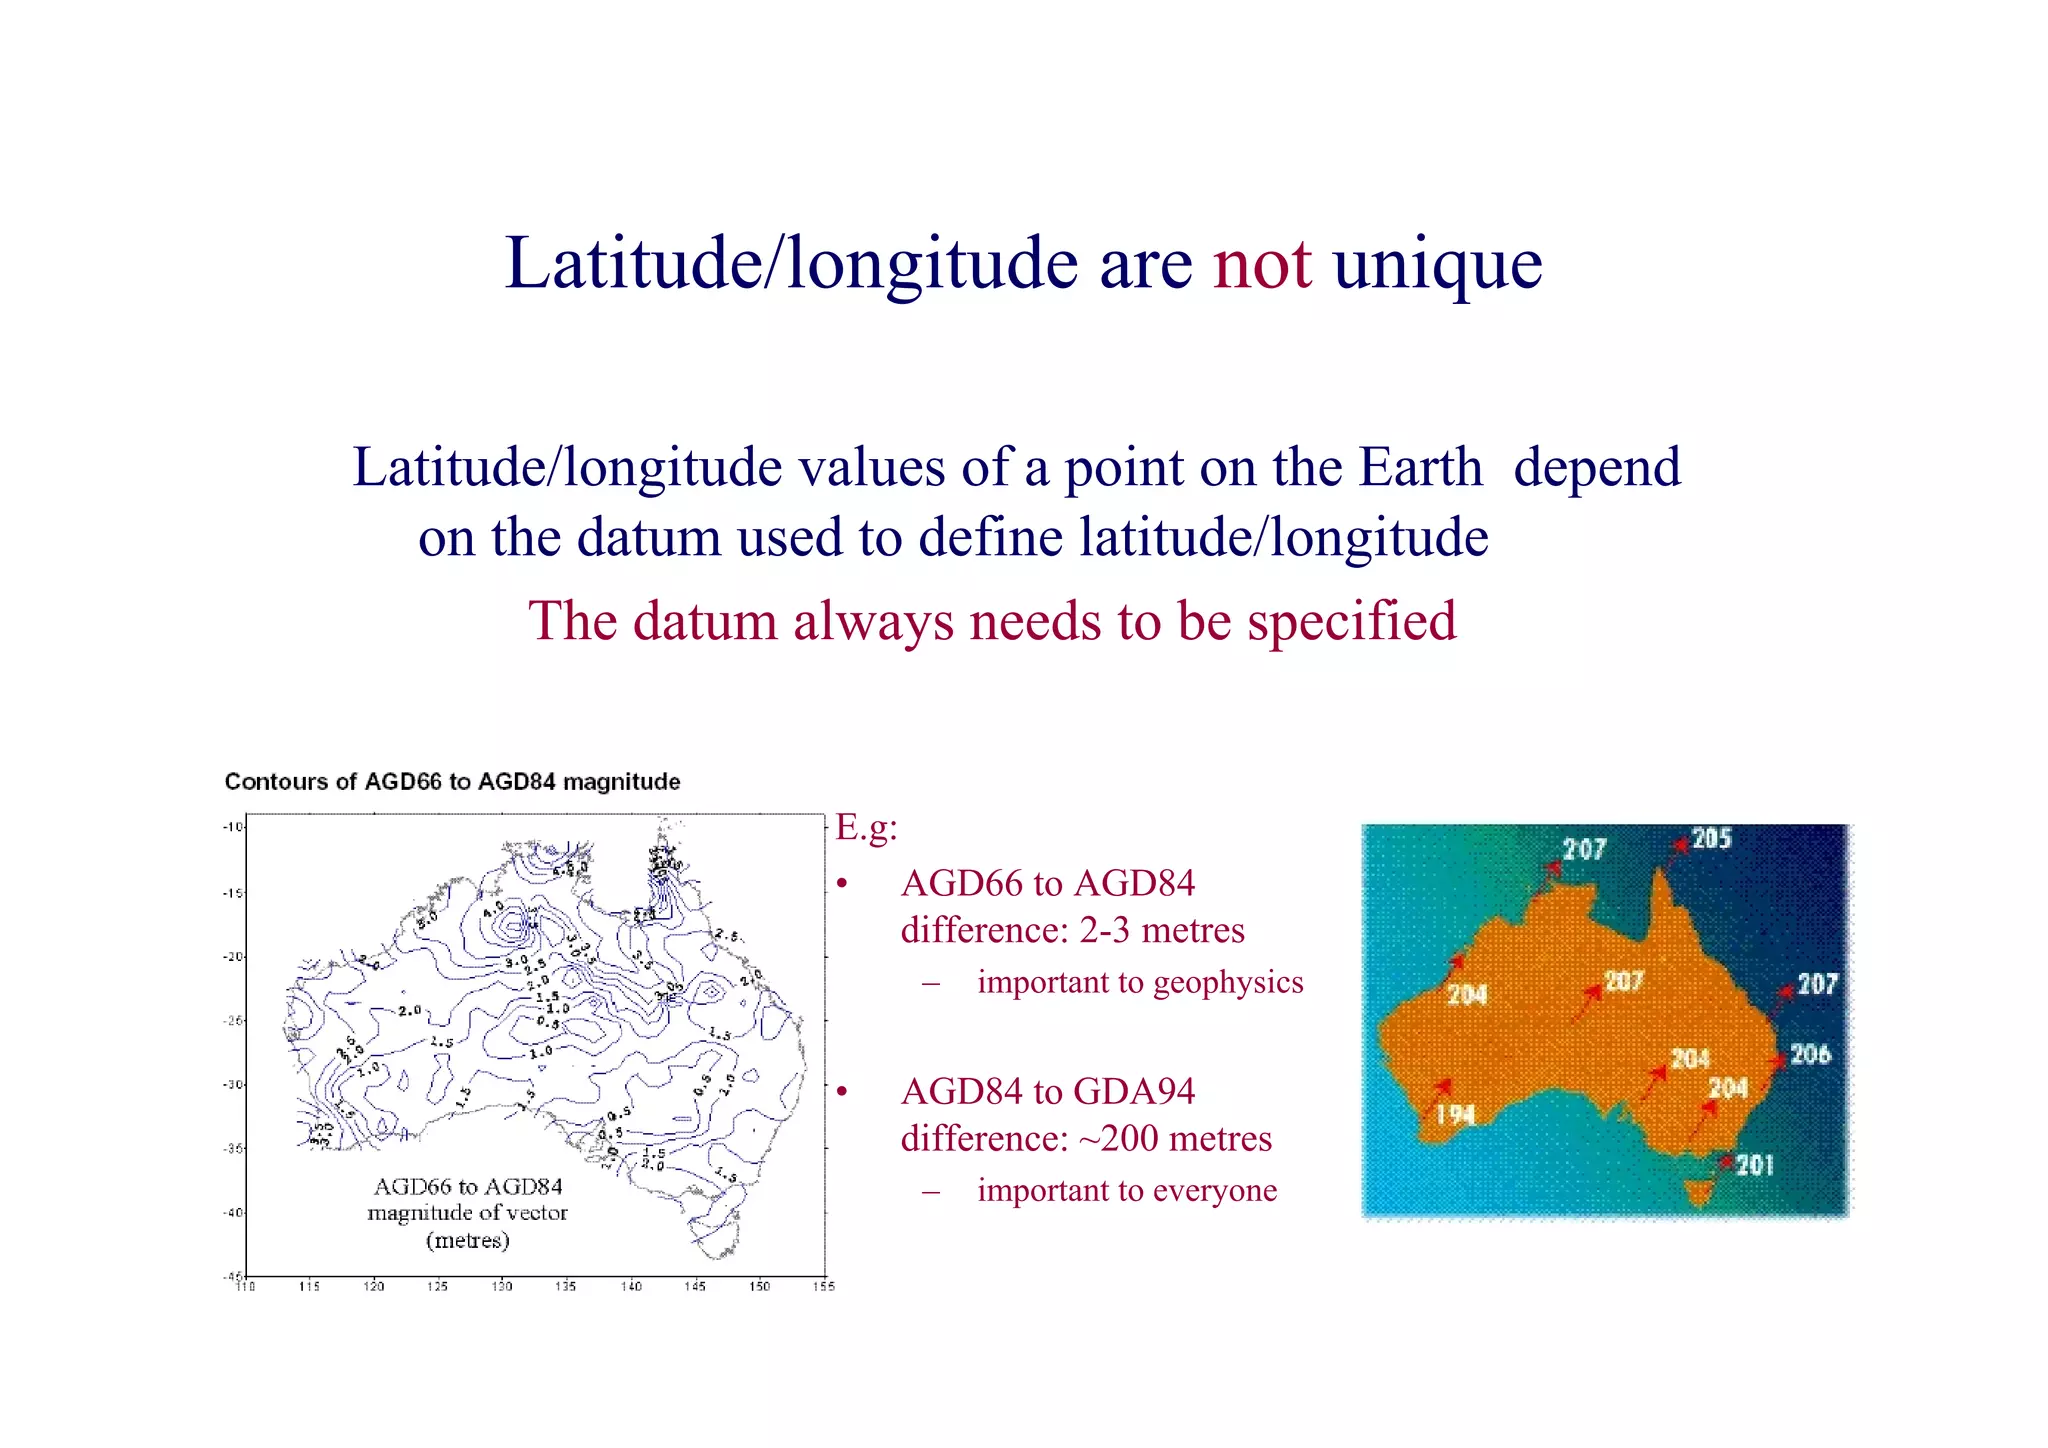
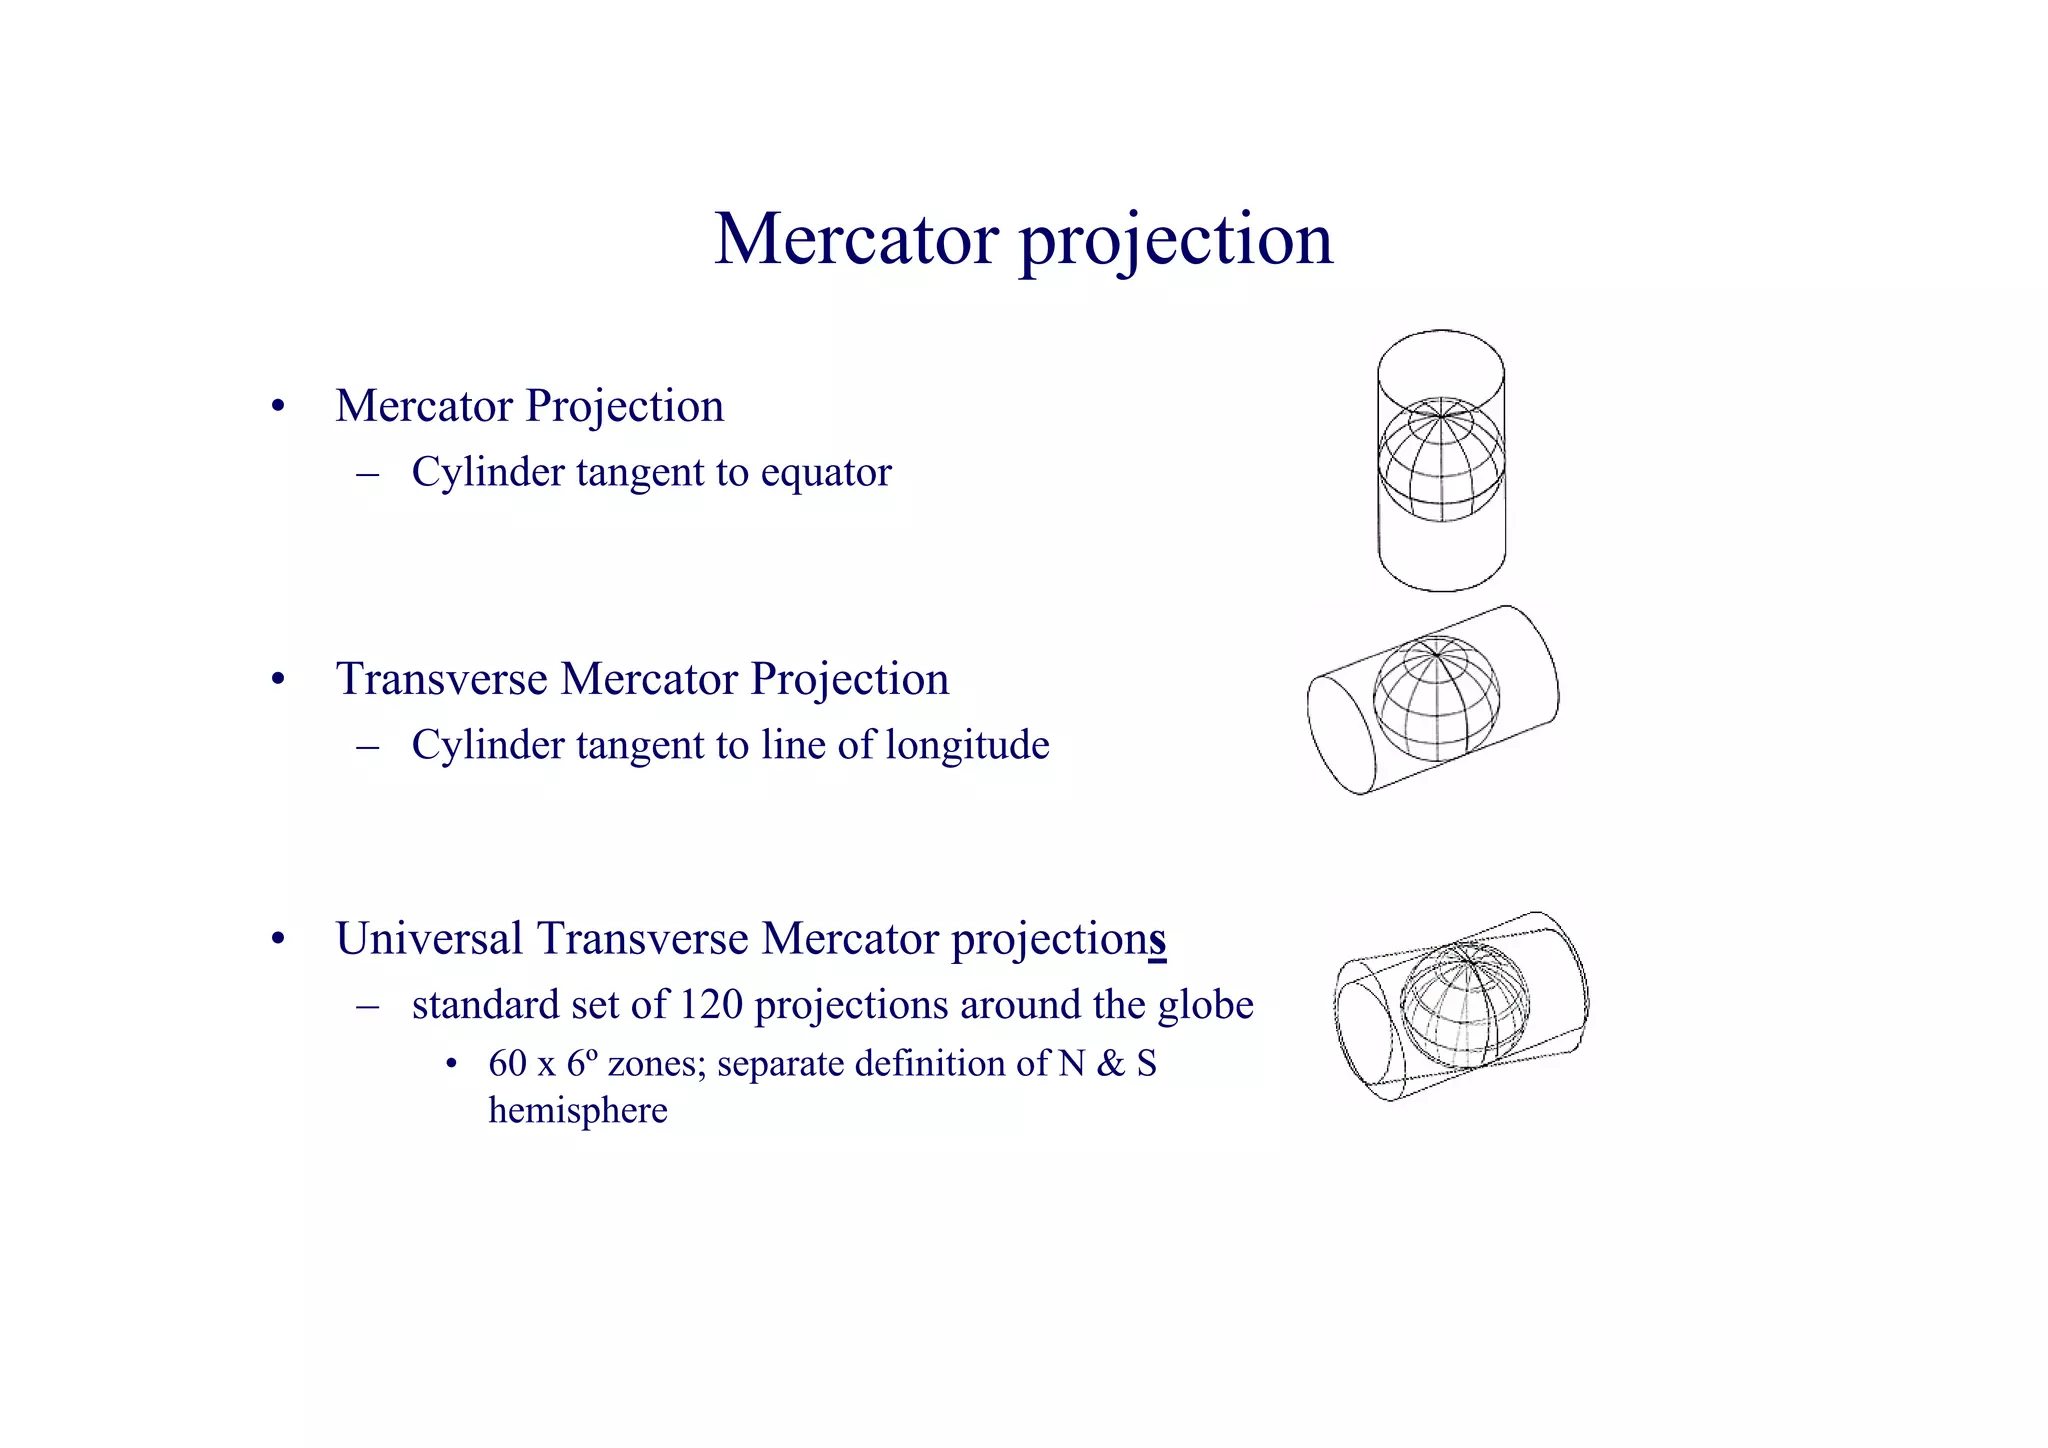

This document discusses databases and geographic information systems (GIS). It explains that a database consists of tables of structured data that follow rules and can be linked together through relationships. GIS systems use spatial databases where tables contain geographic location information in addition to other fields. Proper database design is important. The document also covers topics like map datums, projections, and how geographic coordinates can vary depending on the reference system used.