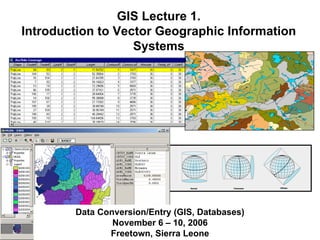
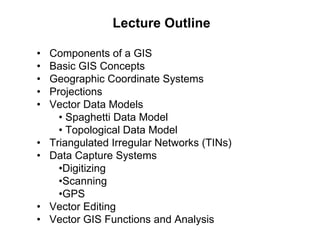
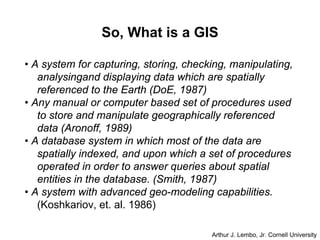
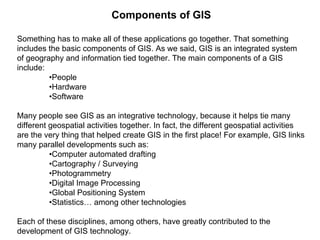
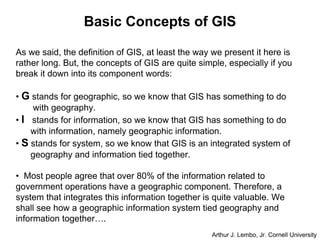
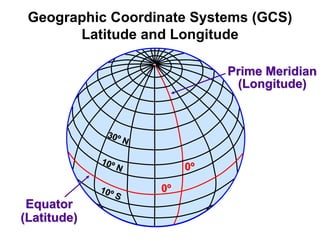
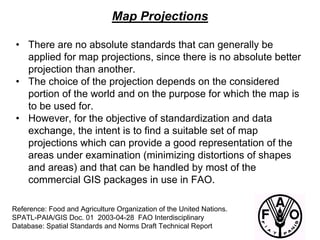
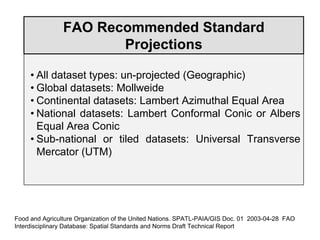
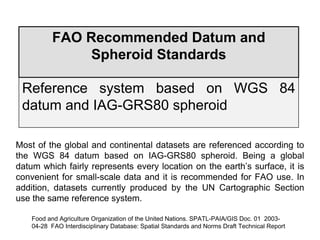
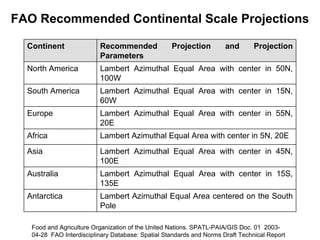
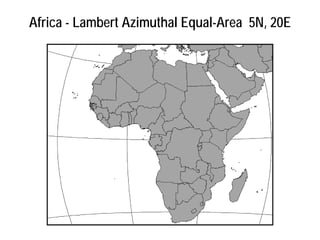
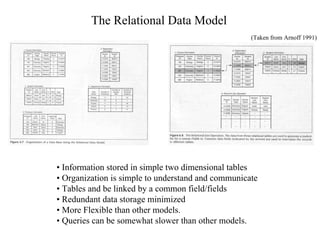
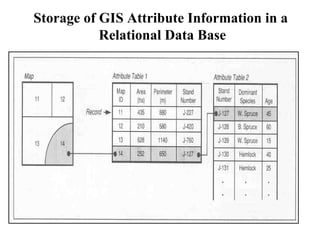
SlideShare a Scribd company logo
1 of 73
Download to read offline
GIS Lecture 1.
Introduction to Vector Geographic Information
Systems
Data Conversion/Entry (GIS, Databases)
November 6 – 10, 2006
Freetown, Sierra Leone
Lecture Outline
• Components of a GIS
• Basic GIS Concepts
• Geographic Coordinate Systems
• Projections
• Vector Data Models
• Spaghetti Data Model
• Topological Data Model
• Triangulated Irregular Networks (TINs)
• Data Capture Systems
•Digitizing
•Scanning
•GPS
• Vector Editing
• Vector GIS Functions and Analysis
So, What is a GIS
• A system for capturing, storing, checking, manipulating,
analysingand displaying data which are spatially
referenced to the Earth (DoE, 1987)
• Any manual or computer based set of procedures used
to store and manipulate geographically referenced
data (Aronoff, 1989)
• A database system in which most of the data are
spatially indexed, and upon which a set of procedures
operated in order to answer queries about spatial
entities in the database. (Smith, 1987)
• A system with advanced geo-modeling capabilities.
(Koshkariov, et. al. 1986)
Arthur J. Lembo, Jr. Cornell University
Components of GIS
Something has to make all of these applications go together. That something
includes the basic components of GIS. As we said, GIS is an integrated system
of geography and information tied together. The main components of a GIS
include:
•People
•Hardware
•Software
Many people see GIS as an integrative technology, because it helps tie many
different geospatial activities together. In fact, the different geospatial activities
are the very thing that helped create GIS in the first place! For example, GIS links
many parallel developments such as:
•Computer automated drafting
•Cartography / Surveying
•Photogrammetry
•Digital Image Processing
•Global Positioning System
•Statistics… among other technologies
Each of these disciplines, among others, have greatly contributed to the
development of GIS technology.
Why is GIS Important
• A Ubiquitous Tool
• Environmental Analysis
• Engineering Design
• Business Geographics
• Social Services
• Better Government
Basic Concepts of GIS
As we said, the definition of GIS, at least the way we present it here is
rather long. But, the concepts of GIS are quite simple, especially if you
break it down into its component words:
• G stands for geographic, so we know that GIS has something to do
with geography.
• I stands for information, so we know that GIS has something to do
with information, namely geographic information.
• S stands for system, so we know that GIS is an integrated system of
geography and information tied together.
• Most people agree that over 80% of the information related to
government operations have a geographic component. Therefore, a
system that integrates this information together is quite valuable. We
shall see how a geographic information system tied geography and
information together….
Arthur J. Lembo, Jr. Cornell University
0Âş
0Âş
0Âş
0Âş
Prime Meridian
Prime Meridian
Equator
Equator
(Longitude)
(Longitude)
(Latitude)
(Latitude)
10Âş N
10Âş N
30Âş N
30Âş N
10Âş S
10Âş S
Geographic Coordinate Systems (GCS)
Latitude and Longitude
Spheroid Semimajor
Axis (m)
Semiminor
Axis (m)
Clarke 1866 6,378,206.4 6,356,583.8
GRS1980 6,378,137.0 6,356,752.31414
WGS1984 6,378,137.0 6,356,752.31424
Spheroids and Ellipsoids
Ellipsoid
Parameters
Ellipsoid Parameters
In ILWIS
In ArcGIS
Units: Geographic Coordinates
Units:
• Degrees Minutes Seconds
• Decimal Degrees
60 minutes = 1 degree
60 seconds = 1 minute
64o 30’ 15” = decimal degrees?
Answer:
= 64 + (30/60) + (15/(60*60)) = 64.541666 DD
A Datum is Defined by
• A Spheroid
• Datum origin point
• Orientation of Geographic
Coordinate (i.e. Equator and Prime
Meridian)
A projected coordinate system is
defined on a flat, two-dimensional
surface. Unlike a geographic coordinate
system, a projected coordinate system
has constant lengths, angles, and areas
across the two dimensions. A projected
coordinate system is always based on a
geographic coordinate system that is
based on a sphere or spheroid.
Projected Coordinate Systems
Moving from 3-D to 2-D!
Understanding mapping:
error
There are six main types of distortion in mapping:
•shape
•distance
•area
•direction
•scale
•angle
Understanding mapping:
projection
Azimuthal projection
Cylindrical projection
Conic projection
Different projections have their
own characteristics and uses.
They all distort the properties of
the Earth, but do so differently.
Cylindrical surface
Earth intersects the
cylinder on two small
circles. All points along
both circles have no
scale distortion.
Mercator Projection
A Cylindrical Projection
Africa - Lambert Azimuthal Equal-Area 5N, 20E
A Conic Projection
This is the African Continental Projection Recommended by the FAO
A good reference: http://gis.esri.com/library/userconf/proc98/PROCEED/TO850/PAP844/P844.HTM#appendix%203
The Interrupted Goode Homolosine Projection (Goode's)
Combining twelve instances of the Mollweide and Sinusoidal Map Projections
Many Global
Datasets/Imagery
are made available
in this projection,
including MODIS
Imagery
UTM Projection
• Universe Transverse Mercator
• Conformal projection (shapes are
preserved)
• Cylindrical surface
• Two standard meridians
• Zones are 6 degrees of longitude wide
UTM Zones
Sierra Leone Landsat MSS Imagery
In UTM (Universal Transverse Mercator) Projection
In ArcGIS
In ILWIS
Notice the same
parameters in both
UTM Zone 28
Reference: Food and Agriculture Organization of the United Nations.
SPATL-PAIA/GIS Doc. 01 2003-04-28 FAO Interdisciplinary
Database: Spatial Standards and Norms Draft Technical Report
Map Projections
• There are no absolute standards that can generally be
applied for map projections, since there is no absolute better
projection than another.
• The choice of the projection depends on the considered
portion of the world and on the purpose for which the map is
to be used for.
• However, for the objective of standardization and data
exchange, the intent is to find a suitable set of map
projections which can provide a good representation of the
areas under examination (minimizing distortions of shapes
and areas) and that can be handled by most of the
commercial GIS packages in use in FAO.
FAO Recommended Standard
Projections
• All dataset types: un-projected (Geographic)
• Global datasets: Mollweide
• Continental datasets: Lambert Azimuthal Equal Area
• National datasets: Lambert Conformal Conic or Albers
Equal Area Conic
• Sub-national or tiled datasets: Universal Transverse
Mercator (UTM)
Food and Agriculture Organization of the United Nations. SPATL-PAIA/GIS Doc. 01 2003-04-28 FAO
Interdisciplinary Database: Spatial Standards and Norms Draft Technical Report
FAO Recommended Datum and
Spheroid Standards
Reference system based on WGS 84
datum and IAG-GRS80 spheroid
Most of the global and continental datasets are referenced according to
the WGS 84 datum based on IAG-GRS80 spheroid. Being a global
datum which fairly represents every location on the earth’s surface, it is
convenient for small-scale data and it is recommended for FAO use. In
addition, datasets currently produced by the UN Cartographic Section
use the same reference system.
Food and Agriculture Organization of the United Nations. SPATL-PAIA/GIS Doc. 01 2003-
04-28 FAO Interdisciplinary Database: Spatial Standards and Norms Draft Technical Report
Continent Recommended Projection and Projection
Parameters
North America Lambert Azimuthal Equal Area with center in 50N,
100W
South America Lambert Azimuthal Equal Area with center in 15N,
60W
Europe Lambert Azimuthal Equal Area with center in 55N,
20E
Africa Lambert Azimuthal Equal Area with center in 5N, 20E
Asia Lambert Azimuthal Equal Area with center in 45N,
100E
Australia Lambert Azimuthal Equal Area with center in 15S,
135E
Antarctica Lambert Azimuthal Equal Area centered on the South
Pole
FAO Recommended Continental Scale Projections
Food and Agriculture Organization of the United Nations. SPATL-PAIA/GIS Doc. 01 2003-
04-28 FAO Interdisciplinary Database: Spatial Standards and Norms Draft Technical Report
Africa - Lambert Azimuthal Equal-Area 5N, 20E
Antarctica - Lambert Azimuthal Equal-Area 90S, 0E
Vector GIS Data Models
• Relational Databases
•Vector Data Models
• Spaghetti Data Model
• Topological Data Model
(Taken from Arnoff 1991)
The Relational Data Model
• Information stored in simple two dimensional tables
• Organization is simple to understand and communicate
• Tables and be linked by a common field/fields
• Redundant data storage minimized
• More Flexible than other models.
• Queries can be somewhat slower than other models.
Storage of GIS Attribute Information in a
Relational Data Base
The Spaghetti Data Model
• A point is encoded as a single XY coordinate
pair. A line is encoded as string of XY coordinate
pairs. An area is represented a polygon and is
recorded as a closed loop of XY coordinates that
define its boundary.
•Essentially a collection of coordinate strings with
no inherent structure - hence the term spaghetti
model.
• Model is very simple and easy to understand. The
spatial relationship between features is not encoded.
•This model is very inefficient for most types of
spatial analyses, since any spatial relationship must
be derived from computation.
(Taken from Arnoff 1991)
• Advantages:
- the Spaghetti data model is very simple
and easy to understand.
• Disadvantages:
- lines between adjacent areas must be digitized twice.
- the spatial relationships between features are not retained.
- this model is very inefficient for most types of spatial analyses
(since any spatial relationship must be derived from computation).
The Spaghetti Data Model
The Topological Data Model
(Taken from Arnoff 1991)
Webster’s Dictionary
Definition of Topology: A
branch of mathematics
concerned with those
properties of geometric
configuration.
• Note: Polygons can have
islands within them. Polygon
C is an island within polygon
B. This is indicated in ARCS
listed for polygon B by a zero
proceeding the list of arcs.
• Most widely used method of encoding spatial relationships in a GIS
(eg. ArcInfo).
• From the topology alone (ie the three topology tables), analysis of the
relative position of the map elements can be done.
• Since all spatial relationships are explicitly defined in the topology
tables (eg. Connectivity and Contiguity) spatial queries using the
topology tables can be processed very quickly. Example. Find all
features within Polygon B.
• To do spatial queries in non-topological GISs (such as ArcView) is
much more computer intensive and requires the use of the coordinate
data.
Topological Data Model
• Advantages:
- spatial relations are retained
- from the topology alone analysis of the relative position
of the map elements can be done
- spatial queries using the topology tables can be processed
very quickly
• Disadvantages:
- more complex data structure
- map updating requires updating topology
The Topological Data Model
Comparison of the Topological vs. Non-topological
A – As you would expect in ArcView 3.* (non topological
B – As you would expect in ArcInfo Workstation (topological)
A)
B)
Compare these tables to the
note:
Fnode# = Start Node
Tnode# = End Node
Lpoly# = Left Polygon
Rpoly# = Right Polygon
Triangled Irregular Networks (TINs)
• A TIN is a vector-based topological data model. A TIN represents the
surface as a set of interconnected triangular facets. For each of the three
vertices, the XY coordinate (geographic location) and the Z coordinate
(elevation or other) values are encoded.
• The coordinate data and topology for the TIN are stored in a set of
tables
• TINs are irregularly spaced such that they are dense in areas of rapidly
changing terrain and sparse in areas of relatively flat terrain.
• In the TIN, each triangle forms a plane from which the terrain
parameters of slope and slope aspect can be calculated and stored as
attributes.
• The generated surface passes through all the data points (exact
Interpolator)
A Comparison of Raster, Vector and TIN Data Structures
For Representing Elevation
Topological Data Structure of a Triangled Irregular
Network
Topographic Map and the Corresponding TIN
Representation
Topographic Map TIN Representation
X - axis
Y
-
axis
42
35
32
28
26
X Y Z
1 1 26
2 3 28
4 3 32
3 5 42
5 4 35
3 4 ?
Triangled Irregular Networks (TINs)
The elevation at any point on the surface
can be calculated. All that is required is the
x,y and z coordinates of triangle it is
within.
Z = a + bx + cy - where a,b and c are
constants.
For the example to the left
42 = a + 3b +5c
32 = a + 4b +2c
28 = a +2b +3c
From which: z = 4.8 + 4.4x + 4.8y
and substituting coordinates (3,4) z = 37.2
Advantages of TINs
STORAGE: TINs are an efficient storage model. Because the size of
each facet is variable, smaller triangles and therefore a more detailed
representation can be provided where there is a high density of data
points.
FEATURE DEFINITION: Break-point features in the terrain, such as
ridge lines, faults, valley bottoms, streams can be accurately encoded by
using a higher density of elevation points. As a result, these features can
be precisely encoded in a TIN. In a grid representation these same
features may be smoothed.
Although there are many advantages to representing data in a TIN, they
are commonly translated to the raster model. This is largely due, that
once in this format it is currently easier to model and the data can be
easily integrated with other image data, such as remote sensing imagery.
What is Digitizing?
• The most common method of
converting existing maps into
digital format.
• Secure source map to digitizing
tablet.
• Select and record control points.
• Trace over the map with cursor.
• Crosshairs on cursor must line up
exactly with the features you are
digitizing.
• The digitizer records coordinates
as x and y tablet coordinates and
then transforms them to the map
coordinate system.
• Edit and correct the data.
Cursor
Digitizing tablet
Data Capture by Scanning
Because the computer allows us to zoom far into images we can
work with the mouse and scanned image to allow much greater
accuracy than is possible with a digitizing tablet. Scanners are
much less expensive than digitizers, are much more accurate. Most
people are familiar with scanners, as they can be purchased rather
cheaply in office supply stores. However, the
scanners you are most familiar with probably
only copy legal size paper. For mapping
purposes, scanners have to be much larger,
with the ability to accommodate sheet sizes
greater than 34”, as shown here. These
devices allow a user to scan a map in the
computer and perform digitizing on the
computer screen (this is called “heads-up”
digitizing), thus eliminating the need for
a digitizing tablet.
Field Data Collection Directly with Hand Held
GPS enabled Devices
Captured coordinates and attributes can be entered
directly into a GIS
Geometric Correction
Note this is the same process you use to:
• Register your digitizing table to your
selected Coordinate System.
• Register your raw Satellite or Airborne
Raster Imagery to your selected
Coordinate System
• Register your Scanned Map to your
selected Coordinate System.
Geometric Correction
Moving from Local Coordinates to Easting and Northing
Raw Image
Corrected Image
c
r
n
n’
e
e’
c’
r’
e’=f(c,r)
n’=f(c,r)
X1=ao + a1x + a2y + a3xy + a4x2 + a5y2 + a6x2y + a7xy2 + a8x3 + a9y3
1st order
2nd order
3rd order
Y1=bo + b1x + b2y + b3xy + b4x2 + b5y2 + b6x2y + b7xy2 + b8x3 + b9y3
1st order
2nd order
3rd order
POLYNOMIAL EQUATIONS FOR X1, Y1
Notes:
• Where X1,Y1 are the coordinates in the uncorrected image generated from
the corrected matrix system x,y coordinates.
• a and b are constants.
Source: PCI Manual
The Vector Editing Environment in ArcGIS
The Vector Editing Environment in ILWIS
Vector GIS
Functions and Analysis
Vector GIS Functions and Analysis in ILWIS
A couple of the Vector Tools in ArcGIS – Buffer Wizard
and the GeoProcessing Wizard
NETWORK FUNCTIONS
• A Network is a set of interconnected linear
features that form a pattern or framework
(e.g.. Streams, Roads etc.).
• Network Analysis requires a networked and
topologically structured vector data layer.
• Networks are commonly used for moving
resources from one location to another.
Example of a Stream Network Query
Extract all Second-Order Streams (Red)
And then Extract Associated Second-Order Catchments
Red Vectors Indicating Strahler Second-Order Streams
Network Analysis
Network Analysis usually involve four components:
• A set of resources (such as goods to be delivered);
• One or more locations where the resources are located (such as
the warehouse where the goods are stored);
• An objective. To deliver the resources to a set of destinations -
or to provide a minimum level of service (such as a police
station);
• A set of constraints that places limits on how the objectives can
be met (such as a maximum speed, one-way street etc.).
A GIS is used to perform three
principal types of Network analysis:
• Prediction of Network loading
• Route Optimization
• Resource Allocation
Route Optimization
Examples:
1) Emergency routing of ambulances, fire, police vehicles
2) Airline Scheduling
3) Routing of Bus Services, Mail Serives etc.
Resource Allocation
Examples:
1) Division of a metropolitan area into zones that
can be effectively serviced by individual police
and fire stations.
2) Where geographically to add additional
ambulance stations to increase overall objectives.
NETWORK ANALYSIS
• Network Analysis is not well suited to raster
GIS.
• In ArcInfo is called NETWORK Module.
• In ArcView is called Network Analyst.
Connectivity Functions
• Connectivity operations are used to characterize spatial
units that are connected according to a set of pre-defined
rules.
• Every connectivity function requires:
- definition of the way spatial elements are
interconnected
- the rules that control the movements along these
interconnections
- a unit of measurement.
Connectivity functions
• Some of the most commonly used connectivity functions
in raster are included in the following three groups:
- Contiguity functions
- Proximity functions
- Spread functions
Connectivity functions
Contiguity functions
• Contiguity functions are usually applied to identify contiguous
areas with specific size and characteristics.
• A contiguous area consists of a group of spatial features that
share one or more specified characteristics and form a unit.
• Definition of contiguous areas changes with applications.
• Example of application: search for land units to be used as parks.
- Include: forests, rivers and swamps
- under these conditions: contiguous land unit must have a
minimum area of 400 Km2 with no sections narrower than
10 Km for the forests and 5 km for the swamps.
Forest
Swamp
River
Fields
Example of Contiguity Analysis
Land Cover Map Contiguous Areas
Conditions for contiguity:
Land cover types: forest, swamps
and rivers
Minimum area: 400 Km2
Minimum section: 10 Km for forest
5 Km for swamp
Connectivity Functions
Proximity Functions
• Proximity functions measure the distance between features.
• The most common measurement units are length and travel time.
• Proximity functions require the definition of four parameters:
1. the target (e.g. a hospital, a road, a house)
2. a unit of measure (e.g. distance in meters, travel time
in minutes)
3. a function to calculate proximity (e.g. Euclidean distance)
4. the area of interest.
• A proximity analysis usually results in the generation of a
buffer zone around one or more map elements.
Proximity Functions
• Examples of proximity analyses are:
- make a distance map from a given river within a watershed area by
generating a buffer zone of increasing distances around the river
(e.g. 0-250 m, 250-500 m, 500-1000 m, >1000 m).
- define protected areas where building is not permitted around a
wetland by generating a buffer zone of a specified width around the
wetland.
- analyze the pattern of noise propagation from an airport by
calculating the distance of each location from the sound source
and the expected rate of decrease in noise level with increasing
distance.
Example of buffer zone generation
River
0 - 250 m
250 - 500 m
Connectivity Functions
Spread Functions
• Spread functions evaluate phenomena that spread or
accumulate with distance.
• The output map is also called accumulation or
friction surface.
• A spread operation can be thought of as moving step-by-step
outward in all directions from one or more starting points
and calculating a variable at each successive step.
Example of application using a spread function
• Spread function results can be presented as contour maps.
In this figure: contours represent
distances in Km away from starting
point A.
The shortest distance between A
and B is indicated by the straight
line connecting them.
In this simple case spread and
proximity functions are the same.
A
B
+
1 2 3 4 5 6 7
A
B
+
1 2 3 4 5 6 7
Absolute Barrier
Example of application using a spread function
In the case of an absolute barrier, such
as a lake that obstacles truck travel,
the shortest travel distance has to
take into account the obstacle (red line).
This type of analysis involving
obstacles can not be accommodated
by proximity functions.
Examples of Applications using spread functions
• Transportation time and cost from and to selected features
(e.g. railways, roads, mines).
• Monitoring the spreading of pollution.
• Mapping flooded areas.
• Terrain trafficability: it is a complex analysis often used in
military operations. The trafficability (or easy and speed of
movement) depends on many variables such as: topography,
land cover type, transportation and season.

More Related Content

Similar to Vector.pdf

Gps geodetic cors
Gps geodetic corsGps geodetic cors
Gps geodetic corsAlam survey
 
CI_SIModule_QGIS.pptx .
CI_SIModule_QGIS.pptx                         .CI_SIModule_QGIS.pptx                         .
CI_SIModule_QGIS.pptx .Athar739197
 
GIS and Remote sensing CIvil Engg by Mrunmayee
GIS and Remote sensing CIvil Engg by MrunmayeeGIS and Remote sensing CIvil Engg by Mrunmayee
GIS and Remote sensing CIvil Engg by MrunmayeeMrunmayee Manjari
 
Introduction and Application of GIS
Introduction and Application of GISIntroduction and Application of GIS
Introduction and Application of GISSatish Taji
 
PIAS 2013-GIS.pptxfskjczjsbchdbfscnnND dHSA
PIAS 2013-GIS.pptxfskjczjsbchdbfscnnND  dHSAPIAS 2013-GIS.pptxfskjczjsbchdbfscnnND  dHSA
PIAS 2013-GIS.pptxfskjczjsbchdbfscnnND dHSAFloridaTLaoaten
 
What is Geography Information Systems (GIS)
What is Geography Information Systems (GIS)What is Geography Information Systems (GIS)
What is Geography Information Systems (GIS)John Lanser
 
Review presentation for Orientation 2014
Review presentation for Orientation 2014Review presentation for Orientation 2014
Review presentation for Orientation 2014DUSPviz
 
Gis fandamentals -1
Gis fandamentals -1Gis fandamentals -1
Gis fandamentals -1RJRANJEET1
 
Finding Meaning in Points, Areas and Surfaces: Spatial Analysis in R
Finding Meaning in Points, Areas and Surfaces: Spatial Analysis in RFinding Meaning in Points, Areas and Surfaces: Spatial Analysis in R
Finding Meaning in Points, Areas and Surfaces: Spatial Analysis in RRevolution Analytics
 
Presentation A.K Nigam sir (2) (1).pptx
Presentation A.K Nigam sir (2)  (1).pptxPresentation A.K Nigam sir (2)  (1).pptx
Presentation A.K Nigam sir (2) (1).pptxspeedcomcyber25
 
Geographic Information System unit 1
Geographic Information System   unit 1Geographic Information System   unit 1
Geographic Information System unit 1sridevi5983
 
Fundamentals of GIS
Fundamentals of GISFundamentals of GIS
Fundamentals of GISRajalakshmiS34
 
Gis basic-2
Gis basic-2Gis basic-2
Gis basic-2RJRANJEET1
 
Q GIS Training Presentation
Q GIS Training PresentationQ GIS Training Presentation
Q GIS Training PresentationShahid Imran Khan
 
Geographic Information System for Bachelor in Agriculture Engineering
Geographic Information System for Bachelor in Agriculture EngineeringGeographic Information System for Bachelor in Agriculture Engineering
Geographic Information System for Bachelor in Agriculture EngineeringDinesh Bishwakarma
 

Similar to Vector.pdf (20)

Gps geodetic cors
Gps geodetic corsGps geodetic cors
Gps geodetic cors
 
GIS
GISGIS
GIS
 
CI_SIModule_QGIS.pptx .
CI_SIModule_QGIS.pptx                         .CI_SIModule_QGIS.pptx                         .
CI_SIModule_QGIS.pptx .
 
GIS and Remote sensing CIvil Engg by Mrunmayee
GIS and Remote sensing CIvil Engg by MrunmayeeGIS and Remote sensing CIvil Engg by Mrunmayee
GIS and Remote sensing CIvil Engg by Mrunmayee
 
Introduction and Application of GIS
Introduction and Application of GISIntroduction and Application of GIS
Introduction and Application of GIS
 
GIS ANALYTICS-2011
GIS ANALYTICS-2011GIS ANALYTICS-2011
GIS ANALYTICS-2011
 
PIAS 2013-GIS.pptxfskjczjsbchdbfscnnND dHSA
PIAS 2013-GIS.pptxfskjczjsbchdbfscnnND  dHSAPIAS 2013-GIS.pptxfskjczjsbchdbfscnnND  dHSA
PIAS 2013-GIS.pptxfskjczjsbchdbfscnnND dHSA
 
What is Geography Information Systems (GIS)
What is Geography Information Systems (GIS)What is Geography Information Systems (GIS)
What is Geography Information Systems (GIS)
 
Introduction to GIS
Introduction to GISIntroduction to GIS
Introduction to GIS
 
Review presentation for Orientation 2014
Review presentation for Orientation 2014Review presentation for Orientation 2014
Review presentation for Orientation 2014
 
Gis fandamentals -1
Gis fandamentals -1Gis fandamentals -1
Gis fandamentals -1
 
(gis)
 (gis) (gis)
(gis)
 
Finding Meaning in Points, Areas and Surfaces: Spatial Analysis in R
Finding Meaning in Points, Areas and Surfaces: Spatial Analysis in RFinding Meaning in Points, Areas and Surfaces: Spatial Analysis in R
Finding Meaning in Points, Areas and Surfaces: Spatial Analysis in R
 
Presentation A.K Nigam sir (2) (1).pptx
Presentation A.K Nigam sir (2)  (1).pptxPresentation A.K Nigam sir (2)  (1).pptx
Presentation A.K Nigam sir (2) (1).pptx
 
Geographic Information System unit 1
Geographic Information System   unit 1Geographic Information System   unit 1
Geographic Information System unit 1
 
Fundamentals of GIS
Fundamentals of GISFundamentals of GIS
Fundamentals of GIS
 
Gis basic-2
Gis basic-2Gis basic-2
Gis basic-2
 
Q GIS Training Presentation
Q GIS Training PresentationQ GIS Training Presentation
Q GIS Training Presentation
 
Geographic Information System for Bachelor in Agriculture Engineering
Geographic Information System for Bachelor in Agriculture EngineeringGeographic Information System for Bachelor in Agriculture Engineering
Geographic Information System for Bachelor in Agriculture Engineering
 
Projections
ProjectionsProjections
Projections
 

Recently uploaded

Like-prefer-love -hate+verb+ing & silent letters & citizenship text.pdf
Like-prefer-love -hate+verb+ing & silent letters & citizenship text.pdfLike-prefer-love -hate+verb+ing & silent letters & citizenship text.pdf
Like-prefer-love -hate+verb+ing & silent letters & citizenship text.pdfMr Bounab Samir
 
“Oh GOSH! Reflecting on Hackteria's Collaborative Practices in a Global Do-It...
“Oh GOSH! Reflecting on Hackteria's Collaborative Practices in a Global Do-It...“Oh GOSH! Reflecting on Hackteria's Collaborative Practices in a Global Do-It...
“Oh GOSH! Reflecting on Hackteria's Collaborative Practices in a Global Do-It...Marc Dusseiller Dusjagr
 
Proudly South Africa powerpoint Thorisha.pptx
Proudly South Africa powerpoint Thorisha.pptxProudly South Africa powerpoint Thorisha.pptx
Proudly South Africa powerpoint Thorisha.pptxthorishapillay1
 
What is Model Inheritance in Odoo 17 ERP
What is Model Inheritance in Odoo 17 ERPWhat is Model Inheritance in Odoo 17 ERP
What is Model Inheritance in Odoo 17 ERPCeline George
 
Introduction to ArtificiaI Intelligence in Higher Education
Introduction to ArtificiaI Intelligence in Higher EducationIntroduction to ArtificiaI Intelligence in Higher Education
Introduction to ArtificiaI Intelligence in Higher Educationpboyjonauth
 
Enzyme, Pharmaceutical Aids, Miscellaneous Last Part of Chapter no 5th.pdf
Enzyme, Pharmaceutical Aids, Miscellaneous Last Part of Chapter no 5th.pdfEnzyme, Pharmaceutical Aids, Miscellaneous Last Part of Chapter no 5th.pdf
Enzyme, Pharmaceutical Aids, Miscellaneous Last Part of Chapter no 5th.pdfSumit Tiwari
 
Difference Between Search & Browse Methods in Odoo 17
Difference Between Search & Browse Methods in Odoo 17Difference Between Search & Browse Methods in Odoo 17
Difference Between Search & Browse Methods in Odoo 17Celine George
 
Introduction to AI in Higher Education_draft.pptx
Introduction to AI in Higher Education_draft.pptxIntroduction to AI in Higher Education_draft.pptx
Introduction to AI in Higher Education_draft.pptxpboyjonauth
 
Capitol Tech U Doctoral Presentation - April 2024.pptx
Capitol Tech U Doctoral Presentation - April 2024.pptxCapitol Tech U Doctoral Presentation - April 2024.pptx
Capitol Tech U Doctoral Presentation - April 2024.pptxCapitolTechU
 
call girls in Kamla Market (DELHI) 🔝 >༒9953330565🔝 genuine Escort Service 🔝✔️✔️
call girls in Kamla Market (DELHI) 🔝 >༒9953330565🔝 genuine Escort Service 🔝✔️✔️call girls in Kamla Market (DELHI) 🔝 >༒9953330565🔝 genuine Escort Service 🔝✔️✔️
call girls in Kamla Market (DELHI) 🔝 >༒9953330565🔝 genuine Escort Service 🔝✔️✔️9953056974 Low Rate Call Girls In Saket, Delhi NCR
 
Full Stack Web Development Course for Beginners
Full Stack Web Development Course  for BeginnersFull Stack Web Development Course  for Beginners
Full Stack Web Development Course for BeginnersSabitha Banu
 
ECONOMIC CONTEXT - PAPER 1 Q3: NEWSPAPERS.pptx
ECONOMIC CONTEXT - PAPER 1 Q3: NEWSPAPERS.pptxECONOMIC CONTEXT - PAPER 1 Q3: NEWSPAPERS.pptx
ECONOMIC CONTEXT - PAPER 1 Q3: NEWSPAPERS.pptxiammrhaywood
 
Organic Name Reactions for the students and aspirants of Chemistry12th.pptx
Organic Name Reactions  for the students and aspirants of Chemistry12th.pptxOrganic Name Reactions  for the students and aspirants of Chemistry12th.pptx
Organic Name Reactions for the students and aspirants of Chemistry12th.pptxVS Mahajan Coaching Centre
 
Employee wellbeing at the workplace.pptx
Employee wellbeing at the workplace.pptxEmployee wellbeing at the workplace.pptx
Employee wellbeing at the workplace.pptxNirmalaLoungPoorunde1
 
How to Make a Pirate ship Primary Education.pptx
How to Make a Pirate ship Primary Education.pptxHow to Make a Pirate ship Primary Education.pptx
How to Make a Pirate ship Primary Education.pptxmanuelaromero2013
 
Solving Puzzles Benefits Everyone (English).pptx
Solving Puzzles Benefits Everyone (English).pptxSolving Puzzles Benefits Everyone (English).pptx
Solving Puzzles Benefits Everyone (English).pptxOH TEIK BIN
 
ENGLISH 7_Q4_LESSON 2_ Employing a Variety of Strategies for Effective Interp...
ENGLISH 7_Q4_LESSON 2_ Employing a Variety of Strategies for Effective Interp...ENGLISH 7_Q4_LESSON 2_ Employing a Variety of Strategies for Effective Interp...
ENGLISH 7_Q4_LESSON 2_ Employing a Variety of Strategies for Effective Interp...JhezDiaz1
 
Presiding Officer Training module 2024 lok sabha elections
Presiding Officer Training module 2024 lok sabha electionsPresiding Officer Training module 2024 lok sabha elections
Presiding Officer Training module 2024 lok sabha electionsanshu789521
 

Recently uploaded (20)

Like-prefer-love -hate+verb+ing & silent letters & citizenship text.pdf
Like-prefer-love -hate+verb+ing & silent letters & citizenship text.pdfLike-prefer-love -hate+verb+ing & silent letters & citizenship text.pdf
Like-prefer-love -hate+verb+ing & silent letters & citizenship text.pdf
 
“Oh GOSH! Reflecting on Hackteria's Collaborative Practices in a Global Do-It...
“Oh GOSH! Reflecting on Hackteria's Collaborative Practices in a Global Do-It...“Oh GOSH! Reflecting on Hackteria's Collaborative Practices in a Global Do-It...
“Oh GOSH! Reflecting on Hackteria's Collaborative Practices in a Global Do-It...
 
Proudly South Africa powerpoint Thorisha.pptx
Proudly South Africa powerpoint Thorisha.pptxProudly South Africa powerpoint Thorisha.pptx
Proudly South Africa powerpoint Thorisha.pptx
 
What is Model Inheritance in Odoo 17 ERP
What is Model Inheritance in Odoo 17 ERPWhat is Model Inheritance in Odoo 17 ERP
What is Model Inheritance in Odoo 17 ERP
 
Introduction to ArtificiaI Intelligence in Higher Education
Introduction to ArtificiaI Intelligence in Higher EducationIntroduction to ArtificiaI Intelligence in Higher Education
Introduction to ArtificiaI Intelligence in Higher Education
 
Enzyme, Pharmaceutical Aids, Miscellaneous Last Part of Chapter no 5th.pdf
Enzyme, Pharmaceutical Aids, Miscellaneous Last Part of Chapter no 5th.pdfEnzyme, Pharmaceutical Aids, Miscellaneous Last Part of Chapter no 5th.pdf
Enzyme, Pharmaceutical Aids, Miscellaneous Last Part of Chapter no 5th.pdf
 
Model Call Girl in Tilak Nagar Delhi reach out to us at 🔝9953056974🔝
Model Call Girl in Tilak Nagar Delhi reach out to us at 🔝9953056974🔝Model Call Girl in Tilak Nagar Delhi reach out to us at 🔝9953056974🔝
Model Call Girl in Tilak Nagar Delhi reach out to us at 🔝9953056974🔝
 
OS-operating systems- ch04 (Threads) ...
OS-operating systems- ch04 (Threads) ...OS-operating systems- ch04 (Threads) ...
OS-operating systems- ch04 (Threads) ...
 
Difference Between Search & Browse Methods in Odoo 17
Difference Between Search & Browse Methods in Odoo 17Difference Between Search & Browse Methods in Odoo 17
Difference Between Search & Browse Methods in Odoo 17
 
Introduction to AI in Higher Education_draft.pptx
Introduction to AI in Higher Education_draft.pptxIntroduction to AI in Higher Education_draft.pptx
Introduction to AI in Higher Education_draft.pptx
 
Capitol Tech U Doctoral Presentation - April 2024.pptx
Capitol Tech U Doctoral Presentation - April 2024.pptxCapitol Tech U Doctoral Presentation - April 2024.pptx
Capitol Tech U Doctoral Presentation - April 2024.pptx
 
call girls in Kamla Market (DELHI) 🔝 >༒9953330565🔝 genuine Escort Service 🔝✔️✔️
call girls in Kamla Market (DELHI) 🔝 >༒9953330565🔝 genuine Escort Service 🔝✔️✔️call girls in Kamla Market (DELHI) 🔝 >༒9953330565🔝 genuine Escort Service 🔝✔️✔️
call girls in Kamla Market (DELHI) 🔝 >༒9953330565🔝 genuine Escort Service 🔝✔️✔️
 
Full Stack Web Development Course for Beginners
Full Stack Web Development Course  for BeginnersFull Stack Web Development Course  for Beginners
Full Stack Web Development Course for Beginners
 
ECONOMIC CONTEXT - PAPER 1 Q3: NEWSPAPERS.pptx
ECONOMIC CONTEXT - PAPER 1 Q3: NEWSPAPERS.pptxECONOMIC CONTEXT - PAPER 1 Q3: NEWSPAPERS.pptx
ECONOMIC CONTEXT - PAPER 1 Q3: NEWSPAPERS.pptx
 
Organic Name Reactions for the students and aspirants of Chemistry12th.pptx
Organic Name Reactions  for the students and aspirants of Chemistry12th.pptxOrganic Name Reactions  for the students and aspirants of Chemistry12th.pptx
Organic Name Reactions for the students and aspirants of Chemistry12th.pptx
 
Employee wellbeing at the workplace.pptx
Employee wellbeing at the workplace.pptxEmployee wellbeing at the workplace.pptx
Employee wellbeing at the workplace.pptx
 
How to Make a Pirate ship Primary Education.pptx
How to Make a Pirate ship Primary Education.pptxHow to Make a Pirate ship Primary Education.pptx
How to Make a Pirate ship Primary Education.pptx
 
Solving Puzzles Benefits Everyone (English).pptx
Solving Puzzles Benefits Everyone (English).pptxSolving Puzzles Benefits Everyone (English).pptx
Solving Puzzles Benefits Everyone (English).pptx
 
ENGLISH 7_Q4_LESSON 2_ Employing a Variety of Strategies for Effective Interp...
ENGLISH 7_Q4_LESSON 2_ Employing a Variety of Strategies for Effective Interp...ENGLISH 7_Q4_LESSON 2_ Employing a Variety of Strategies for Effective Interp...
ENGLISH 7_Q4_LESSON 2_ Employing a Variety of Strategies for Effective Interp...
 
Presiding Officer Training module 2024 lok sabha elections
Presiding Officer Training module 2024 lok sabha electionsPresiding Officer Training module 2024 lok sabha elections
Presiding Officer Training module 2024 lok sabha elections
 

Vector.pdf

  • 1. GIS Lecture 1. Introduction to Vector Geographic Information Systems Data Conversion/Entry (GIS, Databases) November 6 – 10, 2006 Freetown, Sierra Leone
  • 2. Lecture Outline • Components of a GIS • Basic GIS Concepts • Geographic Coordinate Systems • Projections • Vector Data Models • Spaghetti Data Model • Topological Data Model • Triangulated Irregular Networks (TINs) • Data Capture Systems •Digitizing •Scanning •GPS • Vector Editing • Vector GIS Functions and Analysis
  • 3. So, What is a GIS • A system for capturing, storing, checking, manipulating, analysingand displaying data which are spatially referenced to the Earth (DoE, 1987) • Any manual or computer based set of procedures used to store and manipulate geographically referenced data (Aronoff, 1989) • A database system in which most of the data are spatially indexed, and upon which a set of procedures operated in order to answer queries about spatial entities in the database. (Smith, 1987) • A system with advanced geo-modeling capabilities. (Koshkariov, et. al. 1986) Arthur J. Lembo, Jr. Cornell University
  • 4. Components of GIS Something has to make all of these applications go together. That something includes the basic components of GIS. As we said, GIS is an integrated system of geography and information tied together. The main components of a GIS include: •People •Hardware •Software Many people see GIS as an integrative technology, because it helps tie many different geospatial activities together. In fact, the different geospatial activities are the very thing that helped create GIS in the first place! For example, GIS links many parallel developments such as: •Computer automated drafting •Cartography / Surveying •Photogrammetry •Digital Image Processing •Global Positioning System •Statistics… among other technologies Each of these disciplines, among others, have greatly contributed to the development of GIS technology.
  • 5. Why is GIS Important • A Ubiquitous Tool • Environmental Analysis • Engineering Design • Business Geographics • Social Services • Better Government
  • 6.
  • 7. Basic Concepts of GIS As we said, the definition of GIS, at least the way we present it here is rather long. But, the concepts of GIS are quite simple, especially if you break it down into its component words: • G stands for geographic, so we know that GIS has something to do with geography. • I stands for information, so we know that GIS has something to do with information, namely geographic information. • S stands for system, so we know that GIS is an integrated system of geography and information tied together. • Most people agree that over 80% of the information related to government operations have a geographic component. Therefore, a system that integrates this information together is quite valuable. We shall see how a geographic information system tied geography and information together…. Arthur J. Lembo, Jr. Cornell University
  • 8. 0Âş 0Âş 0Âş 0Âş Prime Meridian Prime Meridian Equator Equator (Longitude) (Longitude) (Latitude) (Latitude) 10Âş N 10Âş N 30Âş N 30Âş N 10Âş S 10Âş S Geographic Coordinate Systems (GCS) Latitude and Longitude
  • 9. Spheroid Semimajor Axis (m) Semiminor Axis (m) Clarke 1866 6,378,206.4 6,356,583.8 GRS1980 6,378,137.0 6,356,752.31414 WGS1984 6,378,137.0 6,356,752.31424 Spheroids and Ellipsoids
  • 11. Units: Geographic Coordinates Units: • Degrees Minutes Seconds • Decimal Degrees 60 minutes = 1 degree 60 seconds = 1 minute 64o 30’ 15” = decimal degrees? Answer: = 64 + (30/60) + (15/(60*60)) = 64.541666 DD
  • 12. A Datum is Defined by • A Spheroid • Datum origin point • Orientation of Geographic Coordinate (i.e. Equator and Prime Meridian)
  • 13. A projected coordinate system is defined on a flat, two-dimensional surface. Unlike a geographic coordinate system, a projected coordinate system has constant lengths, angles, and areas across the two dimensions. A projected coordinate system is always based on a geographic coordinate system that is based on a sphere or spheroid. Projected Coordinate Systems Moving from 3-D to 2-D!
  • 14. Understanding mapping: error There are six main types of distortion in mapping: •shape •distance •area •direction •scale •angle
  • 15.
  • 16. Understanding mapping: projection Azimuthal projection Cylindrical projection Conic projection Different projections have their own characteristics and uses. They all distort the properties of the Earth, but do so differently.
  • 17. Cylindrical surface Earth intersects the cylinder on two small circles. All points along both circles have no scale distortion.
  • 19. Africa - Lambert Azimuthal Equal-Area 5N, 20E A Conic Projection This is the African Continental Projection Recommended by the FAO
  • 20. A good reference: http://gis.esri.com/library/userconf/proc98/PROCEED/TO850/PAP844/P844.HTM#appendix%203 The Interrupted Goode Homolosine Projection (Goode's) Combining twelve instances of the Mollweide and Sinusoidal Map Projections Many Global Datasets/Imagery are made available in this projection, including MODIS Imagery
  • 21. UTM Projection • Universe Transverse Mercator • Conformal projection (shapes are preserved) • Cylindrical surface • Two standard meridians • Zones are 6 degrees of longitude wide
  • 23. Sierra Leone Landsat MSS Imagery In UTM (Universal Transverse Mercator) Projection In ArcGIS In ILWIS Notice the same parameters in both UTM Zone 28
  • 24. Reference: Food and Agriculture Organization of the United Nations. SPATL-PAIA/GIS Doc. 01 2003-04-28 FAO Interdisciplinary Database: Spatial Standards and Norms Draft Technical Report Map Projections • There are no absolute standards that can generally be applied for map projections, since there is no absolute better projection than another. • The choice of the projection depends on the considered portion of the world and on the purpose for which the map is to be used for. • However, for the objective of standardization and data exchange, the intent is to find a suitable set of map projections which can provide a good representation of the areas under examination (minimizing distortions of shapes and areas) and that can be handled by most of the commercial GIS packages in use in FAO.
  • 25. FAO Recommended Standard Projections • All dataset types: un-projected (Geographic) • Global datasets: Mollweide • Continental datasets: Lambert Azimuthal Equal Area • National datasets: Lambert Conformal Conic or Albers Equal Area Conic • Sub-national or tiled datasets: Universal Transverse Mercator (UTM) Food and Agriculture Organization of the United Nations. SPATL-PAIA/GIS Doc. 01 2003-04-28 FAO Interdisciplinary Database: Spatial Standards and Norms Draft Technical Report
  • 26. FAO Recommended Datum and Spheroid Standards Reference system based on WGS 84 datum and IAG-GRS80 spheroid Most of the global and continental datasets are referenced according to the WGS 84 datum based on IAG-GRS80 spheroid. Being a global datum which fairly represents every location on the earth’s surface, it is convenient for small-scale data and it is recommended for FAO use. In addition, datasets currently produced by the UN Cartographic Section use the same reference system. Food and Agriculture Organization of the United Nations. SPATL-PAIA/GIS Doc. 01 2003- 04-28 FAO Interdisciplinary Database: Spatial Standards and Norms Draft Technical Report
  • 27. Continent Recommended Projection and Projection Parameters North America Lambert Azimuthal Equal Area with center in 50N, 100W South America Lambert Azimuthal Equal Area with center in 15N, 60W Europe Lambert Azimuthal Equal Area with center in 55N, 20E Africa Lambert Azimuthal Equal Area with center in 5N, 20E Asia Lambert Azimuthal Equal Area with center in 45N, 100E Australia Lambert Azimuthal Equal Area with center in 15S, 135E Antarctica Lambert Azimuthal Equal Area centered on the South Pole FAO Recommended Continental Scale Projections Food and Agriculture Organization of the United Nations. SPATL-PAIA/GIS Doc. 01 2003- 04-28 FAO Interdisciplinary Database: Spatial Standards and Norms Draft Technical Report
  • 28. Africa - Lambert Azimuthal Equal-Area 5N, 20E
  • 29. Antarctica - Lambert Azimuthal Equal-Area 90S, 0E
  • 30. Vector GIS Data Models • Relational Databases •Vector Data Models • Spaghetti Data Model • Topological Data Model
  • 31. (Taken from Arnoff 1991) The Relational Data Model • Information stored in simple two dimensional tables • Organization is simple to understand and communicate • Tables and be linked by a common field/fields • Redundant data storage minimized • More Flexible than other models. • Queries can be somewhat slower than other models.
  • 32. Storage of GIS Attribute Information in a Relational Data Base
  • 33. The Spaghetti Data Model • A point is encoded as a single XY coordinate pair. A line is encoded as string of XY coordinate pairs. An area is represented a polygon and is recorded as a closed loop of XY coordinates that define its boundary. •Essentially a collection of coordinate strings with no inherent structure - hence the term spaghetti model. • Model is very simple and easy to understand. The spatial relationship between features is not encoded. •This model is very inefficient for most types of spatial analyses, since any spatial relationship must be derived from computation. (Taken from Arnoff 1991)
  • 34. • Advantages: - the Spaghetti data model is very simple and easy to understand. • Disadvantages: - lines between adjacent areas must be digitized twice. - the spatial relationships between features are not retained. - this model is very inefficient for most types of spatial analyses (since any spatial relationship must be derived from computation). The Spaghetti Data Model
  • 35. The Topological Data Model (Taken from Arnoff 1991) Webster’s Dictionary Definition of Topology: A branch of mathematics concerned with those properties of geometric configuration. • Note: Polygons can have islands within them. Polygon C is an island within polygon B. This is indicated in ARCS listed for polygon B by a zero proceeding the list of arcs.
  • 36. • Most widely used method of encoding spatial relationships in a GIS (eg. ArcInfo). • From the topology alone (ie the three topology tables), analysis of the relative position of the map elements can be done. • Since all spatial relationships are explicitly defined in the topology tables (eg. Connectivity and Contiguity) spatial queries using the topology tables can be processed very quickly. Example. Find all features within Polygon B. • To do spatial queries in non-topological GISs (such as ArcView) is much more computer intensive and requires the use of the coordinate data. Topological Data Model
  • 37. • Advantages: - spatial relations are retained - from the topology alone analysis of the relative position of the map elements can be done - spatial queries using the topology tables can be processed very quickly • Disadvantages: - more complex data structure - map updating requires updating topology The Topological Data Model
  • 38. Comparison of the Topological vs. Non-topological A – As you would expect in ArcView 3.* (non topological B – As you would expect in ArcInfo Workstation (topological) A) B) Compare these tables to the note: Fnode# = Start Node Tnode# = End Node Lpoly# = Left Polygon Rpoly# = Right Polygon
  • 39. Triangled Irregular Networks (TINs) • A TIN is a vector-based topological data model. A TIN represents the surface as a set of interconnected triangular facets. For each of the three vertices, the XY coordinate (geographic location) and the Z coordinate (elevation or other) values are encoded. • The coordinate data and topology for the TIN are stored in a set of tables • TINs are irregularly spaced such that they are dense in areas of rapidly changing terrain and sparse in areas of relatively flat terrain. • In the TIN, each triangle forms a plane from which the terrain parameters of slope and slope aspect can be calculated and stored as attributes. • The generated surface passes through all the data points (exact Interpolator)
  • 40. A Comparison of Raster, Vector and TIN Data Structures For Representing Elevation
  • 41. Topological Data Structure of a Triangled Irregular Network
  • 42. Topographic Map and the Corresponding TIN Representation Topographic Map TIN Representation
  • 43. X - axis Y - axis 42 35 32 28 26 X Y Z 1 1 26 2 3 28 4 3 32 3 5 42 5 4 35 3 4 ? Triangled Irregular Networks (TINs) The elevation at any point on the surface can be calculated. All that is required is the x,y and z coordinates of triangle it is within. Z = a + bx + cy - where a,b and c are constants. For the example to the left 42 = a + 3b +5c 32 = a + 4b +2c 28 = a +2b +3c From which: z = 4.8 + 4.4x + 4.8y and substituting coordinates (3,4) z = 37.2
  • 44. Advantages of TINs STORAGE: TINs are an efficient storage model. Because the size of each facet is variable, smaller triangles and therefore a more detailed representation can be provided where there is a high density of data points. FEATURE DEFINITION: Break-point features in the terrain, such as ridge lines, faults, valley bottoms, streams can be accurately encoded by using a higher density of elevation points. As a result, these features can be precisely encoded in a TIN. In a grid representation these same features may be smoothed. Although there are many advantages to representing data in a TIN, they are commonly translated to the raster model. This is largely due, that once in this format it is currently easier to model and the data can be easily integrated with other image data, such as remote sensing imagery.
  • 45. What is Digitizing? • The most common method of converting existing maps into digital format. • Secure source map to digitizing tablet. • Select and record control points. • Trace over the map with cursor. • Crosshairs on cursor must line up exactly with the features you are digitizing. • The digitizer records coordinates as x and y tablet coordinates and then transforms them to the map coordinate system. • Edit and correct the data. Cursor Digitizing tablet
  • 46. Data Capture by Scanning Because the computer allows us to zoom far into images we can work with the mouse and scanned image to allow much greater accuracy than is possible with a digitizing tablet. Scanners are much less expensive than digitizers, are much more accurate. Most people are familiar with scanners, as they can be purchased rather cheaply in office supply stores. However, the scanners you are most familiar with probably only copy legal size paper. For mapping purposes, scanners have to be much larger, with the ability to accommodate sheet sizes greater than 34”, as shown here. These devices allow a user to scan a map in the computer and perform digitizing on the computer screen (this is called “heads-up” digitizing), thus eliminating the need for a digitizing tablet.
  • 47. Field Data Collection Directly with Hand Held GPS enabled Devices Captured coordinates and attributes can be entered directly into a GIS
  • 48. Geometric Correction Note this is the same process you use to: • Register your digitizing table to your selected Coordinate System. • Register your raw Satellite or Airborne Raster Imagery to your selected Coordinate System • Register your Scanned Map to your selected Coordinate System.
  • 49. Geometric Correction Moving from Local Coordinates to Easting and Northing Raw Image Corrected Image c r n n’ e e’ c’ r’ e’=f(c,r) n’=f(c,r)
  • 50. X1=ao + a1x + a2y + a3xy + a4x2 + a5y2 + a6x2y + a7xy2 + a8x3 + a9y3 1st order 2nd order 3rd order Y1=bo + b1x + b2y + b3xy + b4x2 + b5y2 + b6x2y + b7xy2 + b8x3 + b9y3 1st order 2nd order 3rd order POLYNOMIAL EQUATIONS FOR X1, Y1 Notes: • Where X1,Y1 are the coordinates in the uncorrected image generated from the corrected matrix system x,y coordinates. • a and b are constants. Source: PCI Manual
  • 51. The Vector Editing Environment in ArcGIS
  • 52. The Vector Editing Environment in ILWIS
  • 54. Vector GIS Functions and Analysis in ILWIS
  • 55. A couple of the Vector Tools in ArcGIS – Buffer Wizard and the GeoProcessing Wizard
  • 56. NETWORK FUNCTIONS • A Network is a set of interconnected linear features that form a pattern or framework (e.g.. Streams, Roads etc.). • Network Analysis requires a networked and topologically structured vector data layer. • Networks are commonly used for moving resources from one location to another.
  • 57. Example of a Stream Network Query Extract all Second-Order Streams (Red) And then Extract Associated Second-Order Catchments Red Vectors Indicating Strahler Second-Order Streams
  • 58. Network Analysis Network Analysis usually involve four components: • A set of resources (such as goods to be delivered); • One or more locations where the resources are located (such as the warehouse where the goods are stored); • An objective. To deliver the resources to a set of destinations - or to provide a minimum level of service (such as a police station); • A set of constraints that places limits on how the objectives can be met (such as a maximum speed, one-way street etc.).
  • 59. A GIS is used to perform three principal types of Network analysis: • Prediction of Network loading • Route Optimization • Resource Allocation
  • 60. Route Optimization Examples: 1) Emergency routing of ambulances, fire, police vehicles 2) Airline Scheduling 3) Routing of Bus Services, Mail Serives etc.
  • 61. Resource Allocation Examples: 1) Division of a metropolitan area into zones that can be effectively serviced by individual police and fire stations. 2) Where geographically to add additional ambulance stations to increase overall objectives.
  • 62. NETWORK ANALYSIS • Network Analysis is not well suited to raster GIS. • In ArcInfo is called NETWORK Module. • In ArcView is called Network Analyst.
  • 63. Connectivity Functions • Connectivity operations are used to characterize spatial units that are connected according to a set of pre-defined rules. • Every connectivity function requires: - definition of the way spatial elements are interconnected - the rules that control the movements along these interconnections - a unit of measurement.
  • 64. Connectivity functions • Some of the most commonly used connectivity functions in raster are included in the following three groups: - Contiguity functions - Proximity functions - Spread functions
  • 65. Connectivity functions Contiguity functions • Contiguity functions are usually applied to identify contiguous areas with specific size and characteristics. • A contiguous area consists of a group of spatial features that share one or more specified characteristics and form a unit. • Definition of contiguous areas changes with applications. • Example of application: search for land units to be used as parks. - Include: forests, rivers and swamps - under these conditions: contiguous land unit must have a minimum area of 400 Km2 with no sections narrower than 10 Km for the forests and 5 km for the swamps.
  • 66. Forest Swamp River Fields Example of Contiguity Analysis Land Cover Map Contiguous Areas Conditions for contiguity: Land cover types: forest, swamps and rivers Minimum area: 400 Km2 Minimum section: 10 Km for forest 5 Km for swamp
  • 67. Connectivity Functions Proximity Functions • Proximity functions measure the distance between features. • The most common measurement units are length and travel time. • Proximity functions require the definition of four parameters: 1. the target (e.g. a hospital, a road, a house) 2. a unit of measure (e.g. distance in meters, travel time in minutes) 3. a function to calculate proximity (e.g. Euclidean distance) 4. the area of interest. • A proximity analysis usually results in the generation of a buffer zone around one or more map elements.
  • 68. Proximity Functions • Examples of proximity analyses are: - make a distance map from a given river within a watershed area by generating a buffer zone of increasing distances around the river (e.g. 0-250 m, 250-500 m, 500-1000 m, >1000 m). - define protected areas where building is not permitted around a wetland by generating a buffer zone of a specified width around the wetland. - analyze the pattern of noise propagation from an airport by calculating the distance of each location from the sound source and the expected rate of decrease in noise level with increasing distance.
  • 69. Example of buffer zone generation River 0 - 250 m 250 - 500 m
  • 70. Connectivity Functions Spread Functions • Spread functions evaluate phenomena that spread or accumulate with distance. • The output map is also called accumulation or friction surface. • A spread operation can be thought of as moving step-by-step outward in all directions from one or more starting points and calculating a variable at each successive step.
  • 71. Example of application using a spread function • Spread function results can be presented as contour maps. In this figure: contours represent distances in Km away from starting point A. The shortest distance between A and B is indicated by the straight line connecting them. In this simple case spread and proximity functions are the same. A B + 1 2 3 4 5 6 7
  • 72. A B + 1 2 3 4 5 6 7 Absolute Barrier Example of application using a spread function In the case of an absolute barrier, such as a lake that obstacles truck travel, the shortest travel distance has to take into account the obstacle (red line). This type of analysis involving obstacles can not be accommodated by proximity functions.
  • 73. Examples of Applications using spread functions • Transportation time and cost from and to selected features (e.g. railways, roads, mines). • Monitoring the spreading of pollution. • Mapping flooded areas. • Terrain trafficability: it is a complex analysis often used in military operations. The trafficability (or easy and speed of movement) depends on many variables such as: topography, land cover type, transportation and season.