Downloaded 116 times

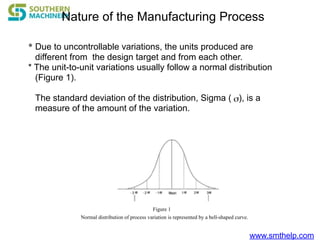
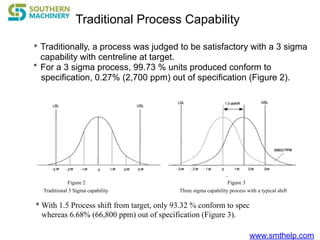
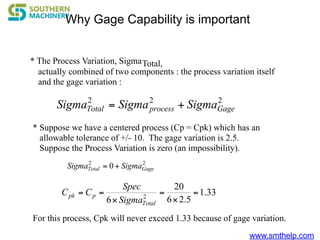
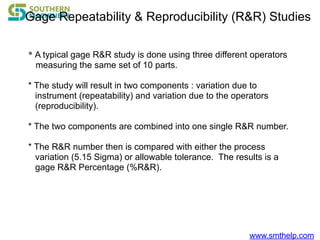
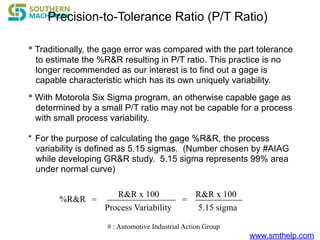
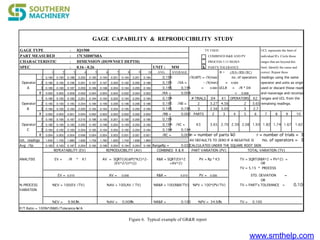
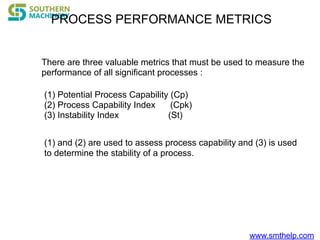
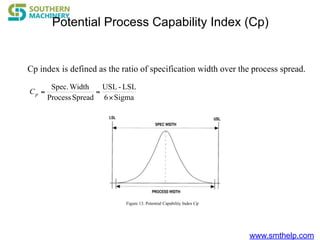
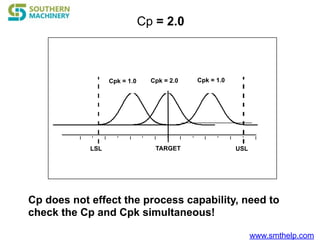
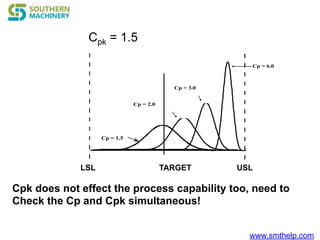
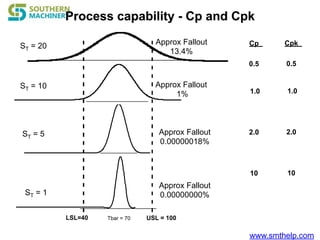


The document discusses process capability metrics, particularly focusing on six sigma quality control, the importance of measurement systems, and gage capability studies. It highlights the significance of measuring variations in manufacturing processes and utilizing statistical studies to assess and improve process capability. Additionally, it outlines specific metrics for evaluating process performance including potential process capability (Cp), process capability index (Cpk), and instability index (St).