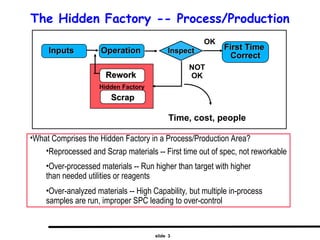
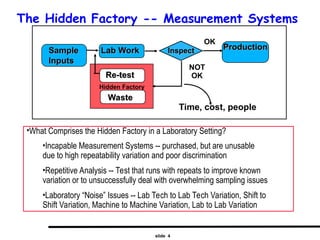
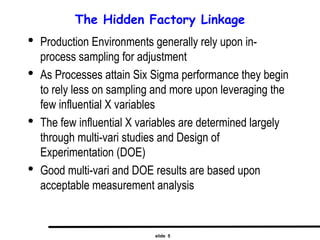
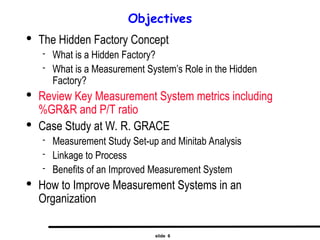
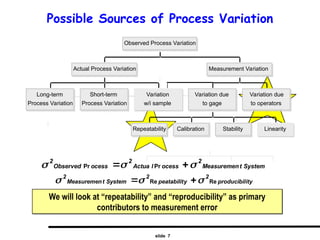
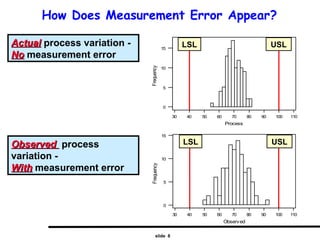
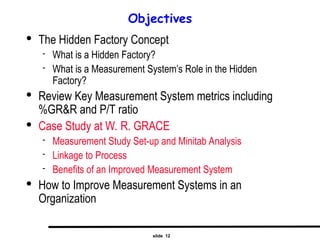
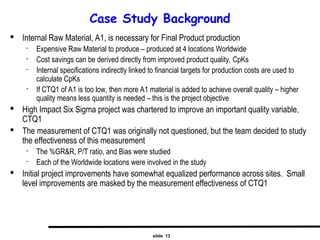
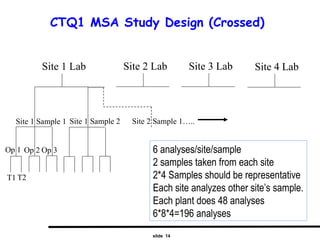
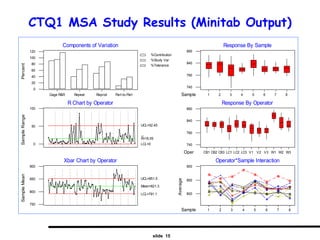
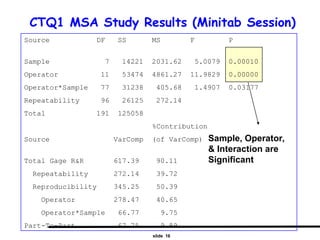
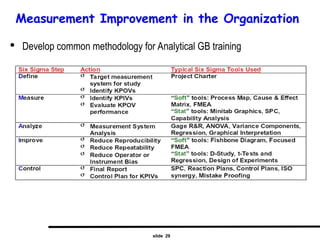
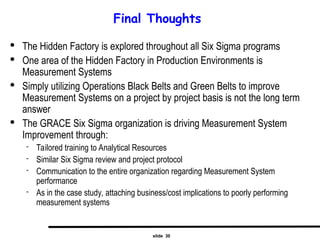
slide 1
Six Sigma in Measurement Systems:
Evaluating the Hidden Factory
Scrap
Scrap
Rework
Rework
Hidden Factory
NOT
OK
Operation
Operation
Inputs
Inputs Inspect
Inspect First Time
First Time
Correct
Correct
OK
Time, cost, people
Bill Rodebaugh
Director, Six Sigma
GRACE
slide 2
Objectives

The Hidden Factory Concept
 What is a Hidden Factory?
 What is a Measurement System’s Role in the Hidden
Factory?

Review Key Measurement System metrics including
%GR&R and P/T ratio

Case Study at W. R. GRACE
 Measurement Study Set-up and Minitab Analysis
 Linkage to Process
 Benefits of an Improved Measurement System

How to Improve Measurement Systems in an
Organization
slide 3
The Hidden Factory -- Process/Production
Scrap
Scrap
Rework
Rework
Hidden Factory
NOT
OK
Operation
Operation
Inputs
Inputs Inspect
Inspect First Time
First Time
Correct
Correct
OK
Time, cost, people
•What Comprises the Hidden Factory in a Process/Production Area?
•Reprocessed and Scrap materials -- First time out of spec, not reworkable
•Over-processed materials -- Run higher than target with higher
than needed utilities or reagents
•Over-analyzed materials -- High Capability, but multiple in-process
samples are run, improper SPC leading to over-control
slide 4
The Hidden Factory -- Measurement Systems
Waste
Waste
Re-test
Re-test
Hidden Factory
NOT
OK
Lab Work
Lab Work
Sample
Sample
Inputs
Inputs
Inspect
Inspect Production
Production
OK
Time, cost, people
•What Comprises the Hidden Factory in a Laboratory Setting?
•Incapable Measurement Systems -- purchased, but are unusable
due to high repeatability variation and poor discrimination
•Repetitive Analysis -- Test that runs with repeats to improve known
variation or to unsuccessfully deal with overwhelming sampling issues
•Laboratory “Noise” Issues -- Lab Tech to Lab Tech Variation, Shift to
Shift Variation, Machine to Machine Variation, Lab to Lab Variation
slide 5
The Hidden Factory Linkage

Production Environments generally rely upon in-
process sampling for adjustment

As Processes attain Six Sigma performance they begin
to rely less on sampling and more upon leveraging the
few influential X variables

The few influential X variables are determined largely
through multi-vari studies and Design of
Experimentation (DOE)

Good multi-vari and DOE results are based upon
acceptable measurement analysis
slide 6
Objectives

The Hidden Factory Concept
 What is a Hidden Factory?
 What is a Measurement System’s Role in the Hidden
Factory?

Review Key Measurement System metrics including
%GR&R and P/T ratio

Case Study at W. R. GRACE
 Measurement Study Set-up and Minitab Analysis
 Linkage to Process
 Benefits of an Improved Measurement System

How to Improve Measurement Systems in an
Organization
slide 7
Possible Sources of Process Variation
We will look at “repeatability” and “reproducibility” as primary
contributors to measurement error
Stability Linearity
Long-term
Process Variation
Short-term
Process Variation
Variation
w/i sample
Actual Process Variation
Repeatability Calibration
Variation due
to gage
Variation due
to operators
Measurement Variation
Observed Process Variation
System
t
Measuremen
2
ocess
l
Actua
2
ocess
Observed
2


 
 Pr
Pr
ity
producibil
2
y
peatabilit
2
System
t
Measuremen
2
Re
Re 

 

slide 8
110
100
90
80
70
60
50
40
30
15
10
5
0
Observed
Frequency
LSL USL
Actual
Actual process variation -
No
No measurement error
Observed
Observed process
variation -
With
With measurement error
110
100
90
80
70
60
50
40
30
15
10
5
0
Process
Frequency
LSL USL
How Does Measurement Error Appear?
slide 9
Measurement System Terminology

Discrimination - Smallest detectable increment between two measured values

Accuracy related terms
 True value - Theoretically correct value
 Bias - Difference between the average value of all measurements of a sample and the
true value for that sample

Precision related terms
 Repeatability - Variability inherent in the measurement system under constant
conditions
 Reproducibility - Variability among measurements made under different conditions
(e.g. different operators, measuring devices, etc.)

Stability - distribution of measurements that remains constant and predictable over time for
both the mean and standard deviation

Linearity - A measure of any change in accuracy or precision over the range of instrument
capability
slide 10
Measurement Capability Index - P/T

Precision to Tolerance Ratio

Addresses what percent of the tolerance
percent of the tolerance is taken up by
measurement error

Includes both repeatability and reproducibility
 Operator x Unit x Trial experiment

Best case: 10% Acceptable: 30%
Usually expressed
as percent
P T
Tolerance
MS
/
. *

515 
Note: 5.15 standard deviations accounts for 99% of Measurement System (MS) variation.
The use of 5.15 is an industry standard.
slide 11
Measurement Capability Index - % GR&R

Addresses what percent of the Observed Process Variation
percent of the Observed Process Variation is
taken up by measurement error

%R&R is the best estimate of the effect of measurement
systems on the validity of process improvement studies (DOE)

Includes both repeatability and reproducibility

As a target, look for %R&R < 30%
Usually expressed
as percent
100
x
R
R
Variation
ocess
Observed
MS
Pr
&
%



slide 12
Objectives

The Hidden Factory Concept
 What is a Hidden Factory?
 What is a Measurement System’s Role in the Hidden
Factory?

Review Key Measurement System metrics including
%GR&R and P/T ratio

Case Study at W. R. GRACE
 Measurement Study Set-up and Minitab Analysis
 Linkage to Process
 Benefits of an Improved Measurement System

How to Improve Measurement Systems in an
Organization
slide 13
Case Study Background

Internal Raw Material, A1, is necessary for Final Product production
 Expensive Raw Material to produce – produced at 4 locations Worldwide
 Cost savings can be derived directly from improved product quality, CpKs
 Internal specifications indirectly linked to financial targets for production costs are used to
calculate CpKs
 If CTQ1 of A1 is too low, then more A1 material is added to achieve overall quality – higher
quality means less quantity is needed – this is the project objective

High Impact Six Sigma project was chartered to improve an important quality variable,
CTQ1

The measurement of CTQ1 was originally not questioned, but the team decided to study
the effectiveness of this measurement
 The %GR&R, P/T ratio, and Bias were studied
 Each of the Worldwide locations were involved in the study

Initial project improvements have somewhat equalized performance across sites. Small
level improvements are masked by the measurement effectiveness of CTQ1
slide 14
CTQ1 MSA Study Design (Crossed)
Site 1 Lab
6 analyses/site/sample
2 samples taken from each site
2*4 Samples should be representative
Each site analyzes other site’s sample.
Each plant does 48 analyses
6*8*4=196 analyses
Site 1 Sample 1 Site 1 Sample 2
Op 1 Op 2 Op 3
T1 T2
Site 2 Lab Site 3 Lab Site 4 Lab
Site 2 Sample 1…..
slide 15
CTQ1 MSA Study Results (Minitab Output)
Gage name:
Date of study:
Reported by:
Tolerance:
Misc:
Z-14 MSA
JULY 2002
All Labs
110
0
750
800
850
900 CB1 CB2 CB3 LC1 LC2 LC3 V1 V2 V3 W1 W2 W3
Xbar Chart by Operator
Sample
Mean
Mean=821.3
UCL=851.5
LCL=791.1
0
0
50
100 CB1 CB2 CB3 LC1 LC2 LC3 V1 V2 V3 W1 W2 W3
R Chart by Operator
Sample
Range
R=16.05
UCL=52.45
LCL=0
1 2 3 4 5 6 7 8
800
850
900
Sample
Operator
Operator*Sample Interaction
Average
CB1
CB2
CB3
LC1
LC2
LC3
V1
V2
V3
W1
W2
CB1 CB2 CB3 LC1 LC2 LC3 V1 V2 V3 W1 W2 W3
740
790
840
890
Oper
Response By Operator
1 2 3 4 5 6 7 8
740
790
840
890
Sample
Response By Sample
%Contribution
%Study Var
%Tolerance
Gage R&R Repeat Reprod Part-to-Part
0
20
40
60
80
100
120
Components of Variation
Percent
Surface Area
slide 16
CTQ1 MSA Study Results (Minitab Session)
Source DF SS MS F P
Sample 7 14221 2031.62 5.0079 0.00010
Operator 11 53474 4861.27 11.9829 0.00000
Operator*Sample 77 31238 405.68 1.4907 0.03177
Repeatability 96 26125 272.14
Total 191 125058
%Contribution
Source VarComp (of VarComp)
Total Gage R&R 617.39 90.11
Repeatability 272.14 39.72
Reproducibility 345.25 50.39
Operator 278.47 40.65
Operator*Sample 66.77 9.75
Part-To-Part 67.75 9.89
Sample, Operator,
& Interaction are
Significant
slide 17
CTQ1 MSA Study Results
Site %GRR
P/T
Ratio
R-bar
Equal Variances
within Groups
Mean
Differences
(Tukey Comp.)
All
94.3
(78.6 – 100)*
116 16.05 No (0.004) Only 1,2 No Diff.
Site 1
38.9
(30.0 – 47.6)
29 7.22 Yes (0.739) All Pairs No Diff.
Site 2
91.0
(70.7 – 100)
96 17.92 Yes (0.735) Only 1,2 Diff.
Site 3
80.0
(60.8 – 94.8)
79 20.37 Yes (0.158) All Pairs No Diff.
Site 4
98.0
(64.8 – 100)
120 18.67 Yes (0.346) Only 2,3 No Diff.
*Conf Int not calculated with Minitab, Based upon R&R Std Dev
slide 18
CTQ1 MSA Study Results (Minitab Output)
WO
SA
VF
SA
LC
SA
CB
SA
890
840
790
740
C17
C16
Dotplots of C16 by C17
(group means are indicated by lines)
Site 1 Site 2 Site 3 Site 4
Dotplot of All Samples over All Sites
slide 19
CTQ1 MSA Study Results (Minitab Session)
Analysis of Variance for Site
Source DF SS MS F P
Site 3 37514 12505 26.86 0.000
Error 188 87518 466
Total 191 125032
Individual 95% CIs For Mean
Based on Pooled StDev
Level N Mean StDev -+---------+---------+---------+-----
Site 1 48 824.57 15.38 (---*---)
Site 2 48 819.42 22.11 (---*---)
Site 3 48 800.98 20.75 (---*---)
Site 4 48 840.13 26.58 (---*---)
-+---------+---------+---------+-----
Pooled StDev = 21.58 795 810 825 840
Site and Operator are closely related
slide 20
CTQ1 MSA Study Results (Minitab Output)
X-bar R of All Samples for All Sites
0
750
800
850
900 CB1 CB2 CB3 LC1 LC2 LC3 V1 V2 V3 W1 W2 W3
Xbar Chart by Operator
Sample
Mean
Mean=821.3
UCL=851.5
LCL=791.1
0
0
50
100 CB1 CB2 CB3 LC1 LC2 LC3 V1 V2 V3 W1 W2 W3
R Chart by Operator
Sample
Range
R=16.05
UCL=52.45
LCL=0
1
800
850
900
Sample
O
Average
CB1 CB2 C
740
790
840
890
Oper
1 2
740
790
Sample
Gage R&R Repeat Reprod Part-to-Part
0
20
40
Per
Most of the
samples are
seen as “noise”
Discrimination
Index is “0”,
however can
probably see
differences of 5
slide 21
CTQ1 MSA Study Results (Minitab Output)
•Mean differences are seen in X-bar area
•Most of the samples are seen as “noise”
0
800
850
900 W1 W2 W3
Xbar Chart by WO OP
Sample
Mean
Mean=840.1
UCL=875.2
LCL=805.0
0
0
10
20
30
40
50
60
70 W1 W2 W3
R Chart by WO OP
Sample
Range
R=18.67
UCL=60.99
LCL=0
Gage R&R Repeat Reprod Part-to-Part
0
50
Pe X-bar R of All Samples for Site 4
slide 22
CTQ1 MSA Study Results – Process Linkage
Site 2 Example
0
780
790
800
810
820
830
840
850
860 LC1 LC2 LC3
Xbar Chart by LC OP
Sample
Mean
Mean=819.4
UCL=853.1
LCL=785.7
0
0
Sampl
R=17.92
LCL=0
1 2 3
790
800
810
820
830
840
850
Sample
LC OP*Sa
Average
LC1
760
LC OP
400
300
200
100
Subgroup 0
1000
900
800
700
Individual
Value
1
1
6
1
6
1
6
2
2
2 4
1
4
1
2
5
1
1 1
6
1 1
2
2
2
2
6
6
6
2
2
6
6
2
2
2
2
5
5
Mean=832.5
UCL=899.2
LCL=765.8
150
100
g
Range
1 1 1
1
1
1
1
1
1
1
1
1
1
UCL=81.95
I and MR Chart for TSA (t)
2002 Historical
Process
Results with
Mean = 832.5
MSA Study
Results with
Mean = 819.4
Selected Samples are Representative
slide 23
CTQ1 MSA Study Results – Process Linkage
Site 2 Example
0
780
790
800
810
820
830
840
850
860 LC1 LC2 LC3
Xbar Chart by LC OP
Sample
Mean
Mean=819.4
UCL=853.1
LCL=785.7
0
0
50
100 LC1 LC2 LC3
R Chart by LC OP
Sample
Range
R=17.92
UCL=58.54
LCL=0
1 2 3 4 5 6 7 8
790
800
810
820
830
840
850
Sample
LC O
LC OP*Sample Interaction
Average
L
L
L
LC1 LC2 LC3
760
810
860
LC OP
By LC OP
1 2 3 4 5 6 7 8
760
810
Sample
Gage R&R Repeat Reprod Part-to-Part
0
50
Perc
400
300
200
100
Subgroup 0
1000
900
800
700
Individual
Value
1
1
6
1
6
1
6
2
2
2 4
1
4
1
2
5
1
1 1
6
1 1
2
2
2
2
6
6
6
2
2
6
6
2
2
2
2
5
5
Mean=832.5
UCL=899.2
LCL=765.8
150
100
50
0
Moving
Range
1
2
2
1
2
2
2
2
2
2
1
1
1
1
1
1
1
1
1
1
2
2
2
1
2
2
R=25.08
UCL=81.95
LCL=0
I and MR Chart for TSA (t)
2002 Historical
Process
Results with
Range = 25.08
Calc for pt to pt
MSA Study Results
with Range = 17.92,
Calc for Subgroup
When comparing the MSA with process operation, a large
percentage of pt-to-pt variation is MS error (70%) --- a
back check of proper test sample selection
slide 24
CTQ1 MSA Study Results – Process Linkage
Site 2 Example
Use Power and Sample Size Calculator with and without impact
of MS variation. Lack of clarity in process improvement work,
results in missed opportunity for improvement and continued
use of non-optimal parameters

Key issue for Process Improvement Efforts is “When will we see
change?”
 Initial Improvements to A1 process were made
 Control Plan Improvements to A1 process were initiated
 Site 2 Baseline Values were higher than other sites
 Small step changes in mean and reduction in variation will achieve goal

How can Site 2 see small, real change with a Measurement System with
70+% GR&R?
slide 25
CTQ1 MSA Study Results – Process Linkage
Site 2 Example
Simulated Reduction of Pt to Pt variation by 70% decreases
time to observe savings by over 9X.
2-Sample t Test
Alpha = 0.05 Sigma = 22.23
Sample Target Actual
Difference Size Power Power
2 2117 0.9000 0.9000
4 530 0.9000 0.9002
6 236 0.9000 0.9002
8 133 0.9000 0.9001
10 86 0.9000 0.9020
12 60 0.9000 0.9023
14 44 0.9000 0.9007
16 34 0.9000 0.9018
18 27 0.9000 0.9017
20 22 0.9000 0.9016
2-Sample t Test
Alpha = 0.05 Sigma = 6.67
Sample Target Actual
Difference Size Power Power
2 192 0.9000 0.9011
4 49 0.9000 0.9036
6 22 0.9000 0.9015
8 13 0.9000 0.9074
10 9 0.9000 0.9188
12 7 0.9000 0.9361
14 5 0.9000 0.9156
16 4 0.9000 0.9091
18 4 0.9000 0.9555
20 3 0.9000 0.9095
slide 26
CTQ1 MSA Study Results – Process Linkage
Site 2 Example
Benefits of An Improved MS

Realized Savings for a Process Improvement Effort
 For A1, an increase of 1 number of CTQ1 is approximately $1 per ton
 Change of 10 numbers, 1000 Tons produced in 1 month (832  842)
 $1 * 10 * 1000 = $10,000

More trust in all laboratory numbers for CTQ1

Ability to make process changes earlier with R-bar at 6.67
 Previously, it would be pointless to make any process changes within the 22 point
range. Would you really see the change?

As the Six Sigma team pushes the CTQ1 value higher, DOEs and other
tools will have greater benefit
slide 27
Objectives

The Hidden Factory Concept
 What is a Hidden Factory?
 What is a Measurement System’s Role in the Hidden
Factory?

Review Key Measurement System metrics including
%GR&R and P/T ratio

Case Study at W. R. GRACE
 Measurement Study Set-up and Minitab Analysis
 Linkage to Process
 Benefits of an Improved Measurement System

How to Improve Measurement Systems in an
Organization
slide 28
Measurement Improvement in the Organization

Initial efforts for MS improvement are driven on a BB/GB project basis
 Six Sigma Black Belts and Green Belts Perform MSAs during Project Work
 Lab Managers and Technicians are Part of Six Sigma Teams
 Measurement Systems are Improved as Six Sigma Projects are Completed

Intermediate efforts have general Operations training for lab personnel,
mostly laboratory management
 Lab efficiency and machine set-up projects are started
 The %GR&R concept has not reached the technician level

Current efforts enhance technician level knowledge and dramatically
increase the number of MS projects
 MS Task Force initiated (3 BBs lead effort)
 Develop Six Sigma Analytical GB training
 All MS projects are chartered and reviewed; All students have a project
 Division-wide database of all MS results is implemented
slide 29
Measurement Improvement in the Organization

Develop common methodology for Analytical GB training
slide 30
Final Thoughts

The Hidden Factory is explored throughout all Six Sigma programs

One area of the Hidden Factory in Production Environments is
Measurement Systems

Simply utilizing Operations Black Belts and Green Belts to improve
Measurement Systems on a project by project basis is not the long term
answer

The GRACE Six Sigma organization is driving Measurement System
Improvement through:
 Tailored training to Analytical Resources
 Similar Six Sigma review and project protocol
 Communication to the entire organization regarding Measurement System
performance
 As in the case study, attaching business/cost implications to poorly performing
measurement systems

MSA with Six Sigma explained with best practices.ppt

  • 1.
    slide 1 Six Sigmain Measurement Systems: Evaluating the Hidden Factory Scrap Scrap Rework Rework Hidden Factory NOT OK Operation Operation Inputs Inputs Inspect Inspect First Time First Time Correct Correct OK Time, cost, people Bill Rodebaugh Director, Six Sigma GRACE
  • 2.
    slide 2 Objectives  The HiddenFactory Concept  What is a Hidden Factory?  What is a Measurement System’s Role in the Hidden Factory?  Review Key Measurement System metrics including %GR&R and P/T ratio  Case Study at W. R. GRACE  Measurement Study Set-up and Minitab Analysis  Linkage to Process  Benefits of an Improved Measurement System  How to Improve Measurement Systems in an Organization
  • 3.
    slide 3 The HiddenFactory -- Process/Production Scrap Scrap Rework Rework Hidden Factory NOT OK Operation Operation Inputs Inputs Inspect Inspect First Time First Time Correct Correct OK Time, cost, people •What Comprises the Hidden Factory in a Process/Production Area? •Reprocessed and Scrap materials -- First time out of spec, not reworkable •Over-processed materials -- Run higher than target with higher than needed utilities or reagents •Over-analyzed materials -- High Capability, but multiple in-process samples are run, improper SPC leading to over-control
  • 4.
    slide 4 The HiddenFactory -- Measurement Systems Waste Waste Re-test Re-test Hidden Factory NOT OK Lab Work Lab Work Sample Sample Inputs Inputs Inspect Inspect Production Production OK Time, cost, people •What Comprises the Hidden Factory in a Laboratory Setting? •Incapable Measurement Systems -- purchased, but are unusable due to high repeatability variation and poor discrimination •Repetitive Analysis -- Test that runs with repeats to improve known variation or to unsuccessfully deal with overwhelming sampling issues •Laboratory “Noise” Issues -- Lab Tech to Lab Tech Variation, Shift to Shift Variation, Machine to Machine Variation, Lab to Lab Variation
  • 5.
    slide 5 The HiddenFactory Linkage  Production Environments generally rely upon in- process sampling for adjustment  As Processes attain Six Sigma performance they begin to rely less on sampling and more upon leveraging the few influential X variables  The few influential X variables are determined largely through multi-vari studies and Design of Experimentation (DOE)  Good multi-vari and DOE results are based upon acceptable measurement analysis
  • 6.
    slide 6 Objectives  The HiddenFactory Concept  What is a Hidden Factory?  What is a Measurement System’s Role in the Hidden Factory?  Review Key Measurement System metrics including %GR&R and P/T ratio  Case Study at W. R. GRACE  Measurement Study Set-up and Minitab Analysis  Linkage to Process  Benefits of an Improved Measurement System  How to Improve Measurement Systems in an Organization
  • 7.
    slide 7 Possible Sourcesof Process Variation We will look at “repeatability” and “reproducibility” as primary contributors to measurement error Stability Linearity Long-term Process Variation Short-term Process Variation Variation w/i sample Actual Process Variation Repeatability Calibration Variation due to gage Variation due to operators Measurement Variation Observed Process Variation System t Measuremen 2 ocess l Actua 2 ocess Observed 2      Pr Pr ity producibil 2 y peatabilit 2 System t Measuremen 2 Re Re     
  • 8.
    slide 8 110 100 90 80 70 60 50 40 30 15 10 5 0 Observed Frequency LSL USL Actual Actualprocess variation - No No measurement error Observed Observed process variation - With With measurement error 110 100 90 80 70 60 50 40 30 15 10 5 0 Process Frequency LSL USL How Does Measurement Error Appear?
  • 9.
    slide 9 Measurement SystemTerminology  Discrimination - Smallest detectable increment between two measured values  Accuracy related terms  True value - Theoretically correct value  Bias - Difference between the average value of all measurements of a sample and the true value for that sample  Precision related terms  Repeatability - Variability inherent in the measurement system under constant conditions  Reproducibility - Variability among measurements made under different conditions (e.g. different operators, measuring devices, etc.)  Stability - distribution of measurements that remains constant and predictable over time for both the mean and standard deviation  Linearity - A measure of any change in accuracy or precision over the range of instrument capability
  • 10.
    slide 10 Measurement CapabilityIndex - P/T  Precision to Tolerance Ratio  Addresses what percent of the tolerance percent of the tolerance is taken up by measurement error  Includes both repeatability and reproducibility  Operator x Unit x Trial experiment  Best case: 10% Acceptable: 30% Usually expressed as percent P T Tolerance MS / . *  515  Note: 5.15 standard deviations accounts for 99% of Measurement System (MS) variation. The use of 5.15 is an industry standard.
  • 11.
    slide 11 Measurement CapabilityIndex - % GR&R  Addresses what percent of the Observed Process Variation percent of the Observed Process Variation is taken up by measurement error  %R&R is the best estimate of the effect of measurement systems on the validity of process improvement studies (DOE)  Includes both repeatability and reproducibility  As a target, look for %R&R < 30% Usually expressed as percent 100 x R R Variation ocess Observed MS Pr & %   
  • 12.
    slide 12 Objectives  The HiddenFactory Concept  What is a Hidden Factory?  What is a Measurement System’s Role in the Hidden Factory?  Review Key Measurement System metrics including %GR&R and P/T ratio  Case Study at W. R. GRACE  Measurement Study Set-up and Minitab Analysis  Linkage to Process  Benefits of an Improved Measurement System  How to Improve Measurement Systems in an Organization
  • 13.
    slide 13 Case StudyBackground  Internal Raw Material, A1, is necessary for Final Product production  Expensive Raw Material to produce – produced at 4 locations Worldwide  Cost savings can be derived directly from improved product quality, CpKs  Internal specifications indirectly linked to financial targets for production costs are used to calculate CpKs  If CTQ1 of A1 is too low, then more A1 material is added to achieve overall quality – higher quality means less quantity is needed – this is the project objective  High Impact Six Sigma project was chartered to improve an important quality variable, CTQ1  The measurement of CTQ1 was originally not questioned, but the team decided to study the effectiveness of this measurement  The %GR&R, P/T ratio, and Bias were studied  Each of the Worldwide locations were involved in the study  Initial project improvements have somewhat equalized performance across sites. Small level improvements are masked by the measurement effectiveness of CTQ1
  • 14.
    slide 14 CTQ1 MSAStudy Design (Crossed) Site 1 Lab 6 analyses/site/sample 2 samples taken from each site 2*4 Samples should be representative Each site analyzes other site’s sample. Each plant does 48 analyses 6*8*4=196 analyses Site 1 Sample 1 Site 1 Sample 2 Op 1 Op 2 Op 3 T1 T2 Site 2 Lab Site 3 Lab Site 4 Lab Site 2 Sample 1…..
  • 15.
    slide 15 CTQ1 MSAStudy Results (Minitab Output) Gage name: Date of study: Reported by: Tolerance: Misc: Z-14 MSA JULY 2002 All Labs 110 0 750 800 850 900 CB1 CB2 CB3 LC1 LC2 LC3 V1 V2 V3 W1 W2 W3 Xbar Chart by Operator Sample Mean Mean=821.3 UCL=851.5 LCL=791.1 0 0 50 100 CB1 CB2 CB3 LC1 LC2 LC3 V1 V2 V3 W1 W2 W3 R Chart by Operator Sample Range R=16.05 UCL=52.45 LCL=0 1 2 3 4 5 6 7 8 800 850 900 Sample Operator Operator*Sample Interaction Average CB1 CB2 CB3 LC1 LC2 LC3 V1 V2 V3 W1 W2 CB1 CB2 CB3 LC1 LC2 LC3 V1 V2 V3 W1 W2 W3 740 790 840 890 Oper Response By Operator 1 2 3 4 5 6 7 8 740 790 840 890 Sample Response By Sample %Contribution %Study Var %Tolerance Gage R&R Repeat Reprod Part-to-Part 0 20 40 60 80 100 120 Components of Variation Percent Surface Area
  • 16.
    slide 16 CTQ1 MSAStudy Results (Minitab Session) Source DF SS MS F P Sample 7 14221 2031.62 5.0079 0.00010 Operator 11 53474 4861.27 11.9829 0.00000 Operator*Sample 77 31238 405.68 1.4907 0.03177 Repeatability 96 26125 272.14 Total 191 125058 %Contribution Source VarComp (of VarComp) Total Gage R&R 617.39 90.11 Repeatability 272.14 39.72 Reproducibility 345.25 50.39 Operator 278.47 40.65 Operator*Sample 66.77 9.75 Part-To-Part 67.75 9.89 Sample, Operator, & Interaction are Significant
  • 17.
    slide 17 CTQ1 MSAStudy Results Site %GRR P/T Ratio R-bar Equal Variances within Groups Mean Differences (Tukey Comp.) All 94.3 (78.6 – 100)* 116 16.05 No (0.004) Only 1,2 No Diff. Site 1 38.9 (30.0 – 47.6) 29 7.22 Yes (0.739) All Pairs No Diff. Site 2 91.0 (70.7 – 100) 96 17.92 Yes (0.735) Only 1,2 Diff. Site 3 80.0 (60.8 – 94.8) 79 20.37 Yes (0.158) All Pairs No Diff. Site 4 98.0 (64.8 – 100) 120 18.67 Yes (0.346) Only 2,3 No Diff. *Conf Int not calculated with Minitab, Based upon R&R Std Dev
  • 18.
    slide 18 CTQ1 MSAStudy Results (Minitab Output) WO SA VF SA LC SA CB SA 890 840 790 740 C17 C16 Dotplots of C16 by C17 (group means are indicated by lines) Site 1 Site 2 Site 3 Site 4 Dotplot of All Samples over All Sites
  • 19.
    slide 19 CTQ1 MSAStudy Results (Minitab Session) Analysis of Variance for Site Source DF SS MS F P Site 3 37514 12505 26.86 0.000 Error 188 87518 466 Total 191 125032 Individual 95% CIs For Mean Based on Pooled StDev Level N Mean StDev -+---------+---------+---------+----- Site 1 48 824.57 15.38 (---*---) Site 2 48 819.42 22.11 (---*---) Site 3 48 800.98 20.75 (---*---) Site 4 48 840.13 26.58 (---*---) -+---------+---------+---------+----- Pooled StDev = 21.58 795 810 825 840 Site and Operator are closely related
  • 20.
    slide 20 CTQ1 MSAStudy Results (Minitab Output) X-bar R of All Samples for All Sites 0 750 800 850 900 CB1 CB2 CB3 LC1 LC2 LC3 V1 V2 V3 W1 W2 W3 Xbar Chart by Operator Sample Mean Mean=821.3 UCL=851.5 LCL=791.1 0 0 50 100 CB1 CB2 CB3 LC1 LC2 LC3 V1 V2 V3 W1 W2 W3 R Chart by Operator Sample Range R=16.05 UCL=52.45 LCL=0 1 800 850 900 Sample O Average CB1 CB2 C 740 790 840 890 Oper 1 2 740 790 Sample Gage R&R Repeat Reprod Part-to-Part 0 20 40 Per Most of the samples are seen as “noise” Discrimination Index is “0”, however can probably see differences of 5
  • 21.
    slide 21 CTQ1 MSAStudy Results (Minitab Output) •Mean differences are seen in X-bar area •Most of the samples are seen as “noise” 0 800 850 900 W1 W2 W3 Xbar Chart by WO OP Sample Mean Mean=840.1 UCL=875.2 LCL=805.0 0 0 10 20 30 40 50 60 70 W1 W2 W3 R Chart by WO OP Sample Range R=18.67 UCL=60.99 LCL=0 Gage R&R Repeat Reprod Part-to-Part 0 50 Pe X-bar R of All Samples for Site 4
  • 22.
    slide 22 CTQ1 MSAStudy Results – Process Linkage Site 2 Example 0 780 790 800 810 820 830 840 850 860 LC1 LC2 LC3 Xbar Chart by LC OP Sample Mean Mean=819.4 UCL=853.1 LCL=785.7 0 0 Sampl R=17.92 LCL=0 1 2 3 790 800 810 820 830 840 850 Sample LC OP*Sa Average LC1 760 LC OP 400 300 200 100 Subgroup 0 1000 900 800 700 Individual Value 1 1 6 1 6 1 6 2 2 2 4 1 4 1 2 5 1 1 1 6 1 1 2 2 2 2 6 6 6 2 2 6 6 2 2 2 2 5 5 Mean=832.5 UCL=899.2 LCL=765.8 150 100 g Range 1 1 1 1 1 1 1 1 1 1 1 1 1 UCL=81.95 I and MR Chart for TSA (t) 2002 Historical Process Results with Mean = 832.5 MSA Study Results with Mean = 819.4 Selected Samples are Representative
  • 23.
    slide 23 CTQ1 MSAStudy Results – Process Linkage Site 2 Example 0 780 790 800 810 820 830 840 850 860 LC1 LC2 LC3 Xbar Chart by LC OP Sample Mean Mean=819.4 UCL=853.1 LCL=785.7 0 0 50 100 LC1 LC2 LC3 R Chart by LC OP Sample Range R=17.92 UCL=58.54 LCL=0 1 2 3 4 5 6 7 8 790 800 810 820 830 840 850 Sample LC O LC OP*Sample Interaction Average L L L LC1 LC2 LC3 760 810 860 LC OP By LC OP 1 2 3 4 5 6 7 8 760 810 Sample Gage R&R Repeat Reprod Part-to-Part 0 50 Perc 400 300 200 100 Subgroup 0 1000 900 800 700 Individual Value 1 1 6 1 6 1 6 2 2 2 4 1 4 1 2 5 1 1 1 6 1 1 2 2 2 2 6 6 6 2 2 6 6 2 2 2 2 5 5 Mean=832.5 UCL=899.2 LCL=765.8 150 100 50 0 Moving Range 1 2 2 1 2 2 2 2 2 2 1 1 1 1 1 1 1 1 1 1 2 2 2 1 2 2 R=25.08 UCL=81.95 LCL=0 I and MR Chart for TSA (t) 2002 Historical Process Results with Range = 25.08 Calc for pt to pt MSA Study Results with Range = 17.92, Calc for Subgroup When comparing the MSA with process operation, a large percentage of pt-to-pt variation is MS error (70%) --- a back check of proper test sample selection
  • 24.
    slide 24 CTQ1 MSAStudy Results – Process Linkage Site 2 Example Use Power and Sample Size Calculator with and without impact of MS variation. Lack of clarity in process improvement work, results in missed opportunity for improvement and continued use of non-optimal parameters  Key issue for Process Improvement Efforts is “When will we see change?”  Initial Improvements to A1 process were made  Control Plan Improvements to A1 process were initiated  Site 2 Baseline Values were higher than other sites  Small step changes in mean and reduction in variation will achieve goal  How can Site 2 see small, real change with a Measurement System with 70+% GR&R?
  • 25.
    slide 25 CTQ1 MSAStudy Results – Process Linkage Site 2 Example Simulated Reduction of Pt to Pt variation by 70% decreases time to observe savings by over 9X. 2-Sample t Test Alpha = 0.05 Sigma = 22.23 Sample Target Actual Difference Size Power Power 2 2117 0.9000 0.9000 4 530 0.9000 0.9002 6 236 0.9000 0.9002 8 133 0.9000 0.9001 10 86 0.9000 0.9020 12 60 0.9000 0.9023 14 44 0.9000 0.9007 16 34 0.9000 0.9018 18 27 0.9000 0.9017 20 22 0.9000 0.9016 2-Sample t Test Alpha = 0.05 Sigma = 6.67 Sample Target Actual Difference Size Power Power 2 192 0.9000 0.9011 4 49 0.9000 0.9036 6 22 0.9000 0.9015 8 13 0.9000 0.9074 10 9 0.9000 0.9188 12 7 0.9000 0.9361 14 5 0.9000 0.9156 16 4 0.9000 0.9091 18 4 0.9000 0.9555 20 3 0.9000 0.9095
  • 26.
    slide 26 CTQ1 MSAStudy Results – Process Linkage Site 2 Example Benefits of An Improved MS  Realized Savings for a Process Improvement Effort  For A1, an increase of 1 number of CTQ1 is approximately $1 per ton  Change of 10 numbers, 1000 Tons produced in 1 month (832  842)  $1 * 10 * 1000 = $10,000  More trust in all laboratory numbers for CTQ1  Ability to make process changes earlier with R-bar at 6.67  Previously, it would be pointless to make any process changes within the 22 point range. Would you really see the change?  As the Six Sigma team pushes the CTQ1 value higher, DOEs and other tools will have greater benefit
  • 27.
    slide 27 Objectives  The HiddenFactory Concept  What is a Hidden Factory?  What is a Measurement System’s Role in the Hidden Factory?  Review Key Measurement System metrics including %GR&R and P/T ratio  Case Study at W. R. GRACE  Measurement Study Set-up and Minitab Analysis  Linkage to Process  Benefits of an Improved Measurement System  How to Improve Measurement Systems in an Organization
  • 28.
    slide 28 Measurement Improvementin the Organization  Initial efforts for MS improvement are driven on a BB/GB project basis  Six Sigma Black Belts and Green Belts Perform MSAs during Project Work  Lab Managers and Technicians are Part of Six Sigma Teams  Measurement Systems are Improved as Six Sigma Projects are Completed  Intermediate efforts have general Operations training for lab personnel, mostly laboratory management  Lab efficiency and machine set-up projects are started  The %GR&R concept has not reached the technician level  Current efforts enhance technician level knowledge and dramatically increase the number of MS projects  MS Task Force initiated (3 BBs lead effort)  Develop Six Sigma Analytical GB training  All MS projects are chartered and reviewed; All students have a project  Division-wide database of all MS results is implemented
  • 29.
    slide 29 Measurement Improvementin the Organization  Develop common methodology for Analytical GB training
  • 30.
    slide 30 Final Thoughts  TheHidden Factory is explored throughout all Six Sigma programs  One area of the Hidden Factory in Production Environments is Measurement Systems  Simply utilizing Operations Black Belts and Green Belts to improve Measurement Systems on a project by project basis is not the long term answer  The GRACE Six Sigma organization is driving Measurement System Improvement through:  Tailored training to Analytical Resources  Similar Six Sigma review and project protocol  Communication to the entire organization regarding Measurement System performance  As in the case study, attaching business/cost implications to poorly performing measurement systems