Downloaded 13 times
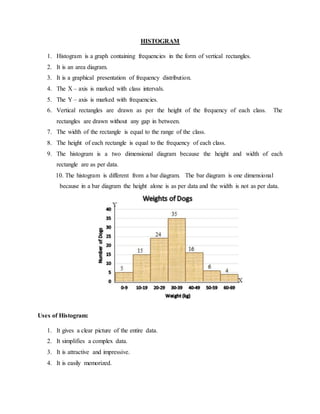

A histogram is a graph that uses vertical rectangles to show the frequency distribution of data across ranges of values or intervals. It displays frequencies on the y-axis and class intervals on the x-axis. Each rectangle's width represents a class interval, and its height shows the frequency of observations within that interval. Histograms simplify complex data and provide an easy way to visualize patterns and compare multiple data sets.


![Statistics -copy_-_copy[1]](https://cdn.slidesharecdn.com/ss_thumbnails/statistics-copy-copy1-150503082441-conversion-gate02-thumbnail.jpg?width=640&height=640&fit=bounds)