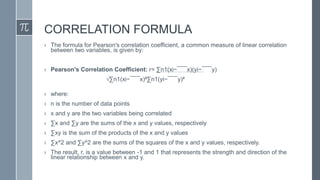
SECTION 5.
Understanding One Variable
and the Association of Two
Variables
› In many studies, we measure more than one variable for
each individual.
› For example, we measure precipitation and plant growth,
or number of young with nesting habitat, or soil erosion and
volume of water. We collect pairs of data and instead of
examining each variable separately (univariate data), we
want to find ways to describe bivariate data,
› in which two variables are measured on each subject in
our sample. Given such data, we begin by determining if
there is a relationship between these two variables.
› What are Correlation and Regression?
› Correlation and regression are statistical measurements
that are used to give a relationship between two variables.
For example, suppose a person is driving an expensive car
then it is assumed that she must be financially well. To
numerically quantify this relationship, correlation and
regression are used.
CORRELATION AND REGRESSION
› Correlation and regression are statistical techniques used
to study the relationship between two or more variables.
CORRELATION
› Correlation is a measure of the strength and direction of
the linear relationship between two variables. It ranges
from -1 to 1, where -1 represents a perfect negative
correlation (as one variable increases, the other
decreases), 1 represents a perfect positive correlation (as
one variable increases, so does the other), and 0
represents no correlation.
CORRELATION DEFINATION
Correlation can be defined as a measurement that is used to
quantify the relationship between variables. If an increase
(or decrease) in one variable causes a corresponding
increase (or decrease) in another then the two variables are
said to be directly correlated. Similarly, if an increase in one
causes a decrease in another or vice versa, then the
variables are said to be indirectly correlated. If a change in
an independent variable does not cause a change in the
dependent variable then they are uncorrelated. Thus,
correlation can be positive (direct correlation), negative
(indirect correlation), or zero. This relationship is given by
the correlation coefficient.
CORRELATION FORMULA
› The formula for Pearson's correlation coefficient, a common measure of linear correlation
between two variables, is given by:
› Pearson's Correlation Coefficient: r= ∑n1(xi−¯¯¯x)(yi−¯¯¯y)
√∑n1(xi−¯¯¯x)²∑n1(yi−¯¯¯y)²
› where:
› n is the number of data points
› x and y are the two variables being correlated
› ∑x and ∑y are the sums of the x and y values, respectively
› ∑xy is the sum of the products of the x and y values
› ∑x^2 and ∑y^2 are the sums of the squares of the x and y values, respectively.
› The result, r, is a value between -1 and 1 that represents the strength and direction of the
linear relationship between x and y.
Two Content Layout with Table
Class Group A Group B
Class 1 82 95
Class 2 76 88
Class 3 84 90
› First bullet point here
› Second bullet point here
› Third bullet point here
Two Content Layout with SmartArt
A
• Task 1
• Task 2
B
• Task 1
• Task 2
C
• Task 1
• Task 2
› First bullet point here
› Second bullet point here
› Third bullet point here
Add a Slide Title - 1
Add a Slide Title - 2
Add a Slide Title - 3
ADD A SLIDE
TITLE - 4
ADD A SLIDE
TITLE - 5

OUANTITATIVE METHODS report group 5.pptx

  • 1.
    SECTION 5. Understanding OneVariable and the Association of Two Variables
  • 2.
    › In manystudies, we measure more than one variable for each individual. › For example, we measure precipitation and plant growth, or number of young with nesting habitat, or soil erosion and volume of water. We collect pairs of data and instead of examining each variable separately (univariate data), we want to find ways to describe bivariate data, › in which two variables are measured on each subject in our sample. Given such data, we begin by determining if there is a relationship between these two variables.
  • 3.
    › What areCorrelation and Regression? › Correlation and regression are statistical measurements that are used to give a relationship between two variables. For example, suppose a person is driving an expensive car then it is assumed that she must be financially well. To numerically quantify this relationship, correlation and regression are used.
  • 4.
    CORRELATION AND REGRESSION ›Correlation and regression are statistical techniques used to study the relationship between two or more variables. CORRELATION › Correlation is a measure of the strength and direction of the linear relationship between two variables. It ranges from -1 to 1, where -1 represents a perfect negative correlation (as one variable increases, the other decreases), 1 represents a perfect positive correlation (as one variable increases, so does the other), and 0 represents no correlation.
  • 5.
    CORRELATION DEFINATION Correlation canbe defined as a measurement that is used to quantify the relationship between variables. If an increase (or decrease) in one variable causes a corresponding increase (or decrease) in another then the two variables are said to be directly correlated. Similarly, if an increase in one causes a decrease in another or vice versa, then the variables are said to be indirectly correlated. If a change in an independent variable does not cause a change in the dependent variable then they are uncorrelated. Thus, correlation can be positive (direct correlation), negative (indirect correlation), or zero. This relationship is given by the correlation coefficient.
  • 7.
    CORRELATION FORMULA › Theformula for Pearson's correlation coefficient, a common measure of linear correlation between two variables, is given by: › Pearson's Correlation Coefficient: r= ∑n1(xi−¯¯¯x)(yi−¯¯¯y) √∑n1(xi−¯¯¯x)²∑n1(yi−¯¯¯y)² › where: › n is the number of data points › x and y are the two variables being correlated › ∑x and ∑y are the sums of the x and y values, respectively › ∑xy is the sum of the products of the x and y values › ∑x^2 and ∑y^2 are the sums of the squares of the x and y values, respectively. › The result, r, is a value between -1 and 1 that represents the strength and direction of the linear relationship between x and y.
  • 8.
    Two Content Layoutwith Table Class Group A Group B Class 1 82 95 Class 2 76 88 Class 3 84 90 › First bullet point here › Second bullet point here › Third bullet point here
  • 9.
    Two Content Layoutwith SmartArt A • Task 1 • Task 2 B • Task 1 • Task 2 C • Task 1 • Task 2 › First bullet point here › Second bullet point here › Third bullet point here
  • 10.
    Add a SlideTitle - 1
  • 11.
    Add a SlideTitle - 2
  • 12.
    Add a SlideTitle - 3
  • 14.
  • 15.