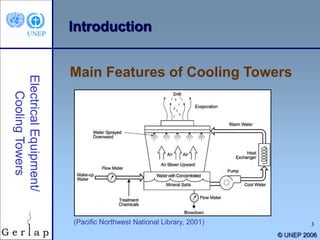
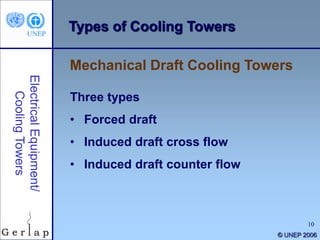
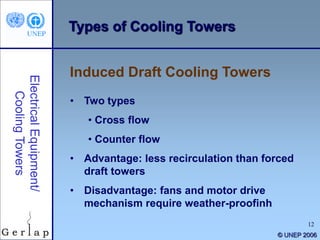
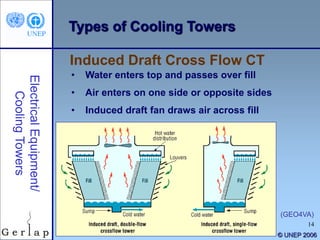
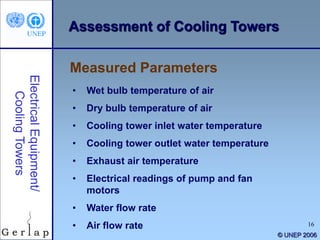
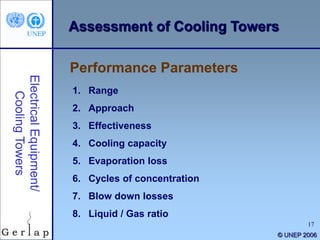
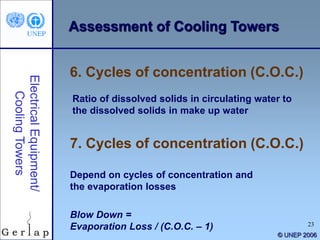
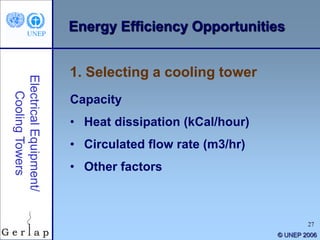
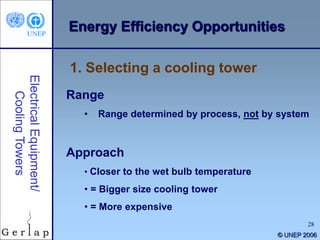
1
Training Session on Energy
Equipment
Cooling Towers
Presentation from the
“Energy Efficiency Guide for Industry in Asia”
www.energyefficiencyasia.org
© UNEP 2006
2
© UNEP 2006
Training Agenda: Cooling Towers
Introduction
Types of cooling towers
Assessment of cooling towers
Energy efficiency opportunities
3
© UNEP 2006
Introduction
Main Features of Cooling Towers
(Pacific Northwest National Library, 2001)
4
© UNEP 2006
Introduction
• Frame and casing: support exterior
enclosures
• Fill: facilitate heat transfer by
maximizing water / air contact
• Splash fill
• Film fill
• Cold water basin: receives water at
bottom of tower
Components of a cooling tower
5
© UNEP 2006
Introduction
• Drift eliminators: capture droplets in
air stream
• Air inlet: entry point of air
• Louvers: equalize air flow into the fill
and retain water within tower
• Nozzles: spray water to wet the fill
• Fans: deliver air flow in the tower
Components of a cooling tower
6
© UNEP 2006
Training Agenda: Cooling Towers
Introduction
Types of cooling towers
Assessment of cooling towers
Energy efficiency opportunities
7
© UNEP 2006
Types of Cooling Towers
• Hot air moves through tower
• Fresh cool air is drawn into the
tower from bottom
• No fan required
• Concrete tower <200 m
• Used for large heat duties
Natural Draft Cooling Towers
8
© UNEP 2006
Types of Cooling Towers
Natural Draft Cooling Towers
(Gulf Coast Chemical Commercial Inc.)
Cross flow
• Air drawn across
falling water
• Fill located
outside tower
Counter flow
• Air drawn up
through falling
water
• Fill located
inside tower
9
© UNEP 2006
Types of Cooling Towers
• Large fans to force air through
circulated water
• Water falls over fill surfaces:
maximum heat transfer
• Cooling rates depend on many
parameters
• Large range of capacities
• Can be grouped, e.g. 8-cell tower
Mechanical Draft Cooling Towers
10
© UNEP 2006
Types of Cooling Towers
Three types
• Forced draft
• Induced draft cross flow
• Induced draft counter flow
Mechanical Draft Cooling Towers
11
© UNEP 2006
Types of Cooling Towers
• Air blown through tower
by centrifugal fan at air
inlet
• Advantages: suited for
high air resistance & fans
are relatively quiet
• Disadvantages:
recirculation due to high
air-entry and low air-exit
velocities
Forced Draft Cooling Towers
(GEO4VA)
12
© UNEP 2006
Types of Cooling Towers
• Two types
• Cross flow
• Counter flow
• Advantage: less recirculation than forced
draft towers
• Disadvantage: fans and motor drive
mechanism require weather-proofinh
Induced Draft Cooling Towers
13
© UNEP 2006
Types of Cooling Towers
• Hot water enters at the top
• Air enters at bottom and exits at top
• Uses forced and induced draft fans
Induced Draft Counter Flow CT
(GEO4VA)
14
© UNEP 2006
Types of Cooling Towers
• Water enters top and passes over fill
• Air enters on one side or opposite sides
• Induced draft fan draws air across fill
Induced Draft Cross Flow CT
(GEO4VA)
15
© UNEP 2006
Training Agenda: Cooling Towers
Introduction
Types of cooling towers
Assessment of cooling towers
Energy efficiency opportunities
16
© UNEP 2006
Assessment of Cooling Towers
Measured Parameters
• Wet bulb temperature of air
• Dry bulb temperature of air
• Cooling tower inlet water temperature
• Cooling tower outlet water temperature
• Exhaust air temperature
• Electrical readings of pump and fan
motors
• Water flow rate
• Air flow rate
17
© UNEP 2006
Performance Parameters
1. Range
2. Approach
3. Effectiveness
4. Cooling capacity
5. Evaporation loss
6. Cycles of concentration
7. Blow down losses
8. Liquid / Gas ratio
Assessment of Cooling Towers
18
© UNEP 2006
1. Range
Difference between
cooling water inlet and
outlet temperature:
Range (°C) = CW inlet
temp – CW outlet temp
High range = good
performance
RangeApproach
Hot Water Temperature (In)
Cold Water Temperature (Out)
Wet Bulb Temperature (Ambient)
(In) to the Tower
(Out) from the
Tower
Assessment of Cooling Towers
19
© UNEP 2006
2. Approach
Difference between
cooling tower outlet cold
water temperature and
ambient wet bulb
temperature:
Approach (°C) =
CW outlet temp – Wet
bulb temp
Low approach = good
performance
RangeApproach
Hot Water Temperature (In)
Cold Water Temperature
(Out)
Wet Bulb Temperature
(Ambient)
(In) to the Tower
(Out) from the
Tower
Assessment of Cooling Towers
20
© UNEP 2006
3. Effectiveness
Effectiveness in %
= Range / (Range +
Approach)
= 100 x (CW temp – CW
out temp) / (CW in
temp – Wet bulb temp)
High effectiveness =
good performance
RangeApproach
Hot Water Temperature (In)
Cold Water Temperature
(Out)
Wet Bulb Temperature
(Ambient)
(In) to the Tower
(Out) from the
Tower
Assessment of Cooling Towers
21
© UNEP 2006
4. Cooling Capacity
Heat rejected in kCal/hr
or tons of refrigeration
(TR)
= mass flow rate of water
X specific heat X
temperature difference
High cooling capacity =
good performance
RangeApproach
Hot Water Temperature (In)
Cold Water Temperature
(Out)
Wet Bulb Temperature
(Ambient)
(In) to the Tower
(Out) from the
Tower
Assessment of Cooling Towers
22
© UNEP 2006
5. Evaporation Loss
Water quantity (m3/hr)
evaporated for cooling duty
= theoretically, 1.8 m3 for
every 10,000,000 kCal heat
rejected
= 0.00085 x 1.8 x circulation
rate (m3/hr) x (T1-T2)
T1-T2 = Temp. difference
between inlet and outlet water
RangeApproach
Hot Water Temperature
(In)
Cold Water Temperature
(Out)
Wet Bulb Temperature
(Ambient)
(In) to the Tower
(Out) from the
Tower
Assessment of Cooling Towers
23
© UNEP 2006
6. Cycles of concentration (C.O.C.)
Ratio of dissolved solids in circulating water to
the dissolved solids in make up water
Depend on cycles of concentration and
the evaporation losses
Blow Down =
Evaporation Loss / (C.O.C. – 1)
7. Cycles of concentration (C.O.C.)
Assessment of Cooling Towers
24
© UNEP 2006
8. Liquid Gas (L/G) Ratio
Ratio between water and air mass flow rates
Heat removed from the water must be equal to
the heat absorbed by the surrounding air
L(T1 – T2) = G(h2 – h1)
L/G = (h2 – h1) / (T1 – T2)
T1 = hot water temp (oC)
T2 = cold water temp (oC)
Enthalpy of air water vapor mixture at inlet wet bulb temp (h1)
and outlet wet bulb temp (h2)
Assessment of Cooling Towers
25
© UNEP 2006
Training Agenda: Cooling Towers
Introduction
Types of cooling towers
Assessment of cooling towers
Energy efficiency opportunities
26
© UNEP 2006
Energy Efficiency Opportunities
1. Selecting a cooling tower
2. Fills
3. Pumps and water distribution
4. Fans and motors
27
© UNEP 2006
Energy Efficiency Opportunities
1. Selecting a cooling tower
Capacity
• Heat dissipation (kCal/hour)
• Circulated flow rate (m3/hr)
• Other factors
28
© UNEP 2006
Energy Efficiency Opportunities
Range
• Range determined by process, not by system
Approach
• Closer to the wet bulb temperature
• = Bigger size cooling tower
• = More expensive
1. Selecting a cooling tower
29
© UNEP 2006
Energy Efficiency Opportunities
Heat Load
• Determined by process
• Required cooling is controlled by the
desired operating temperature
• High heat load = large size and cost
of cooling tower
1. Selecting a cooling tower
30
© UNEP 2006
Energy Efficiency Opportunities
Wet bulb temperature – considerations:
• Water is cooled to temp higher than wet bulb
temp
• Conditions at tower site
• Not to exceed 5% of design wet bulb temp
• Is wet bulb temp specified as ambient (preferred)
or inlet
• Can tower deal with increased wet bulb temp
• Cold water to exchange heat
1. Selecting a cooling tower
31
© UNEP 2006
Energy Efficiency Opportunities
Relationship range, flow and heat load
• Range increases with increased
• Amount circulated water (flow)
• Heat load
• Causes of range increase
• Inlet water temperature increases
• Exit water temperature decreases
• Consequence = larger tower
1. Selecting a cooling tower
32
© UNEP 2006
Energy Efficiency Opportunities
Relationship Approach and Wet bulb
temperature
• If approach stays the same (e.g. 4.45 oC)
• Higher wet bulb temperature (26.67 oC)
= more heat picked up (15.5 kCal/kg air)
= smaller tower needed
• Lower wet bulb temperature (21.11 oC)
= less heat picked up (12.1 kCal/kg air)
= larger tower needed
1. Selecting a cooling tower
33
© UNEP 2006
Energy Efficiency Opportunities
• Hot water distributed over fill media
and cools down through evaporation
• Fill media impacts electricity use
• Efficiently designed fill media reduces pumping
costs
• Fill media influences heat exchange: surface
area, duration of contact, turbulence
2. Fill media
34
© UNEP 2006
Energy Efficiency Opportunities
Comparing 3 fill media: film fill more
efficient
Splash Fill Film Fill Low Clog
Film Fill
Possible L/G Ratio 1.1 – 1.5 1.5 – 2.0 1.4 – 1.8
Effective Heat Exchange
Area
30 – 45
m2/m3
150 m2/m3 85 - 100 m2/m3
Fill Height Required 5 – 10 m 1.2 – 1.5 m 1.5 – 1.8 m
Pumping Head
Requirement
9 – 12 m 5 – 8 m 6 – 9 m
Quantity of Air Required High Much Low Low
2. Fill media
(BEE India, 2004; Ramarao; and Shivaraman)
35
© UNEP 2006
Energy Efficiency Opportunities
3. Pumps and water distribution
• Pumps: see pumps session
• Optimize cooling water treatment
• Increase cycles of concentration (COC) by
cooling water treatment helps reduce make
up water
• Indirect electricity savings
• Install drift eliminators
• Reduce drift loss from 0.02% to only 0.003 –
0.001%
36
© UNEP 2006
Energy Efficiency Opportunities
4. Cooling Tower Fans
• Fans must overcome system
resistance, pressure loss: impacts
electricity use
• Fan efficiency depends on blade
profile
• Replace metallic fans with FBR blades (20-
30% savings)
• Use blades with aerodynamic profile (85-92%
fan efficiency)
37
Training Session on Energy
Equipment
Cooling Towers
THANK YOU
FOR YOU ATTENTION
© UNEP 2006

38
© UNEP 2006
Disclaimer and References
• This PowerPoint training session was prepared as part of
the project “Greenhouse Gas Emission Reduction from
Industry in Asia and the Pacific” (GERIAP). While
reasonable efforts have been made to ensure that the
contents of this publication are factually correct and
properly referenced, UNEP does not accept responsibility for
the accuracy or completeness of the contents, and shall not
be liable for any loss or damage that may be occasioned
directly or indirectly through the use of, or reliance on, the
contents of this publication. © UNEP, 2006.
• The GERIAP project was funded by the Swedish
International Development Cooperation Agency (Sida)
• Full references are included in the textbook chapter that is
available on www.energyefficiencyasia.org

Cooling tower

  • 1.
    1 Training Session onEnergy Equipment Cooling Towers Presentation from the “Energy Efficiency Guide for Industry in Asia” www.energyefficiencyasia.org © UNEP 2006
  • 2.
    2 © UNEP 2006 TrainingAgenda: Cooling Towers Introduction Types of cooling towers Assessment of cooling towers Energy efficiency opportunities
  • 3.
    3 © UNEP 2006 Introduction MainFeatures of Cooling Towers (Pacific Northwest National Library, 2001)
  • 4.
    4 © UNEP 2006 Introduction •Frame and casing: support exterior enclosures • Fill: facilitate heat transfer by maximizing water / air contact • Splash fill • Film fill • Cold water basin: receives water at bottom of tower Components of a cooling tower
  • 5.
    5 © UNEP 2006 Introduction •Drift eliminators: capture droplets in air stream • Air inlet: entry point of air • Louvers: equalize air flow into the fill and retain water within tower • Nozzles: spray water to wet the fill • Fans: deliver air flow in the tower Components of a cooling tower
  • 6.
    6 © UNEP 2006 TrainingAgenda: Cooling Towers Introduction Types of cooling towers Assessment of cooling towers Energy efficiency opportunities
  • 7.
    7 © UNEP 2006 Typesof Cooling Towers • Hot air moves through tower • Fresh cool air is drawn into the tower from bottom • No fan required • Concrete tower <200 m • Used for large heat duties Natural Draft Cooling Towers
  • 8.
    8 © UNEP 2006 Typesof Cooling Towers Natural Draft Cooling Towers (Gulf Coast Chemical Commercial Inc.) Cross flow • Air drawn across falling water • Fill located outside tower Counter flow • Air drawn up through falling water • Fill located inside tower
  • 9.
    9 © UNEP 2006 Typesof Cooling Towers • Large fans to force air through circulated water • Water falls over fill surfaces: maximum heat transfer • Cooling rates depend on many parameters • Large range of capacities • Can be grouped, e.g. 8-cell tower Mechanical Draft Cooling Towers
  • 10.
    10 © UNEP 2006 Typesof Cooling Towers Three types • Forced draft • Induced draft cross flow • Induced draft counter flow Mechanical Draft Cooling Towers
  • 11.
    11 © UNEP 2006 Typesof Cooling Towers • Air blown through tower by centrifugal fan at air inlet • Advantages: suited for high air resistance & fans are relatively quiet • Disadvantages: recirculation due to high air-entry and low air-exit velocities Forced Draft Cooling Towers (GEO4VA)
  • 12.
    12 © UNEP 2006 Typesof Cooling Towers • Two types • Cross flow • Counter flow • Advantage: less recirculation than forced draft towers • Disadvantage: fans and motor drive mechanism require weather-proofinh Induced Draft Cooling Towers
  • 13.
    13 © UNEP 2006 Typesof Cooling Towers • Hot water enters at the top • Air enters at bottom and exits at top • Uses forced and induced draft fans Induced Draft Counter Flow CT (GEO4VA)
  • 14.
    14 © UNEP 2006 Typesof Cooling Towers • Water enters top and passes over fill • Air enters on one side or opposite sides • Induced draft fan draws air across fill Induced Draft Cross Flow CT (GEO4VA)
  • 15.
    15 © UNEP 2006 TrainingAgenda: Cooling Towers Introduction Types of cooling towers Assessment of cooling towers Energy efficiency opportunities
  • 16.
    16 © UNEP 2006 Assessmentof Cooling Towers Measured Parameters • Wet bulb temperature of air • Dry bulb temperature of air • Cooling tower inlet water temperature • Cooling tower outlet water temperature • Exhaust air temperature • Electrical readings of pump and fan motors • Water flow rate • Air flow rate
  • 17.
    17 © UNEP 2006 PerformanceParameters 1. Range 2. Approach 3. Effectiveness 4. Cooling capacity 5. Evaporation loss 6. Cycles of concentration 7. Blow down losses 8. Liquid / Gas ratio Assessment of Cooling Towers
  • 18.
    18 © UNEP 2006 1.Range Difference between cooling water inlet and outlet temperature: Range (°C) = CW inlet temp – CW outlet temp High range = good performance RangeApproach Hot Water Temperature (In) Cold Water Temperature (Out) Wet Bulb Temperature (Ambient) (In) to the Tower (Out) from the Tower Assessment of Cooling Towers
  • 19.
    19 © UNEP 2006 2.Approach Difference between cooling tower outlet cold water temperature and ambient wet bulb temperature: Approach (°C) = CW outlet temp – Wet bulb temp Low approach = good performance RangeApproach Hot Water Temperature (In) Cold Water Temperature (Out) Wet Bulb Temperature (Ambient) (In) to the Tower (Out) from the Tower Assessment of Cooling Towers
  • 20.
    20 © UNEP 2006 3.Effectiveness Effectiveness in % = Range / (Range + Approach) = 100 x (CW temp – CW out temp) / (CW in temp – Wet bulb temp) High effectiveness = good performance RangeApproach Hot Water Temperature (In) Cold Water Temperature (Out) Wet Bulb Temperature (Ambient) (In) to the Tower (Out) from the Tower Assessment of Cooling Towers
  • 21.
    21 © UNEP 2006 4.Cooling Capacity Heat rejected in kCal/hr or tons of refrigeration (TR) = mass flow rate of water X specific heat X temperature difference High cooling capacity = good performance RangeApproach Hot Water Temperature (In) Cold Water Temperature (Out) Wet Bulb Temperature (Ambient) (In) to the Tower (Out) from the Tower Assessment of Cooling Towers
  • 22.
    22 © UNEP 2006 5.Evaporation Loss Water quantity (m3/hr) evaporated for cooling duty = theoretically, 1.8 m3 for every 10,000,000 kCal heat rejected = 0.00085 x 1.8 x circulation rate (m3/hr) x (T1-T2) T1-T2 = Temp. difference between inlet and outlet water RangeApproach Hot Water Temperature (In) Cold Water Temperature (Out) Wet Bulb Temperature (Ambient) (In) to the Tower (Out) from the Tower Assessment of Cooling Towers
  • 23.
    23 © UNEP 2006 6.Cycles of concentration (C.O.C.) Ratio of dissolved solids in circulating water to the dissolved solids in make up water Depend on cycles of concentration and the evaporation losses Blow Down = Evaporation Loss / (C.O.C. – 1) 7. Cycles of concentration (C.O.C.) Assessment of Cooling Towers
  • 24.
    24 © UNEP 2006 8.Liquid Gas (L/G) Ratio Ratio between water and air mass flow rates Heat removed from the water must be equal to the heat absorbed by the surrounding air L(T1 – T2) = G(h2 – h1) L/G = (h2 – h1) / (T1 – T2) T1 = hot water temp (oC) T2 = cold water temp (oC) Enthalpy of air water vapor mixture at inlet wet bulb temp (h1) and outlet wet bulb temp (h2) Assessment of Cooling Towers
  • 25.
    25 © UNEP 2006 TrainingAgenda: Cooling Towers Introduction Types of cooling towers Assessment of cooling towers Energy efficiency opportunities
  • 26.
    26 © UNEP 2006 EnergyEfficiency Opportunities 1. Selecting a cooling tower 2. Fills 3. Pumps and water distribution 4. Fans and motors
  • 27.
    27 © UNEP 2006 EnergyEfficiency Opportunities 1. Selecting a cooling tower Capacity • Heat dissipation (kCal/hour) • Circulated flow rate (m3/hr) • Other factors
  • 28.
    28 © UNEP 2006 EnergyEfficiency Opportunities Range • Range determined by process, not by system Approach • Closer to the wet bulb temperature • = Bigger size cooling tower • = More expensive 1. Selecting a cooling tower
  • 29.
    29 © UNEP 2006 EnergyEfficiency Opportunities Heat Load • Determined by process • Required cooling is controlled by the desired operating temperature • High heat load = large size and cost of cooling tower 1. Selecting a cooling tower
  • 30.
    30 © UNEP 2006 EnergyEfficiency Opportunities Wet bulb temperature – considerations: • Water is cooled to temp higher than wet bulb temp • Conditions at tower site • Not to exceed 5% of design wet bulb temp • Is wet bulb temp specified as ambient (preferred) or inlet • Can tower deal with increased wet bulb temp • Cold water to exchange heat 1. Selecting a cooling tower
  • 31.
    31 © UNEP 2006 EnergyEfficiency Opportunities Relationship range, flow and heat load • Range increases with increased • Amount circulated water (flow) • Heat load • Causes of range increase • Inlet water temperature increases • Exit water temperature decreases • Consequence = larger tower 1. Selecting a cooling tower
  • 32.
    32 © UNEP 2006 EnergyEfficiency Opportunities Relationship Approach and Wet bulb temperature • If approach stays the same (e.g. 4.45 oC) • Higher wet bulb temperature (26.67 oC) = more heat picked up (15.5 kCal/kg air) = smaller tower needed • Lower wet bulb temperature (21.11 oC) = less heat picked up (12.1 kCal/kg air) = larger tower needed 1. Selecting a cooling tower
  • 33.
    33 © UNEP 2006 EnergyEfficiency Opportunities • Hot water distributed over fill media and cools down through evaporation • Fill media impacts electricity use • Efficiently designed fill media reduces pumping costs • Fill media influences heat exchange: surface area, duration of contact, turbulence 2. Fill media
  • 34.
    34 © UNEP 2006 EnergyEfficiency Opportunities Comparing 3 fill media: film fill more efficient Splash Fill Film Fill Low Clog Film Fill Possible L/G Ratio 1.1 – 1.5 1.5 – 2.0 1.4 – 1.8 Effective Heat Exchange Area 30 – 45 m2/m3 150 m2/m3 85 - 100 m2/m3 Fill Height Required 5 – 10 m 1.2 – 1.5 m 1.5 – 1.8 m Pumping Head Requirement 9 – 12 m 5 – 8 m 6 – 9 m Quantity of Air Required High Much Low Low 2. Fill media (BEE India, 2004; Ramarao; and Shivaraman)
  • 35.
    35 © UNEP 2006 EnergyEfficiency Opportunities 3. Pumps and water distribution • Pumps: see pumps session • Optimize cooling water treatment • Increase cycles of concentration (COC) by cooling water treatment helps reduce make up water • Indirect electricity savings • Install drift eliminators • Reduce drift loss from 0.02% to only 0.003 – 0.001%
  • 36.
    36 © UNEP 2006 EnergyEfficiency Opportunities 4. Cooling Tower Fans • Fans must overcome system resistance, pressure loss: impacts electricity use • Fan efficiency depends on blade profile • Replace metallic fans with FBR blades (20- 30% savings) • Use blades with aerodynamic profile (85-92% fan efficiency)
  • 37.
    37 Training Session onEnergy Equipment Cooling Towers THANK YOU FOR YOU ATTENTION © UNEP 2006 
  • 38.
    38 © UNEP 2006 Disclaimerand References • This PowerPoint training session was prepared as part of the project “Greenhouse Gas Emission Reduction from Industry in Asia and the Pacific” (GERIAP). While reasonable efforts have been made to ensure that the contents of this publication are factually correct and properly referenced, UNEP does not accept responsibility for the accuracy or completeness of the contents, and shall not be liable for any loss or damage that may be occasioned directly or indirectly through the use of, or reliance on, the contents of this publication. © UNEP, 2006. • The GERIAP project was funded by the Swedish International Development Cooperation Agency (Sida) • Full references are included in the textbook chapter that is available on www.energyefficiencyasia.org