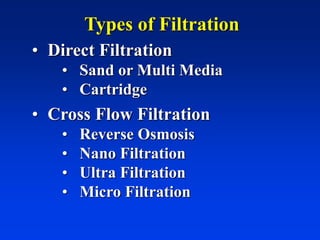
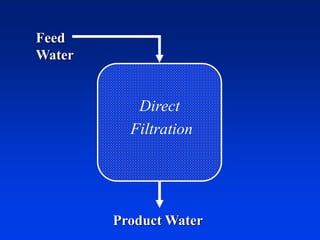
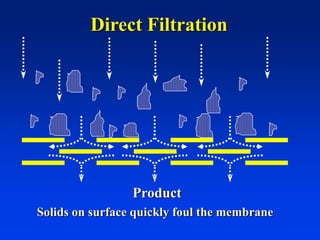
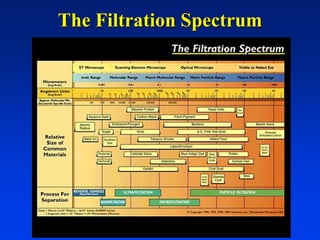
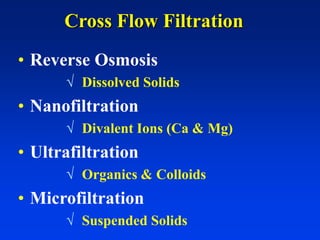
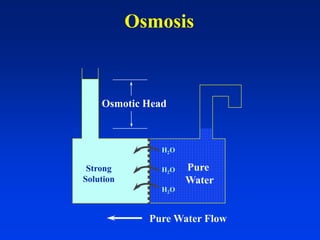
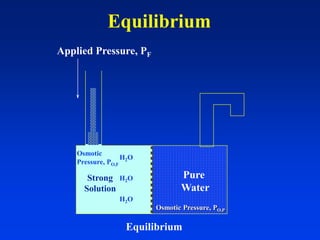
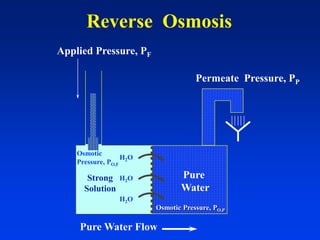
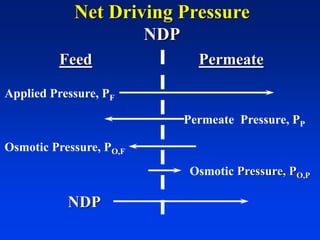
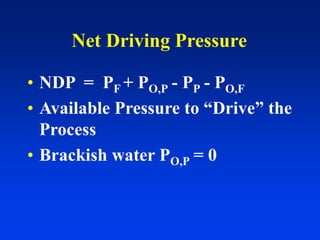
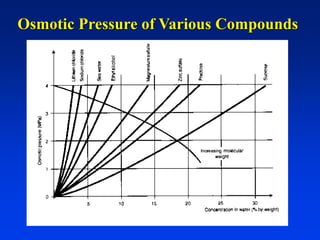
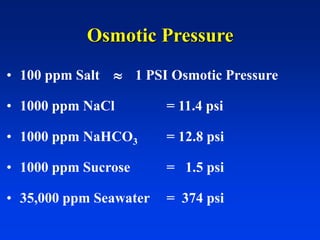
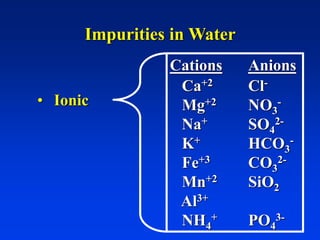
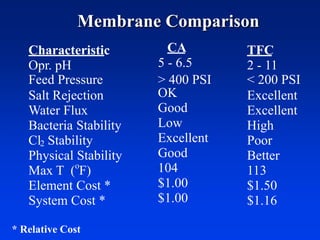
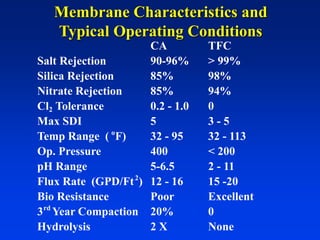
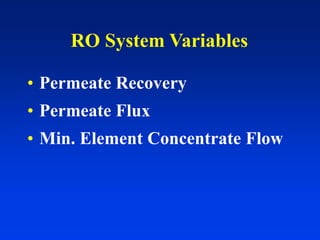
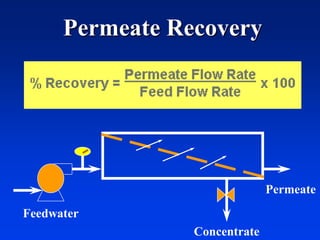
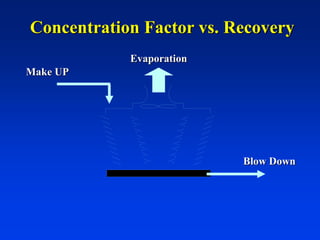
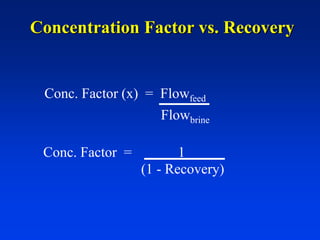
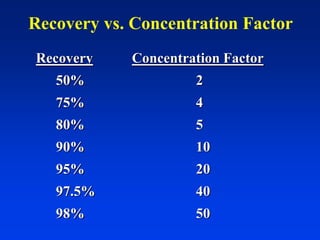
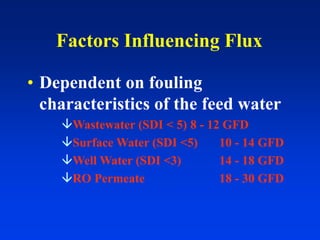
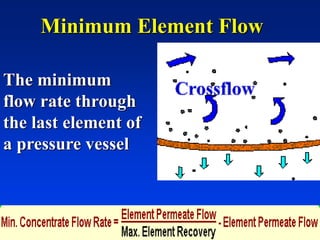
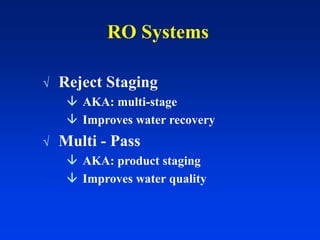
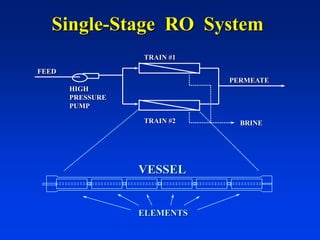
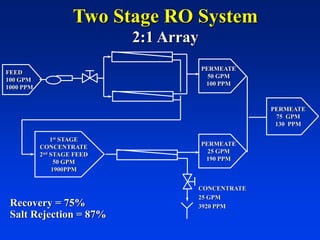
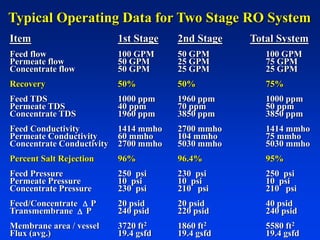
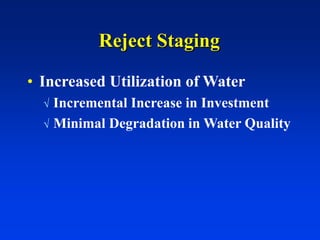
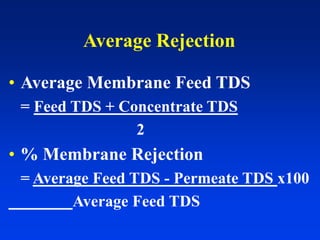
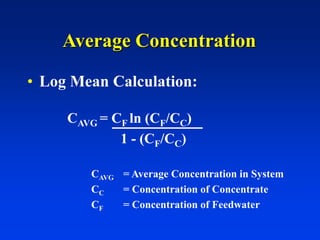
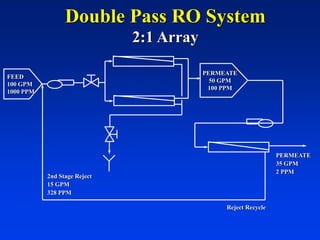
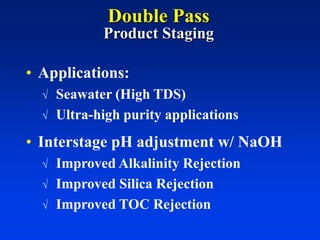
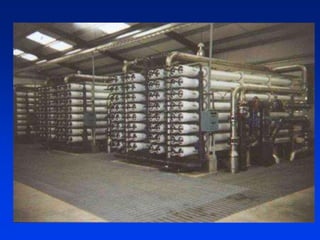
Delivering Local Access to
Global Membrane Expertise
This presentation is for you to
present to your customer.
Customize it as you see fit.
Speaker’s notes appear in the
Notes Page View
Reverse Osmosis
FUNDAMENTALS
Types of Filtration
• Direct Filtration
• Sand or Multi Media
• Cartridge
• Cross Flow Filtration
• Reverse Osmosis
• Nano Filtration
• Ultra Filtration
• Micro Filtration
Feed
Water
Product Water
Direct
Filtration
Direct Filtration
Product
Solids on surface quickly foul the membrane
Back Wash
Back Wash to Sewer
Direct
Filtration
Feed
Water
Permeate
Concentrate
Cross Flow Filtration
Permeate
Membrane Surface
Concentration Polarization
Cross Flow Filtration
Things to Remember
• Water velocity of the feed must be sufficient to
keep the solids moving.
• Low water velocity will allow the membrane
surface to “foul.”
• Higher water recoveries (greater water
utilization) means lower water velocity.
The Filtration Spectrum
Cross Flow Filtration
• Reverse Osmosis
 Dissolved Solids
• Nanofiltration
 Divalent Ions (Ca & Mg)
• Ultrafiltration
 Organics & Colloids
• Microfiltration
 Suspended Solids
Osmosis
Osmotic Head
Pure
Water
Strong
Solution
H2O
H2O
H2O
Pure Water Flow
Equilibrium
Applied Pressure, PF
H2O
H2O
H2O
Strong
Solution
Equilibrium
Pure
Water
Osmotic
Pressure, PO,F
Osmotic Pressure, PO,P
Reverse Osmosis
Applied Pressure, PF
H2O
H2O
H2O
Strong
Solution
Pure Water Flow
Pure
Water
Permeate Pressure, PP
Osmotic
Pressure, PO,F
Osmotic Pressure, PO,P
Net Driving Pressure
NDP
Osmotic Pressure, PO,P
Feed Permeate
Applied Pressure, PF
Permeate Pressure, PP
Osmotic Pressure, PO,F
NDP
Net Driving Pressure
• NDP = PF + PO,P - PP - PO,F
• Available Pressure to “Drive” the
Process
• Brackish water PO,P = 0
Osmotic Pressure of Various Compounds
Osmotic Pressure
• 100 ppm Salt 1 PSI Osmotic Pressure
• 1000 ppm NaCl = 11.4 psi
• 1000 ppm NaHCO3 = 12.8 psi
• 1000 ppm Sucrose = 1.5 psi
• 35,000 ppm Seawater = 374 psi

Impurities in Water
•Ionic
Impurities in Water
• Ionic
Cations Anions
Ca+2 Cl-
Mg+2 NO3
-
Na+ SO4
2-
K+ HCO3
-
Fe+3 CO3
2-
Mn+2 SiO2
Al3+
NH4
+ PO4
3-
Impurities in Water
•Ionic
•Non Ionic
Impurities in Water
• Ionic
• Non Ionic
• Organics
 Alcohols
 Ketones
 Aldehydes
 Phenols
Impurities in Water
• Ionic
• Non Ionic
• Particulate
Impurities in Water
• Ionic
• Non Ionic
• Particulate
•Suspended Solids
•Colloidal Material
•Microbiological
 Bacteria
 Virus
 Pyrogens
 Algae
Impurities in Water
• Ionic
• Non Ionic
• Particulate
• Gases
Impurities in Water
• Ionic
• Non Ionic
• Particulate
• Gases
• Carbon Dioxide
• Oxygen
• Chlorine
• Nitrogen
• Hydrogen Sulfide
Reverse Osmosis Removes
• Ionic
• Non Ionic
• Particulate
Not
Gases !
Ions in Solution
• Compounds dissolve in water to
form charged ions
• Anions (Negative Charge - extra electrons)
• Cations (Positive Charge - missing electrons)
Ions
• Ions missing or having one electron
= monovalent
• Ions missing or having two
electrons = divalent
• Ions missing or having three
electrons = trivalent
Ions
• Monovalent: NaCl  Na+ + Cl-
• Divalent : CaSO4  Ca2+ + SO4
2-
• Trivalent : Na3PO4  3Na+ + PO4
3-
Relative Permeation Rates of Ions
• Monovalent = 1 x 10⁻⁵ cm/sec fast
• Divalent = 1 x 10⁻⁶ cm/sec
• Trivalent = 1 x 10⁻⁷ cm/sec slow
Typical Passage of Ions
Ion Mg/l % Rejection
Sodium 68.0 99.4
Potassium 21.0 99.4
Magnesium 21.0 99.8
Calcium 80.0 99.8
Silica 9.3 98.9
Chloride 51.0 99.5
Bicarbonate 132.0 99.3
Sulfate 163.0 99.8
TDS 528.0 99.6
Determined at 200 psi, 25% recovery, pH 7.8
on de-chlorinated city feed water with TFC membrane
Things to Remember
Rejection Increases with Increasing
• Degree of dissociation
• Ionic charge
• Molecular weight
• Degree of molecular branching
How small is small?
Inches Meter Micrometer
39.37 1 1,000,000
3.94 .1 100,000
.39 .01 10,000
.04 .001 1,000
.004 .000,1 100
.000,4 .000,01 10
.000,04 .000,001 1
.000,008 .000,000,2 .1
5 x 10 -9 .005 UF
4 x 10 -10 .000,4 RO
1 Angstrom = 1 * 10 -10 m
Salt Rejection
H2O
Cl-
Na+
Membrane
Na+
Membrane
Pore Channel
Reverse Osmosis
Membranes
First RO Membrane
ROGA
Module #1
1964
Semi Permeable Membranes
Materials of Construction
• Cellulose Acetate
• Thin Film Composite
 (Polyamide)
• Polysulfone
Asymmetric Membrane
Cellulose Acetate
Support
Barrier
Layer Graded-density
cellulose acetate
Thin Film Composite Polyamide Membrane
0.2 micron
40 micron
120 micron
Reinforcing
Fabric
Microporous
Polysulfone
Polyamide
Ultra-thin
Barrier Layer
Compaction is not an issue
Barrier Layer
Polysulfone
Support Layer
Barrier Layer
Polysulfone
TFC Surface
Salt Rejection - Salt Passage
% Rejection = (TDSfeed - TDSProduct) x 100
TDSfeed
% Salt Passage = TDSProduct x 100
TDSfeed
Salt Flux
Js = K2(Cm - Cp)
Js = Salt Flux
K2 = Mass Transfer Coefficient
Cm = Concentration at the membrane
Cp = Concentration in the permeate
Permeate Flux
DJw = K1(D P - P)
Jw = Water Flux
K1 = System Constant
P = Transmembrane Pressure
= Osmotic PressureP
Permeate Flux
The rate of
permeate flow
through one square
foot of membrane.
• 10 - 25 GFD
• Temperature
• Pressure
Characteristic TFC
Opr. pH 2 - 11
Salt Rejection Excellent
Water Flux Excellent
Bacteria Stability High
Cl2 Stability Poor
Physical Stability Better
Max T (o
F) 113
Element Cost * $1.50
System Cost * $1.16
Membrane Comparison
* Relative Cost
5 - 6.5
CA
OK
Good
Low
Excellent
Good
104
$1.00
$1.00
Feed Pressure > 400 PSI < 200 PSI
CA TFC
Salt Rejection 90-96% > 99%
Silica Rejection 85% 98%
Nitrate Rejection 85% 94%
Cl2 Tolerance 0.2 - 1.0 0
Max SDI 5 3 - 5
Temp Range ( o
F) 32 - 95 32 - 113
Op. Pressure 400 < 200
pH Range 5-6.5 2 - 11
Flux Rate (GPD/Ft2
) 12 - 16 15 -20
Bio Resistance Poor Excellent
3rd
Year Compaction 20% 0
Hydrolysis 2 X None
Membrane Characteristics and
Typical Operating Conditions
Membrane Manufacturers
• Dow Filmtec
• Fluid Systems - Koch
• Hydranautics - Nitto Denko
• Osmonics - Desal
• Dupont - Out of membrane business
• Torray
• Toyobo
• Trisep
Reverse Osmosis
Membrane Configurations
Permeate Flux
The rate of
permeate flow
through one square
foot of membrane.
• 10 - 25 GFD
• Temperature
• Pressure
Membrane Configurations
• Spiral Wound (R/O > 99% USA)
• Hollow Fiber
• Tubular
• Plate and Frame
Spiral Wound Membranes
• Cellulose Acetate
• Thin Film Composite
 (Polyamide)
• Polysulfone
Spiral Wound Membrane Elements
Flow Pattern
for a
Spiral Wound
Element
Concentrate
Permeate
Feedwater
Permeate Recovery
Product
ConcentrateFeed
Brine becomes more concentrated
Flow Through a Pressure Vessel
Minimum Element Flow
The minimum
flow rate through
the last element of
a pressure vessel
Reverse Osmosis
System Design & Operation
RO System Variables
• Permeate Recovery
• Permeate Flux
• Min. Element Concentrate Flow
Concentrate
Permeate
Feedwater
Permeate Recovery
Concentration Factor vs. Recovery
Make UP
Blow Down
Evaporation
Concentration Factor vs. Recovery
Conc. Factor (x) = Flowfeed
Flowbrine
Conc. Factor = 1
(1 - Recovery)
Recovery vs. Concentration Factor
Recovery Concentration Factor
50% 2
75% 4
80% 5
90% 10
95% 20
97.5% 40
98% 50
Factors Influencing Recovery
• Concentration of scale forming
salts
• Osmotic pressure
• Permeate quality
Permeate Flux
The rate of
permeate flow
through one square
foot of membrane.
• 10 - 25 GFD
• Temperature
• Pressure
Factors Influencing Flux
• Dependent on fouling
characteristics of the feed water
Wastewater (SDI < 5) 8 - 12 GFD
Surface Water (SDI <5) 10 - 14 GFD
Well Water (SDI <3) 14 - 18 GFD
RO Permeate 18 - 30 GFD
Minimum Element Flow
The minimum
flow rate through
the last element of
a pressure vessel
RO Systems
 Reject Staging
 AKA: multi-stage
 Improves water recovery
 Multi - Pass
 AKA: product staging
 Improves water quality
Single-Stage RO System
ELEMENTS
VESSEL
FEED
PERMEATE
HIGH
PRESSURE
PUMP
TRAIN #1
TRAIN #2 BRINE
FEED
100 GPM
1000 PPM
PERMEATE
50 GPM
100 PPM
1st STAGE
CONCENTRATE
2nd STAGE FEED
50 GPM
1900PPM
PERMEATE
75 GPM
130 PPM
PERMEATE
25 GPM
190 PPM
CONCENTRATE
25 GPM
3920 PPM
Two Stage RO System
2:1 Array
Recovery = 75%
Salt Rejection = 87%
Item 1st Stage 2nd Stage Total System
Feed flow 100 GPM 50 GPM 100 GPM
Permeate flow 50 GPM 25 GPM 75 GPM
Concentrate flow 50 GPM 25 GPM 25 GPM
Recovery 50% 50% 75%
Feed TDS 1000 ppm 1960 ppm 1000 ppm
Permeate TDS 40 ppm 70 ppm 50 ppm
Concentrate TDS 1960 ppm 3850 ppm 3850 ppm
Feed Conductivity 1414 mmho 2700 mmho 1414 mmho
Permeate Conductivity 60 mmho 104 mmho 75 mmho
Concentrate Conductivity 2700 mmho 5030 mmho 5030 mmho
Percent Salt Rejection 96% 96.4% 95%
Feed Pressure 250 psi 230 psi 250 psi
Permeate Pressure 10 psi 10 psi 10 psi
Concentrate Pressure 230 psi 210 psi 210 psi
Feed/Concentrate P 20 psid 20 psid 40 psid
Transmembrane P 240 psid 220 psid 240 psid
Membrane area / vessel 3720 ft2 1860 ft2 5580 ft2
Flux (avg.) 19.4 gsfd 19.4 gsfd 19.4 gsfd
Typical Operating Data for Two Stage RO System
D
D
Reject Staging
• Increased Utilization of Water
 Incremental Increase in Investment
 Minimal Degradation in Water Quality
Average Rejection
• Average Membrane Feed TDS
= Feed TDS + Concentrate TDS
2
• % Membrane Rejection
= Average Feed TDS - Permeate TDS x100
Average Feed TDS
Average Concentration
• Log Mean Calculation:
CAVG = CF ln (CF/CC)
1 - (CF/CC)
CAVG = Average Concentration in System
CC = Concentration of Concentrate
CF = Concentration of Feedwater
Double Pass RO System
2:1 Array
FEED
100 GPM
1000 PPM
PERMEATE
50 GPM
100 PPM
Reject Recycle
PERMEATE
35 GPM
2 PPM
2nd Stage Reject
15 GPM
328 PPM
Double Pass
Product Staging
• Applications:
 Seawater (High TDS)
 Ultra-high purity applications
• Interstage pH adjustment w/ NaOH
 Improved Alkalinity Rejection
 Improved Silica Rejection
 Improved TOC Rejection
Delivering Local Access to
Global Membrane Expertise

Permacare RO membrane expertise