Downloaded 2,080 times

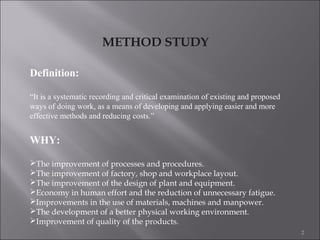
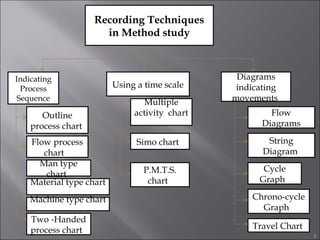
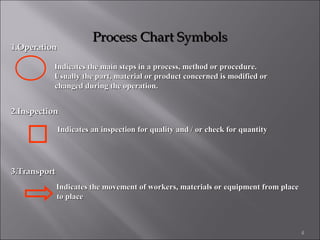
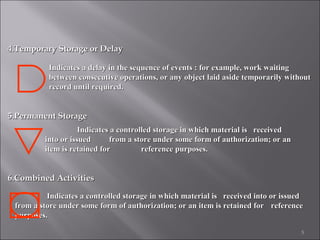
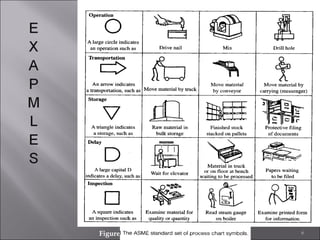
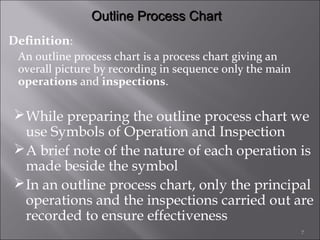
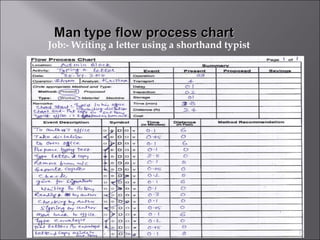
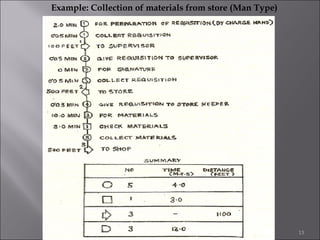
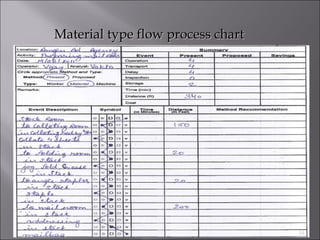
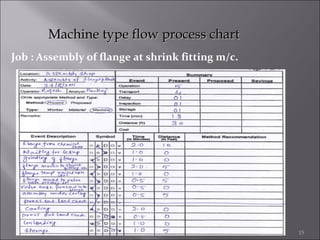
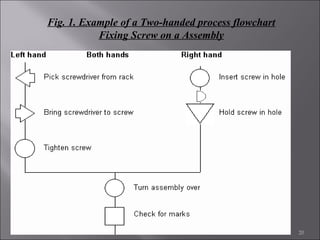
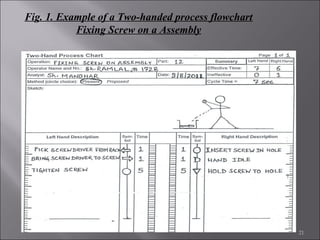
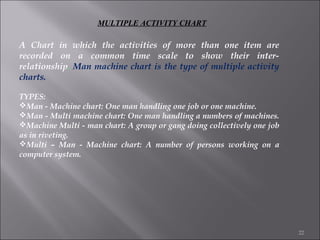
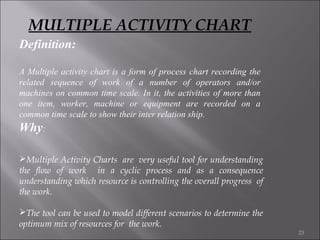
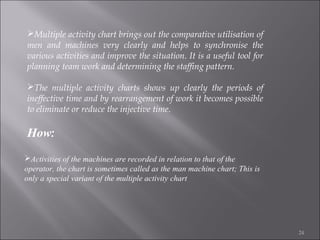
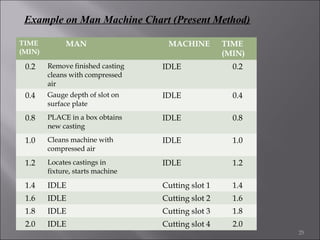
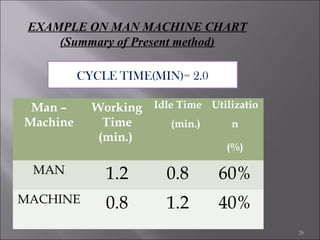
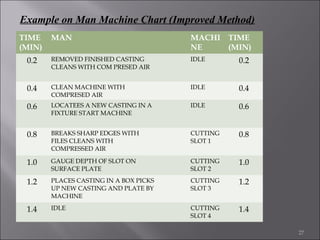
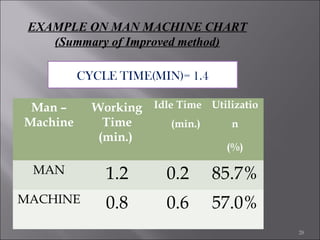
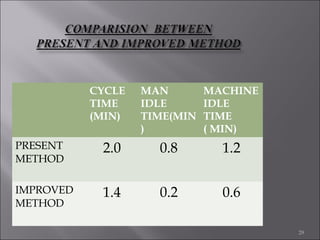


This document provides information on method study techniques for analyzing work processes. It defines method study and outlines its goals of improving efficiency and reducing costs. It then describes various process chart types for visually documenting work sequences, such as flow process charts, man-machine charts, and two-handed process charts. It also explains the symbols used in process charts and provides examples of charts mapping different work processes. Finally, it briefly introduces the technique of micro motion study for highly detailed analysis of short-cycle operations.