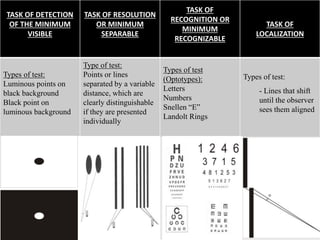
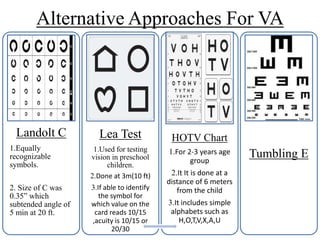
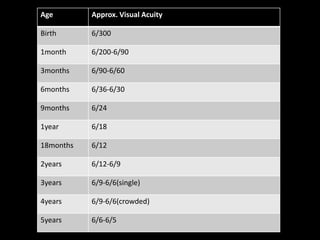
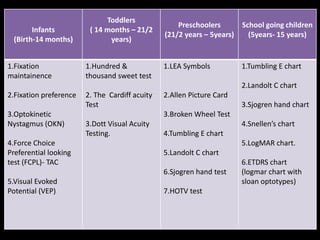
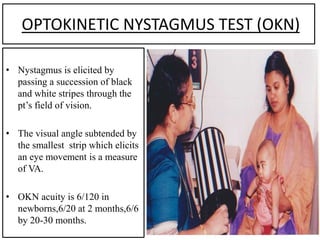
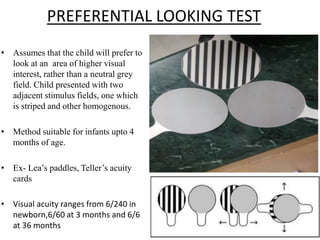
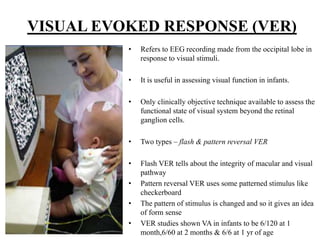
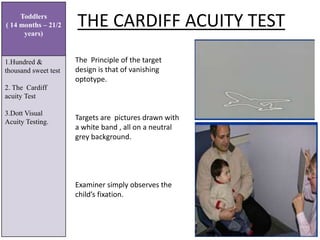
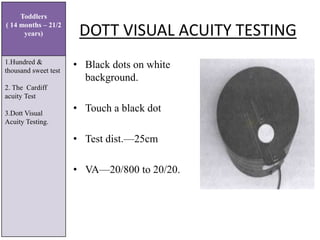
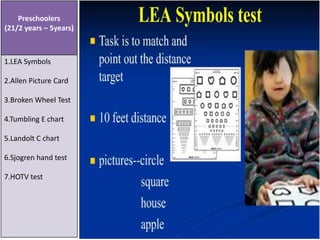
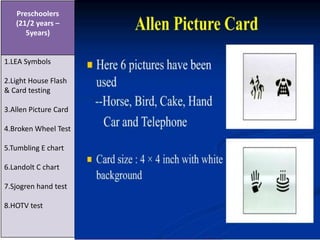
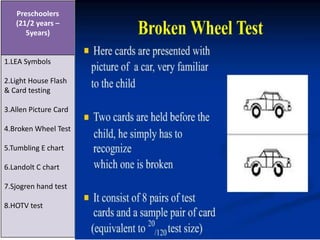
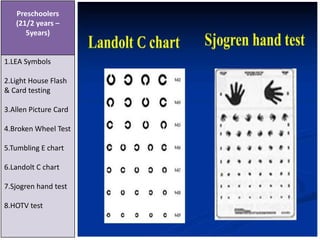
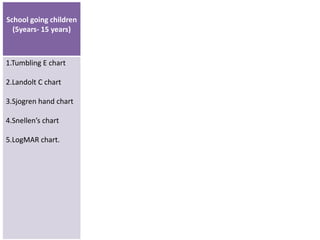
VISUAL ACUITY,CONTRAST
SENSITIVITY
PRESENTED BY DR.PUSHKAR DHIR
MODERATED BY DR.WANGCHUK
DOMA
CONCEPT OF VISUALACUITY
• It is quantified by the minimum dimension that an object
must have in order for the observer to be able to identify,
distinguish or simply detect it.
Visual Acuity is the capacity to detect, resolve or recognize the
details of objects
Weymouth Classification of Visual
Acuity Measurements
• MINIMUM DISTINGUISHABLE (OR MINIMUM VISIBLE)
• The observer should be able to decide on the presence or absence of an object in
their field of vision
• Quantified by the angle that is subtended by the object that is perceived by the
observer
• MINIMUM SEPARABLE
• The ability to determine a group of points or lines as separate and distinct
• Quantified by the minimum angle of separation that should exist between the two
objects so that they can be perceived as separate by the observer
• MINIMUM RECOGNIZABLE
• The ability to detect form sense (e.g., Landolt C) or minimum legible (e.g., letters
or numbers)
• Quantified by the inverse of the angle that subtends the object to be recognized.
TASK OF DETECTION
OF THE MINIMUM
VISIBLE
TASK OF RESOLUTION
OR MINIMUM
SEPARABLE
TASK OF
RECOGNITION OR
MINIMUM
RECOGNIZABLE
TASK OF
LOCALIZATION
Types of test:
Luminous points on
black background
Black point on
luminous background
Type of test:
Points or lines
separated by a variable
distance, which are
clearly distinguishable
if they are presented
individually
Types of test
(Optotypes):
Letters
Numbers
Snellen “E”
Landolt Rings
Types of test:
- Lines that shift
until the observer
sees them aligned
History
• Early astronomers found two stars resolvable
as separate if the distance between the stars
subtend an angle of at least 1 minute of arc
• 1861 FRANCISCUS DONDERS coined the term visual
acuity to describe the “sharpness of vision” and defined it
as the ratio between a subject's VA and a standard VA.
• 1862 HERMANN SNELLEN published his famous letter
chart.
• Laid out font in 5x5 grid pattern & k/a
OPTOTYPES.(PIC)*
• Standardize the font/chart -> easily reproducable.
• Defined “standard vision” as the ability to recognize one
of his optotypes from distance of 20 feet when it
subtended 5 minutes of arc.
• Thus the optotype can be resolve ,only if the person
viewing it can discriminate a spatial pattern separated by a
visual angle of 1 minute of arc (i.e. one element of the
grid). ( so for resolute 1min of arc , for recognizable 5 min
of arc, right?)
Typical Snellen Optotype
1 degree =60 minutes
1minutes = 1/60degree
• Choice of 20 ft as measurement
distance was arbitrary.
• 20/20 is NOT perfect human vision
rather it is the near average for adults
in their 60’s.
• 20/20 should be interpreted as limit of
normal vision.
• Snellen used 9optotypes intially
C,D,E,F,P,O,Z,T,L.
• In 1875 Snellen created new set &
used 6 metres .
• So now in England 6metres & USA
20ft n hence our HMS casses 
Variations on the Snellens Chart
• In 1959, Louise Sloan designed a new set of 10 optotypes nonserifletters.
• Standardized effect of crowding btw.letters & avoided problem of some letters
being more prominent
SLOAN LETTERS
The Bailey-Lovie logMAR chart
• Principle:-
 Used logarithmic scale.
 Each step indicates increase of 25% in letter size.
 Letter sizes ratio as we move up is a constant value of 1.26(0.1log unit steps).
 Incorporated 5 letters in every row.
 Spacing b/w 2 adjacent letters = width of 1 letter.
 Spacing b/w 2 hz rows = height of the letter on lower row.
• Results of this chart were obtained in terms of logMAR score i.e log of minimum angle
of resolution.
• As each letter size changes by 0.1logMAR units per row & there are 5 letters on each row
,therefore each letter can be assigned value of 0.02.
• Thus final logMAR takes account of every letter that has been correctly read.
• In 1982, the National Eye Institute combined the Sloan letter set with the Bailey-Lovie
layout to produce charts for use in the Early Treatment of Diabetic Retinopathy Study.
• These charts became known as the ETDRS charts.
5.8 cm
4.65cm
Snellens Chart
• Irregular progression of letter
size
• Variable number of letters in
each line
• Variable legibility (difficulty) of
test letters
• Distance between each letter is
not uniform
• SHERRIFS FONT
logMAR Chart
• Uniform progression of letter
size
• Same number of letters in each
line
• All letters with similar legibility
• The distance b/w each letter is
equal to the width of the letter
• NO SHERIFFS FONT
Chart in work
up Area says
Read from 3m
& 6m
respectively
Chart in Ward
Area
Says read from
4m
???? What to
be Followed???
Tan 5 is the rule
Tan 5`=x(letter lenghth)/y
Tan 5`= x/400cm
.00145*400=x
0.58cm=x
Should be
4metres but
its 374
approx.!!!!
Snellen fraction
(20ft)
Snellen fraction
(6m)
Snellen Acuity
(Decimal)
Minimal Angle of
Resolution
(inverse of sn.frac)
Log-MAR
20/200 6/60 0.10 10 1
20/160 0.12 8 0.9
20/125 ~6/36 0.8
20/100 0.20 5 0.7
20/80 6/24 0.25 4 0.6
20/63 ~6/18 0.5
20/50 0.40 0.4
20/40 6/12 0.50 2 0.3
20/32 0.67 0.2
20/25 0.80 0.1
20/20 6/6 1 1 0
20/16 -0.1
20/12.5 -0.2
20/10 -0.3
Alternative Approaches For VA
Landolt C
1.Equally
recognizable
symbols.
2. Size of C was
0.35” which
subtended angle of
5 min at 20 ft.
Lea Test
1.Used for testing
vision in preschool
children.
2.Done at 3m(10 ft)
3.If able to identify
the symbol for
which value on the
card reads 10/15
,acuity is 10/15 or
20/30
HOTV Chart
1.For 2-3 years age
group
2.It It is done at a
distance of 6 meters
from the child
3.It includes simple
alphabets such as
H,O,T,V,X,A,U
Tumbling E
 
Near Vision Visual Acuity Assesment
Measurement of VA for near
• Near vision is tested by asking the pt.
to read a near vision chart kept at a
distance of 25cm to 35cm.
• Each eye should be tested separately.
• The near vision is recorded as the
smallest type which the pt. can read
comfortably.
Commonly used near vision charts are
1) Jaeger’s charts
• Consist of ordinary
printer’s fonts of
varying sizes.
• Prints are marked from
1 to 7 and accordingly
pt’s acuity is labelled
as J1 to J7 depending
upon the print he can
read
(2) Roman test types
• Consists of Times Roman fonts with standard
spacing.
• -The near vision is recorded as N5, N6, N8,
N10, N12, N18, N36 and N48.
(3) Snellen’s near vision test types
• Constructed on the same principles as of the
distant types.
• The graded thickness of the letters is about
1/17 of the distant vision chart letter.
• The letter equivalent to 6/6 line subtend an
angle of 5 min. at he average reading distance.
Meri Refraction
kon karega
PEDIATRIC
REFRACTION
Age Approx. Visual Acuity
Birth 6/300
1month 6/200-6/90
3months 6/90-6/60
6months 6/36-6/30
9months 6/24
1year 6/18
18months 6/12
2years 6/12-6/9
3years 6/9-6/6(single)
4years 6/9-6/6(crowded)
5years 6/6-6/5
Infants
(Birth-14 months)
Toddlers
( 14 months – 21/2
years)
Preschoolers
(21/2 years – 5years)
School going children
(5years- 15 years)
1.Fixation
maintainence
2.Fixation preference
3.Optokinetic
Nystagmus (OKN)
4.Force Choice
Preferential looking
test (FCPL)- TAC
5.Visual Evoked
Potential (VEP)
1.Hundred &
thousand sweet test
2. The Cardiff acuity
Test
3.Dott Visual Acuity
Testing.
1.LEA Symbols
2.Allen Picture Card
3.Broken Wheel Test
4.Tumbling E chart
5.Landolt C chart
6.Sjogren hand test
7.HOTV test
1.Tumbling E chart
2.Landolt C chart
3.Sjogren hand chart
4.Snellen’s chart
5.LogMAR chart.
6.ETDRS chart
(logmar chart with
sloan optotypes)
There are 2 types fixations are present:-
1.Centric
2.Eccentric
Component of Fixation
C= Central
S= steady
M= Mantained
Fixation Preferance
• Place a 10D base down prism in front of one eye
• Alternate fixation indicate equal VA in both eyes.
• If fixation does not maintain then preferred eye
occluded.
• If fixation is mantained through a blink , then also
visual acuity is good.
OPTOKINETIC NYSTAGMUS TEST (OKN)
• Nystagmus is elicited by
passing a succession of black
and white stripes through the
pt’s field of vision.
• The visual angle subtended by
the smallest strip which elicits
an eye movement is a measure
of VA.
• OKN acuity is 6/120 in
newborns,6/20 at 2 months,6/6
by 20-30 months.
PREFERENTIAL LOOKING TEST
• Assumes that the child will prefer to
look at an area of higher visual
interest, rather than a neutral grey
field. Child presented with two
adjacent stimulus fields, one which
is striped and other homogenous.
• Method suitable for infants upto 4
months of age.
• Ex- Lea’s paddles, Teller’s acuity
cards
• Visual acuity ranges from 6/240 in
newborn,6/60 at 3 months and 6/6
at 36 months
VISUAL EVOKED RESPONSE (VER)
• Refers to EEG recording made from the occipital lobe in
response to visual stimuli.
• It is useful in assessing visual function in infants.
• Only clinically objective technique available to assess the
functional state of visual system beyond the retinal
ganglion cells.
• Two types – flash & pattern reversal VER
• Flash VER tells about the integrity of macular and visual
pathway
• Pattern reversal VER uses some patterned stimulus like
checkerboard
• The pattern of stimulus is changed and so it gives an idea
of form sense
• VER studies shown VA in infants to be 6/120 at 1
month,6/60 at 2 months & 6/6 at 1 yr of age
Hundred & Thousand Sweet Test
• Very sweet test.
• if child able to pick up small
sweets at 33cm,visual acuity
is at least 6/24 or 20/80
Toddlers
( 14 months – 21/2
years)
1.Hundred &
thousand sweet test
2. The Cardiff
acuity Test
3.Dott Visual
Acuity Testing.
THE CARDIFF ACUITY TEST
Toddlers
( 14 months – 21/2
years)
1.Hundred &
thousand sweet test
2. The Cardiff
acuity Test
3.Dott Visual
Acuity Testing.
The Principle of the target
design is that of vanishing
optotype.
Targets are pictures drawn with
a white band , all on a neutral
grey background.
Examiner simply observes the
child’s fixation.
DOTT VISUAL ACUITY TESTING
• Black dots on white
background.
• Touch a black dot
• Test dist.—25cm
• VA—20/800 to 20/20.
Toddlers
( 14 months – 21/2
years)
1.Hundred &
thousand sweet test
2. The Cardiff
acuity Test
3.Dott Visual
Acuity Testing.
Preschoolers
(21/2 years – 5years)
1.LEA Symbols
2.Allen Picture Card
3.Broken Wheel Test
4.Tumbling E chart
5.Landolt C chart
6.Sjogren hand test
7.HOTV test
Preschoolers
(21/2 years –
5years)
1.LEA Symbols
2.Light House Flash
& Card testing
3.Allen Picture Card
4.Broken Wheel Test
5.Tumbling E chart
6.Landolt C chart
7.Sjogren hand test
8.HOTV test
Preschoolers
(21/2 years –
5years)
1.LEA Symbols
2.Light House Flash
& Card testing
3.Allen Picture Card
4.Broken Wheel Test
5.Tumbling E chart
6.Landolt C chart
7.Sjogren hand test
8.HOTV test
Preschoolers
(21/2 years –
5years)
1.LEA Symbols
2.Light House Flash
& Card testing
3.Allen Picture Card
4.Broken Wheel Test
5.Tumbling E chart
6.Landolt C chart
7.Sjogren hand test
8.HOTV test
School going children
(5years- 15 years)
1.Tumbling E chart
2.Landolt C chart
3.Sjogren hand chart
4.Snellen’s chart
5.LogMAR chart.
CONTRAST SENSITIVITY
• The ability to percieve slight
changes in luminance between
regions that are not separated by
definite borders.
• Provides critical information
about the edges, borders and
variation in the brightness of two
objects.
• Contrast sensitivity is the
reciprocal of the contrast at
threshold.
The various methods:
1. Arden gratings
2. Pelli Robson test
3. Bailey Lovie chart
4. Vision contrast test system (VCTS) by
Vistech
5. Cambridge low contrast grating
6. Regan charts
7. FACT charts
Cambridge low contrast gratings
• Rapid and simple screening test performed at a distance of 6m.
• 12 pair of plates consisting of stripes of varying contrast. First one is for
demonstration and rest are for the proper testing and are numbered from 1-10. The
plates are changed sequentially starting from plate 1 till the patient fails to respond.
• Then a new series is begun starting 4 plates prior to where the patient failed to
respond. Four such series are completed and the score of each series is noted
(numbered as per he number of plate read) and added.
• The final total value is converted into contrast sensitivity from the provided table.
PELLI ROBSON contrast sensitivity charts
• Two charts and two scoring pads.
• Each chart has 6 letters in a row - two triplets of
varying contrast.
• The test is carried at a distance of 1 meter with
patient wearing the best correction.
• The patient reads from left hand corner, when he
fails to respond, the score of the test is recorded by
the faintest triplet out of which at least 2 letters
are correctly identified.
• The log CS value for this triplet is given by the
number on the scoring pad nearest to the triplet,
either on the left or the right side.
• Each eye is tested separately and then the both
eyes together.
Helpful links
• http://www.icoph.org/downloads/visualstandardsreport.pdf
• http://books.google.co.in/books?id=lt7fAH0s7QYC&pg=PA468&lpg
=PA468&dq=.00145+%3D+how+many+tan?&source=bl&ots=sKtytR
DOoJ&sig=LM-
pcUl1IcnLNTTdFEHYUna8WEI&hl=en&sa=X&ei=3RRfU-
zTO8qyuATc34GwDg&ved=0CCoQ6AEwAA#v=onepage&q=.00145%
20%3D%20how%20many%20tan%3F&f=false
• http://www.acuity.de/history/index.php
• http://www.icoph.org/dynamic/attachments/resources/icovisualac
uity1984.pdf
• http://www.eboptometry.com/content/optometry/ebp-resource-
step-4-apply/practitioners-students-teachers/development-and-
adoption-visual-acuity-charts-based-
%E2%80%9Clogmar%E2%80%9D-principles
THANK YOU EVERYONE FOR PATIENTLY LISTENING TO THIS
SEMINAR.
For feedbacks & brickbats plz mail at
ykush@yahoo.co.in./drdhir2014@gmail.com
NO MORE SEMI--NAR
KYUNKI ABKI BAR ……..  
VISUAL ACUITY IN CHILDREN BY PUSHKAR DHIR.pptx

VISUAL ACUITY IN CHILDREN BY PUSHKAR DHIR.pptx

  • 1.
    VISUAL ACUITY,CONTRAST SENSITIVITY PRESENTED BYDR.PUSHKAR DHIR MODERATED BY DR.WANGCHUK DOMA
  • 3.
    CONCEPT OF VISUALACUITY •It is quantified by the minimum dimension that an object must have in order for the observer to be able to identify, distinguish or simply detect it. Visual Acuity is the capacity to detect, resolve or recognize the details of objects
  • 4.
    Weymouth Classification ofVisual Acuity Measurements • MINIMUM DISTINGUISHABLE (OR MINIMUM VISIBLE) • The observer should be able to decide on the presence or absence of an object in their field of vision • Quantified by the angle that is subtended by the object that is perceived by the observer • MINIMUM SEPARABLE • The ability to determine a group of points or lines as separate and distinct • Quantified by the minimum angle of separation that should exist between the two objects so that they can be perceived as separate by the observer • MINIMUM RECOGNIZABLE • The ability to detect form sense (e.g., Landolt C) or minimum legible (e.g., letters or numbers) • Quantified by the inverse of the angle that subtends the object to be recognized.
  • 5.
    TASK OF DETECTION OFTHE MINIMUM VISIBLE TASK OF RESOLUTION OR MINIMUM SEPARABLE TASK OF RECOGNITION OR MINIMUM RECOGNIZABLE TASK OF LOCALIZATION Types of test: Luminous points on black background Black point on luminous background Type of test: Points or lines separated by a variable distance, which are clearly distinguishable if they are presented individually Types of test (Optotypes): Letters Numbers Snellen “E” Landolt Rings Types of test: - Lines that shift until the observer sees them aligned
  • 6.
    History • Early astronomersfound two stars resolvable as separate if the distance between the stars subtend an angle of at least 1 minute of arc
  • 7.
    • 1861 FRANCISCUSDONDERS coined the term visual acuity to describe the “sharpness of vision” and defined it as the ratio between a subject's VA and a standard VA. • 1862 HERMANN SNELLEN published his famous letter chart. • Laid out font in 5x5 grid pattern & k/a OPTOTYPES.(PIC)* • Standardize the font/chart -> easily reproducable. • Defined “standard vision” as the ability to recognize one of his optotypes from distance of 20 feet when it subtended 5 minutes of arc. • Thus the optotype can be resolve ,only if the person viewing it can discriminate a spatial pattern separated by a visual angle of 1 minute of arc (i.e. one element of the grid). ( so for resolute 1min of arc , for recognizable 5 min of arc, right?)
  • 8.
    Typical Snellen Optotype 1degree =60 minutes 1minutes = 1/60degree
  • 9.
    • Choice of20 ft as measurement distance was arbitrary. • 20/20 is NOT perfect human vision rather it is the near average for adults in their 60’s. • 20/20 should be interpreted as limit of normal vision. • Snellen used 9optotypes intially C,D,E,F,P,O,Z,T,L. • In 1875 Snellen created new set & used 6 metres . • So now in England 6metres & USA 20ft n hence our HMS casses 
  • 10.
    Variations on theSnellens Chart • In 1959, Louise Sloan designed a new set of 10 optotypes nonserifletters. • Standardized effect of crowding btw.letters & avoided problem of some letters being more prominent SLOAN LETTERS
  • 11.
    The Bailey-Lovie logMARchart • Principle:-  Used logarithmic scale.  Each step indicates increase of 25% in letter size.  Letter sizes ratio as we move up is a constant value of 1.26(0.1log unit steps).  Incorporated 5 letters in every row.  Spacing b/w 2 adjacent letters = width of 1 letter.  Spacing b/w 2 hz rows = height of the letter on lower row. • Results of this chart were obtained in terms of logMAR score i.e log of minimum angle of resolution. • As each letter size changes by 0.1logMAR units per row & there are 5 letters on each row ,therefore each letter can be assigned value of 0.02. • Thus final logMAR takes account of every letter that has been correctly read. • In 1982, the National Eye Institute combined the Sloan letter set with the Bailey-Lovie layout to produce charts for use in the Early Treatment of Diabetic Retinopathy Study. • These charts became known as the ETDRS charts.
  • 12.
  • 13.
    Snellens Chart • Irregularprogression of letter size • Variable number of letters in each line • Variable legibility (difficulty) of test letters • Distance between each letter is not uniform • SHERRIFS FONT logMAR Chart • Uniform progression of letter size • Same number of letters in each line • All letters with similar legibility • The distance b/w each letter is equal to the width of the letter • NO SHERIFFS FONT
  • 14.
    Chart in work upArea says Read from 3m & 6m respectively Chart in Ward Area Says read from 4m ???? What to be Followed???
  • 15.
    Tan 5 isthe rule Tan 5`=x(letter lenghth)/y Tan 5`= x/400cm .00145*400=x 0.58cm=x Should be 4metres but its 374 approx.!!!!
  • 16.
    Snellen fraction (20ft) Snellen fraction (6m) SnellenAcuity (Decimal) Minimal Angle of Resolution (inverse of sn.frac) Log-MAR 20/200 6/60 0.10 10 1 20/160 0.12 8 0.9 20/125 ~6/36 0.8 20/100 0.20 5 0.7 20/80 6/24 0.25 4 0.6 20/63 ~6/18 0.5 20/50 0.40 0.4 20/40 6/12 0.50 2 0.3 20/32 0.67 0.2 20/25 0.80 0.1 20/20 6/6 1 1 0 20/16 -0.1 20/12.5 -0.2 20/10 -0.3
  • 17.
    Alternative Approaches ForVA Landolt C 1.Equally recognizable symbols. 2. Size of C was 0.35” which subtended angle of 5 min at 20 ft. Lea Test 1.Used for testing vision in preschool children. 2.Done at 3m(10 ft) 3.If able to identify the symbol for which value on the card reads 10/15 ,acuity is 10/15 or 20/30 HOTV Chart 1.For 2-3 years age group 2.It It is done at a distance of 6 meters from the child 3.It includes simple alphabets such as H,O,T,V,X,A,U Tumbling E
  • 18.
  • 19.
    Near Vision VisualAcuity Assesment
  • 20.
    Measurement of VAfor near • Near vision is tested by asking the pt. to read a near vision chart kept at a distance of 25cm to 35cm. • Each eye should be tested separately. • The near vision is recorded as the smallest type which the pt. can read comfortably.
  • 21.
    Commonly used nearvision charts are
  • 22.
    1) Jaeger’s charts •Consist of ordinary printer’s fonts of varying sizes. • Prints are marked from 1 to 7 and accordingly pt’s acuity is labelled as J1 to J7 depending upon the print he can read
  • 23.
    (2) Roman testtypes • Consists of Times Roman fonts with standard spacing. • -The near vision is recorded as N5, N6, N8, N10, N12, N18, N36 and N48.
  • 24.
    (3) Snellen’s nearvision test types • Constructed on the same principles as of the distant types. • The graded thickness of the letters is about 1/17 of the distant vision chart letter. • The letter equivalent to 6/6 line subtend an angle of 5 min. at he average reading distance.
  • 26.
  • 27.
    Age Approx. VisualAcuity Birth 6/300 1month 6/200-6/90 3months 6/90-6/60 6months 6/36-6/30 9months 6/24 1year 6/18 18months 6/12 2years 6/12-6/9 3years 6/9-6/6(single) 4years 6/9-6/6(crowded) 5years 6/6-6/5
  • 28.
    Infants (Birth-14 months) Toddlers ( 14months – 21/2 years) Preschoolers (21/2 years – 5years) School going children (5years- 15 years) 1.Fixation maintainence 2.Fixation preference 3.Optokinetic Nystagmus (OKN) 4.Force Choice Preferential looking test (FCPL)- TAC 5.Visual Evoked Potential (VEP) 1.Hundred & thousand sweet test 2. The Cardiff acuity Test 3.Dott Visual Acuity Testing. 1.LEA Symbols 2.Allen Picture Card 3.Broken Wheel Test 4.Tumbling E chart 5.Landolt C chart 6.Sjogren hand test 7.HOTV test 1.Tumbling E chart 2.Landolt C chart 3.Sjogren hand chart 4.Snellen’s chart 5.LogMAR chart. 6.ETDRS chart (logmar chart with sloan optotypes)
  • 29.
    There are 2types fixations are present:- 1.Centric 2.Eccentric Component of Fixation C= Central S= steady M= Mantained
  • 31.
    Fixation Preferance • Placea 10D base down prism in front of one eye • Alternate fixation indicate equal VA in both eyes. • If fixation does not maintain then preferred eye occluded. • If fixation is mantained through a blink , then also visual acuity is good.
  • 32.
    OPTOKINETIC NYSTAGMUS TEST(OKN) • Nystagmus is elicited by passing a succession of black and white stripes through the pt’s field of vision. • The visual angle subtended by the smallest strip which elicits an eye movement is a measure of VA. • OKN acuity is 6/120 in newborns,6/20 at 2 months,6/6 by 20-30 months.
  • 33.
    PREFERENTIAL LOOKING TEST •Assumes that the child will prefer to look at an area of higher visual interest, rather than a neutral grey field. Child presented with two adjacent stimulus fields, one which is striped and other homogenous. • Method suitable for infants upto 4 months of age. • Ex- Lea’s paddles, Teller’s acuity cards • Visual acuity ranges from 6/240 in newborn,6/60 at 3 months and 6/6 at 36 months
  • 34.
    VISUAL EVOKED RESPONSE(VER) • Refers to EEG recording made from the occipital lobe in response to visual stimuli. • It is useful in assessing visual function in infants. • Only clinically objective technique available to assess the functional state of visual system beyond the retinal ganglion cells. • Two types – flash & pattern reversal VER • Flash VER tells about the integrity of macular and visual pathway • Pattern reversal VER uses some patterned stimulus like checkerboard • The pattern of stimulus is changed and so it gives an idea of form sense • VER studies shown VA in infants to be 6/120 at 1 month,6/60 at 2 months & 6/6 at 1 yr of age
  • 35.
    Hundred & ThousandSweet Test • Very sweet test. • if child able to pick up small sweets at 33cm,visual acuity is at least 6/24 or 20/80 Toddlers ( 14 months – 21/2 years) 1.Hundred & thousand sweet test 2. The Cardiff acuity Test 3.Dott Visual Acuity Testing.
  • 36.
    THE CARDIFF ACUITYTEST Toddlers ( 14 months – 21/2 years) 1.Hundred & thousand sweet test 2. The Cardiff acuity Test 3.Dott Visual Acuity Testing. The Principle of the target design is that of vanishing optotype. Targets are pictures drawn with a white band , all on a neutral grey background. Examiner simply observes the child’s fixation.
  • 37.
    DOTT VISUAL ACUITYTESTING • Black dots on white background. • Touch a black dot • Test dist.—25cm • VA—20/800 to 20/20. Toddlers ( 14 months – 21/2 years) 1.Hundred & thousand sweet test 2. The Cardiff acuity Test 3.Dott Visual Acuity Testing.
  • 38.
    Preschoolers (21/2 years –5years) 1.LEA Symbols 2.Allen Picture Card 3.Broken Wheel Test 4.Tumbling E chart 5.Landolt C chart 6.Sjogren hand test 7.HOTV test
  • 39.
    Preschoolers (21/2 years – 5years) 1.LEASymbols 2.Light House Flash & Card testing 3.Allen Picture Card 4.Broken Wheel Test 5.Tumbling E chart 6.Landolt C chart 7.Sjogren hand test 8.HOTV test
  • 40.
    Preschoolers (21/2 years – 5years) 1.LEASymbols 2.Light House Flash & Card testing 3.Allen Picture Card 4.Broken Wheel Test 5.Tumbling E chart 6.Landolt C chart 7.Sjogren hand test 8.HOTV test
  • 41.
    Preschoolers (21/2 years – 5years) 1.LEASymbols 2.Light House Flash & Card testing 3.Allen Picture Card 4.Broken Wheel Test 5.Tumbling E chart 6.Landolt C chart 7.Sjogren hand test 8.HOTV test
  • 42.
    School going children (5years-15 years) 1.Tumbling E chart 2.Landolt C chart 3.Sjogren hand chart 4.Snellen’s chart 5.LogMAR chart.
  • 43.
    CONTRAST SENSITIVITY • Theability to percieve slight changes in luminance between regions that are not separated by definite borders. • Provides critical information about the edges, borders and variation in the brightness of two objects. • Contrast sensitivity is the reciprocal of the contrast at threshold.
  • 44.
    The various methods: 1.Arden gratings 2. Pelli Robson test 3. Bailey Lovie chart 4. Vision contrast test system (VCTS) by Vistech 5. Cambridge low contrast grating 6. Regan charts 7. FACT charts
  • 45.
    Cambridge low contrastgratings • Rapid and simple screening test performed at a distance of 6m. • 12 pair of plates consisting of stripes of varying contrast. First one is for demonstration and rest are for the proper testing and are numbered from 1-10. The plates are changed sequentially starting from plate 1 till the patient fails to respond. • Then a new series is begun starting 4 plates prior to where the patient failed to respond. Four such series are completed and the score of each series is noted (numbered as per he number of plate read) and added. • The final total value is converted into contrast sensitivity from the provided table.
  • 46.
    PELLI ROBSON contrastsensitivity charts • Two charts and two scoring pads. • Each chart has 6 letters in a row - two triplets of varying contrast. • The test is carried at a distance of 1 meter with patient wearing the best correction. • The patient reads from left hand corner, when he fails to respond, the score of the test is recorded by the faintest triplet out of which at least 2 letters are correctly identified. • The log CS value for this triplet is given by the number on the scoring pad nearest to the triplet, either on the left or the right side. • Each eye is tested separately and then the both eyes together.
  • 48.
    Helpful links • http://www.icoph.org/downloads/visualstandardsreport.pdf •http://books.google.co.in/books?id=lt7fAH0s7QYC&pg=PA468&lpg =PA468&dq=.00145+%3D+how+many+tan?&source=bl&ots=sKtytR DOoJ&sig=LM- pcUl1IcnLNTTdFEHYUna8WEI&hl=en&sa=X&ei=3RRfU- zTO8qyuATc34GwDg&ved=0CCoQ6AEwAA#v=onepage&q=.00145% 20%3D%20how%20many%20tan%3F&f=false • http://www.acuity.de/history/index.php • http://www.icoph.org/dynamic/attachments/resources/icovisualac uity1984.pdf • http://www.eboptometry.com/content/optometry/ebp-resource- step-4-apply/practitioners-students-teachers/development-and- adoption-visual-acuity-charts-based- %E2%80%9Clogmar%E2%80%9D-principles
  • 49.
    THANK YOU EVERYONEFOR PATIENTLY LISTENING TO THIS SEMINAR. For feedbacks & brickbats plz mail at ykush@yahoo.co.in./drdhir2014@gmail.com NO MORE SEMI--NAR KYUNKI ABKI BAR ……..  