Downloaded 127 times


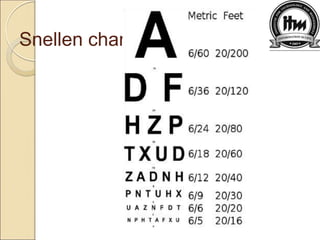
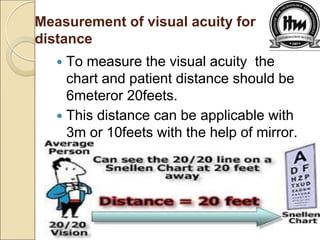
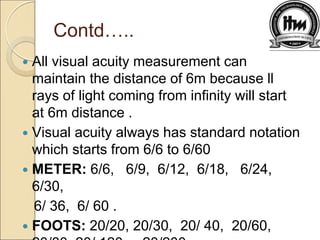
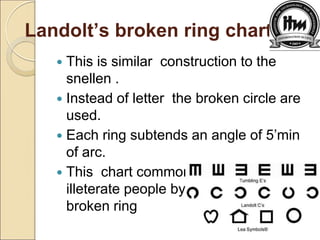
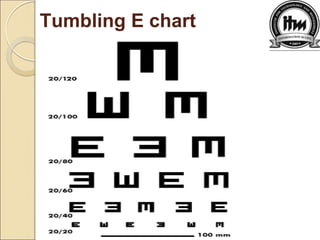
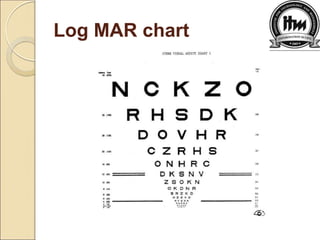
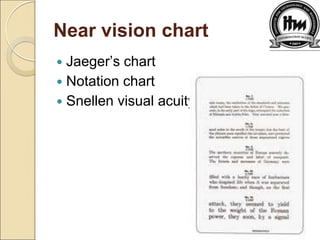
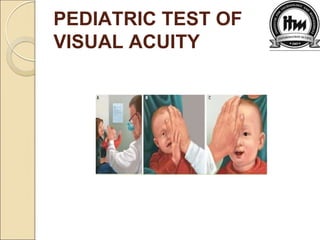
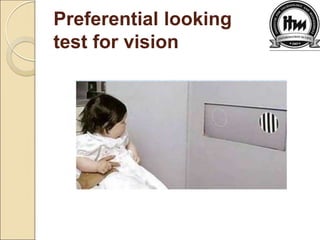

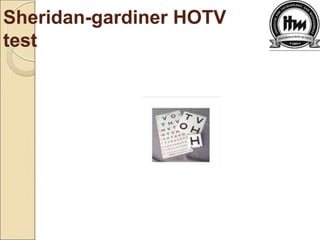


Visual acuity charts and tests are used to measure the visual acuity or clarity of vision of the eyes. There are two main types of charts - distance vision charts and near vision charts. Common distance vision tests include the Snellen chart, Landolt C chart, and LogMAR chart. The Snellen chart uses letters of decreasing size arranged at a standard test distance of 6 meters or 20 feet to measure visual acuity denoted in fractions like 6/6 or 20/20. Near vision tests include the Jaeger chart which uses printed text of decreasing font size. Visual acuity can be measured for different age groups using specialized pediatric tests that do not require reading letters like preferential looking tests.


![ONFH[AVN HIP] -TRIPLE REGIME -A NOVAL SURGICAL CONCEPT .pptx](https://cdn.slidesharecdn.com/ss_thumbnails/onfhavnhip2026koaconcalicutdrgokuldevdrmashraf-260210064517-213ec005-thumbnail.jpg?width=640&height=640&fit=bounds)


![CTEV [ clubfoot] DR ARUN LAL ,DR MOHAMED ASHRAF travancore medical college k...](https://cdn.slidesharecdn.com/ss_thumbnails/ctevclubfootdrarunlaldrmohamedashraftravancoremedicalcollegekollamkeralaindia-260208063247-18fc466c-thumbnail.jpg?width=640&height=640&fit=bounds)
