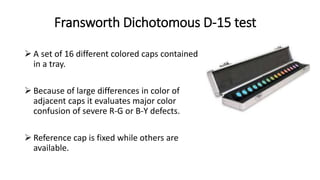
Evaluation of visual functions in low vision patients involves assessing visual acuity, visual fields, color vision, contrast sensitivity, and glare tolerance. Visual acuity is measured using charts with logarithmically progressing optotypes at both distance and near. Other tests include Ishihara plates for color vision, Pelli-Robson chart for contrast sensitivity, and brightness acuity testers for glare sensitivity. Together these evaluations help identify the extent and nature of vision loss to guide low vision rehabilitation.
This is a guide for Visual function assessment in low vision. Useful for Optometrists in providing better care to Low vision Patients by assessing the conditions better.
Visual Rehabilitation in low vision. This power point presentation aims to provide an overview of the various modalities available in order to provide rehabilitation to such patients.
Low vision patient have serious visual problems that have caused serious visual loss.
1. Contrast sensitivity testing and visual field testing
2. subjective testing of patients with media loss
# potential acuity meter
# interferometry
# photostress recovery test
# glare test
# color vision test
# dark adaptometry
3. objective testing of retinal loss
# USG
ERG/EOG
Contrast sensitivity is defined as the Ability to perceive slight change in luminance between regions which are not separated by definite borders or Ability to perceive sharp outlines of relatively small objects or Ability to detect separation of the area of different contrast level
VISUAL ACUITY , Basics of vision assessmentssuserde6356
Visual acuity (VA) is a measure of the ability of the eye to distinguish shapes and the details of objects at a given distance. It is important to assess VA in a consistent way in order to detect any changes in vision. One eye is tested at a time.
Go to:
Indications
To provide a baseline recording of VA
To aid examination and diagnosis of eye disease or refractive error
To assess any changes in vision
To measure the outcomes of cataract or other surgery.
Go to:
Equipment
Multi-letter Snellen or E chart
Plain occluder, card or tissue
Pinhole occluder
Torch or flashlight
Patient's documentation.
Go to:
Procedure
Ensure good natural light or illumination on the chart. It is important to ensure that the person has the best possible chance of seeing and reading the test chart as treatment decisions are made based on the results of VA testing.
If the test is done outdoors, the chart should be in bright light and the patient in the shade, with enough light to illuminate the patient's face during the test.
Explain the procedure to the patient. Tell patients that it is not a test that they have to pass, but a test to help us know how their eyes are working. Tell them not to guess if they cannot see.
Ensure that any equipment that the patient touches is clean and is cleaned between patients. Infections can be passed between patients if equipment – or the testers' hands – are not clean.
Position the patient, sitting or standing, at a distance of 6 metres from the chart. The patient can hold one end of a cord or rope of 6 metres long to ensure that the distance is maintained
Test the eyes one at a time, at first without any spectacles (if worn).
Note: Some people prefer to always test the right eye first. Others prefer to test the ‘worse’ eye first (ask the patient out of which eye they see best). This ensures that the minimum is read with the ‘worse’ eye, and more will be read with the ‘good’ eye. This means that no letters are remembered, which could make the second visual acuity appear better than it is.
An external file that holds a picture, illustration, etc.
Object name is jceh_27_85_016_f04.jpg
Visual acuity should be measured from a standard distance, using a standard chart with a white background
Ask the patient to cover one eye with a plain occluder, card or tissue. They should not press on the eye; this is not good for an eye that has undergone surgery. It can also make any subsequent intraocular pressure reading inaccurate and it will distort vision when the occluded eye is tested.
Ask the patient to read from the top of the chart and from left to right. If the patient cannot read the letters due to language difficulties, use an E chart. The patient is asked to point in the direction the ‘legs’ of the E are facing.
Note: there is a one in four chance that the patient can guess the direction; therefore it is recommended that the patient should correctly indicate the orientation of most letters of the same size, e.g. four out of five or five out
Optometry instruments is a presentation to describe instrument in a beautiful way. use this tool to improve your knowledge. stay blessed. Regards Muhammad Akbar Rashid Qadri.
Unit 8 - Information and Communication Technology (Paper I).pdfThiyagu K
This slides describes the basic concepts of ICT, basics of Email, Emerging Technology and Digital Initiatives in Education. This presentations aligns with the UGC Paper I syllabus.
Instructions for Submissions thorugh G- Classroom.pptxJheel Barad
This presentation provides a briefing on how to upload submissions and documents in Google Classroom. It was prepared as part of an orientation for new Sainik School in-service teacher trainees. As a training officer, my goal is to ensure that you are comfortable and proficient with this essential tool for managing assignments and fostering student engagement.
Welcome to TechSoup New Member Orientation and Q&A (May 2024).pdfTechSoup
In this webinar you will learn how your organization can access TechSoup's wide variety of product discount and donation programs. From hardware to software, we'll give you a tour of the tools available to help your nonprofit with productivity, collaboration, financial management, donor tracking, security, and more.
We all have good and bad thoughts from time to time and situation to situation. We are bombarded daily with spiraling thoughts(both negative and positive) creating all-consuming feel , making us difficult to manage with associated suffering. Good thoughts are like our Mob Signal (Positive thought) amidst noise(negative thought) in the atmosphere. Negative thoughts like noise outweigh positive thoughts. These thoughts often create unwanted confusion, trouble, stress and frustration in our mind as well as chaos in our physical world. Negative thoughts are also known as “distorted thinking”.
Model Attribute Check Company Auto PropertyCeline George
In Odoo, the multi-company feature allows you to manage multiple companies within a single Odoo database instance. Each company can have its own configurations while still sharing common resources such as products, customers, and suppliers.
How to Split Bills in the Odoo 17 POS ModuleCeline George
Bills have a main role in point of sale procedure. It will help to track sales, handling payments and giving receipts to customers. Bill splitting also has an important role in POS. For example, If some friends come together for dinner and if they want to divide the bill then it is possible by POS bill splitting. This slide will show how to split bills in odoo 17 POS.
Palestine last event orientationfvgnh .pptxRaedMohamed3
An EFL lesson about the current events in Palestine. It is intended to be for intermediate students who wish to increase their listening skills through a short lesson in power point.
Read| The latest issue of The Challenger is here! We are thrilled to announce that our school paper has qualified for the NATIONAL SCHOOLS PRESS CONFERENCE (NSPC) 2024. Thank you for your unwavering support and trust. Dive into the stories that made us stand out!
Home assignment II on Spectroscopy 2024 Answers.pdf
Visual function in LV patients.pptx
1. Evaluation of visual functions
in low vision patient
Presenter
Prakash Jha
2nd Year
B. Optometry
2. Objectives
To describe normal visual functions
To explain and record distance and near acuities in low vision.
To describe the low vision refraction.
To explain the kinetic visual field in low vision patient.
To explain the color vision test used in low vision.
To state the contrast sensitivity in low vision patient.
3. Visual Function
Visual function: A person’s ability to integrate the components of
vision effectively to accomplish a task.
Category of visual functions
• Visual acuity
• Visual field
• Color vision
• Contrast sensitivity
• Glare
4. Low Vision
WHO Definition
The impairment of visual functioning even
after treatment and /or standard refractive
correction and has
• a visual acuity of less than 6/18 to light
perception or
• a visual field of less than 10 degree from
the point of fixation, but who uses or
• is potentially able to use vision for the
planning and /or execution of a task.
5. Visual function in Low Vision
Vision loss may not be corrected by glasses, contact lenses, surgery,
or medical treatment.
Cause of vision loss
• Loss of central vision (e.g., AMD, diabetic retinopathy)
• Loss of peripheral vision (e.g., glaucoma, stroke, retinitis pigmentosa)
• Blindness (e.g., various acquired and hereditary eye conditions)
• Blurred or hazy vision (e.g., corneal disorders)
Assessing the visual function will help
• identify the extent of vision impairment and
• make the best use of low vision patient’s remaining vision to regain or retain
their independence and quality of lives
6. Visual Acuity
Visual Acuity : Measurement of threshold of discrimination of two
spatially separated targets.
Measures minimum angular size of detail that can just be resolved.
Testing distance is 6 m for distance and 40 cm for near.
Increase the size of target acuity (e.g., 6/6) using magnifying devices
to the patient’s threshold acuity (e.g., 6/60)
7. Objectives of VA Evaluation in Low Vision
Provides the examiner with baseline information from which the
course of pathology may be monitored.
Essential for calculating a patient’s device magnification.
Provides the patient with an appreciation for residual vision.
Documents a level of VA that may establish eligibility for services ,
benefits and even driving privileges.
8. WHO Classification
S.N
.
Visual Acuity (Snellen
Notation)
Classification Grading
1 ≥6/18 Normal Normal
2 <6/18-6/60 Moderately VI Low Vision
3 <6/60-3/60 Severely VI Low Vision
4 <3/60-PL Legally Blind Blindness
5 NPL Totally Blind Blindness
9. Types of Distance VA Charts
Feinbloom distance test chart
Ferris-bailey ETDRS chart
Sloan distance acuity chart
Bailey-lovie chart
10. Feinbloom Distance Test Chart
Consists of numeric optotypes
Calibrated for 20 ft but may be used at any distance
As the size of optotypes decreases , more numbers
are added to each row
Because of the reduced number of optotypes ,
numerals are easier to guess than letters
11. Ferris-Bailey ETDRS Chart
Consistent number of letters i.e 5 in each row
Seperation between optotypes and between
rows of optotypes are proportional to the size of
the optotypes
Results in smaller spacing in the higher visual
acuity levels , giving the chart its characteristics
triangular configuration.
Geometric (log MAR) progression of size
difference between lines.
12. Ferris-Bailey ETDRS Chart
Optotypes on each line are 0.1 log unit or 25% larger than the preceding
line
Logarithmic progression and proportional spacing of optotypes allows for
consistent and accurate evaluation of visual acuity levels
May be used at any distance , but testing distance are typically 4m or 2m
Available in Landolt C configuration , LEA symbol test system , HOTV chart
for pediatric low vision patient
14. Types of Near Acuity Charts
Charts using M notation
Reduced snellen’s chart
Sloan M series charts
Reduced Ferris Bailey ETDRS chart
Lighthouse game card
Lighthouse continuous text card
MNREAD card
Charts using N notation
N system chart
15. Sloan M series charts
A 1 M optotype will subtend 5’ of arc at 1 m.
A 1M letter viewed at 1m may be equated to
snellen acuity in the following manner.
1.00/1M = 20/20 snellen equivalent
Because near acuity is frequently measured at
40cm , 1M is equivalent to 20/50 at 40 cm.
Testing may occur at any distance.
Recorded as Testing distance (meters)/ M notation
For example, 3M at 25 cm would be recorded as
0.25/3M
16. Reduced snellen’s chart
Designed such that a 20/20 letter
subtend a 5’ angle at a given
distance (typically 40cm).
As in standard Snellen distance
charts, the levels of acuities are
limited.
17. N system chart
An 8-point optotype (N8) subtends 5’ of arc at 1m viewing distance.
N notation may be converted to M notation by dividing by 8.
E.g N4 is equivalent of 0.5M print.
18. Reduced Ferris Bailey ETDRS Chart
Maintains a constant number of letters in each row.
There is geometric progression of size differences between lines.
Consistent and accurate evaluation of VA levels.
May be used at any distance.
Provides Snellen equivalent acuities for 40 cm and 20 cm.
19. Lighthouse Game Card
Uses the same geometric progression as the single
letter chart with each three row progression
representing a half or double of VA levels at any
viewing distance.
May be used at any distance , but the snellen
equivalent provided are calculated at 40cm.
20. Lighthouse Continuous Text Card
Follows same geometric progression as
the lighthouse game card.
Recorded VA may be poorer than single
letter VA , especially in cases in which
central scotomas are present.
Snellen equivalent noted on the testing
card are calculated for 40cm.
21. MN Read Card
Combines a quick reading performance
assessment with a reading acuity assessment.
Reading passages are printed in decreasing M
sizes in logarithmic progression from 8.0M to
below 0.2M.
Enables the examiner to determine optimal
print size for fluent reading tasks.
22.
23. Refraction in Low Vision
Patient with low vision may have high prevalence of refractive error,
along with unclear optical media
• Multitude of refraction techniques should be used
• Assess VA with multiple pinhole to see any improvement
• Perform radical retinoscopy for unclear media
• Stenopaic slit refraction for astigmatism
24. Refraction in Low Vision
Objective retinoscopy with pupil dilation (if media is not clear) shall
be followed by subjective refraction (with normal pupil)
Common techniques of subjective refraction
• Bracketing
• Stenopaic slit refraction
25. Bracketing
It involves changing from presenting high minus lens and then high
plus lens.
Large and equal steps of dioptric changes are made.
Then reducing the size for the dioptric changes.
Until the finest and just detectable blur is induced by equal steps
above and below the refractive errors.
26. Just Noticeable Difference
The amount of spherical lens power needed to elicit an appreciable
change in clarity or blur is called the just noticeable difference.
The lower the acuity , the larger the JND.
The denominator of the 20 foot snellen acuity is a good rule-of-thumb
estimator of the JND for a given eye.
For example, a 20/200 eye will be sensitive to a lens change of
approximately 2.00 diopters using this rule.
27. Stenopaic Slit Refraction
A slit aperture of 0.5 to 2.0 mm can be introduced.
With slit in one orientation, sphere that gives clearest vision is
determined.
This provides the power correction for the meridian corresponding to
the slit orientation.
The slit is then rotated 90 degree and spherical lenses are introduced
until the lens giving clearest vision is determined.
This gives power correction required for second meridian.
28. Visual field
Visual field: That portion of space in which objects are visible at the
same moment during steady fixation of gaze in one direction.
Regular visual field testing can help to monitor the potential vision
loss over time.
30. Uses of visual field in low vision
To document visual field parameter for legal blindness.
To fulfill the eligibility criteria for those states which require a minimum
visual field.
Orientation and Mobility: learn skills and influence plan for rehabilitation.
To follow disease progression.
It helps to characterized the patient vision loss and design devices and
strategies to allow the patients to achieve maximum potential.
31. Consequences of Visual field defects in low vision
Central field defect
• Partial perception of people and
objects
• Cannot discriminate fine details
• Poor color vision
Peripheral field defect
• Mobility problems
• Slow dark adaptation
• Glare and photophobia
• Poor near vision
Hemianopic field defect
• Distorted sight
• Double vision
• Visual hallucination
33. Amsler Grid
Measures central 20 degree.
Look for distortion.
Uses reading glasses.
It consists of seven grid like charts
each with slightly different patterns
34.
35. Tangent Screen
Measures central 30 degree.
Tests at 30 cm distance.
Vary target size based on patients
visual sensitivity/acuity typically
beginning with a 3 mm white
target.
36. Bernell Disc Perimetry
A kinetic perimeter ; uses plastic disc
formed in a semicircle.
To test the nasal and temporal boundary -
disc oriented horizontally
To test superior and inferior boundary – disc
oriented vertically
A stimulus is mechanically moved across the
arc from non seeing area to seeing area.
37. Goldmann Perimetry
Evaluate both the central and
peripheral visual field.
Standard test performed by most
perimetrists.
Test targets: dots of varying size and
illumination.
38. Goldmann Perimetry : Target Size
Sizes of stimuli (0 to V scale)
Each size increment equals: a two fold increase in diameter and a
fourfold increase in area.
39. Automated Visual Field
Light stimuli is presented in a fixed
position in the VF.
The size of stimuli is constant and varied
in intensity until patient is just able to
detect it.
40. Confrontation Visual Field Exam
A simple and preliminary test.
Extent of VF tested by this method is
120 degree
Examiner separated with the patient
by a distance of about 60cm and
asked to cover one eye and stare at
the examiner.
41. Confrontation Visual Field Exam
When the patient covers their right eye, the examiner covers their left
eye, and vice versa.
The examiner will then move his hand from a position as far as possible
from the line of sight inward until patient reports seeing it.
This process should be repeated in each of the four quadrants.
The target should be moved in a plane equidistant from the examiner
so that the examiner may compare the patient’s VF with his/her own
VF.
42. Color Vision
Color vision is the perception of color induced by different
wavelength of visible spectrum.
Color vision testing helps to monitor the progression of a disease.
It helps to monitor the level of difficulty a patient may have
performing tasks that require processing of colour information.
43. Tools for Measuring Color Vision
Ishihara Pseudoisochromatic Plates
Fransworth D-15 Dichotomous Test (low vision version)
Anomaloscope
44. Ishihara Plates
Ideal for screening.
Detection of presence of protan/deutan.
Currently available editions are- 38, 24 and
16 plate version.
For detection of color vision defect 38 plate
edition is generally used.
46. Diagnostic marker
38 plate edition
• 4 or less - normal
• 8 or more – CV defect
24 plate edition
• 2 or less – normal
• 6 or more – CV defect
47. Fransworth Dichotomous D-15 test
A set of 16 different colored caps contained
in a tray.
Because of large differences in color of
adjacent caps it evaluates major color
confusion of severe R-G or B-Y defects.
Reference cap is fixed while others are
available.
48.
49. Anomaloscope
Patient looks into the anomaloscope via
eyepiece to view a bipartite color field.
The observer is advised to mix red and
green colors in such a way that the
mixture should match the yellow color
disc.
50. Contrast sensitivity
The ability to perceive slight changes in luminance between regions
which are not separated by definite borders.
It is just as important as the ability to perceive sharp outlines of
relatively small objects.
51. Why CS in low vision
To detect abnormal visual performance.
To predict performance on specific visual task.
• Driving ability
• Mobility
• Face recognition
• Sports
Contrast provides critical information about
• Edges
• Borders and
• Variation in brightness.
To diagnose ocular disease and monitor its states.
52. Implication in Low Vision
Loss of high spatial frequency contrast usually indicates problem with
near point and reading task.
Loss of low spatial frequency contrast usually indicates problem with
orientation, mobility and night time travel.
56. Hiding Heidi
Determines the level of
contrast that an infant can
detect.
Four cards printed on both
sides in the following contrast
levels: black, 25%, 10%, 5%,
2.5% and 1.25%.
57. Glare
The presence of one or more areas in the field of vision that are of
sufficient brightness to cause discomfort in vision.
Glare sensitivity has been shown to be an important factor in hindering
the mobility of low vision patients.
Tools for glare testing
• Brightness Acuity Tester
• Optec 1500 Glare tester
• Miller-Nadler Glare tester
• Terry Vision Analyzer
58. Summary
VA < 6/18 or VF of less than 10 degree from either side of fixation is
considered as low vision.
chart following logarithmic progression is used for distance VA
assessment.
Fransworth Dichotomous D-15 (Low vision version) is used for color
vision assessment.
Pelli – Robson chart is used for contrast sensitivity assessment.
Low vision can have a significant impact on daily life.
Understanding the changes in visual functions, can provide better
support and care for those with low vision.
Demonstration; normal and cvd sees the same transformation;normal 1 cvd other vanishing; normal cv sees hidden digit;normal doesnot see diagnostic;cvd see one no. more easily than others