Downloaded 328 times
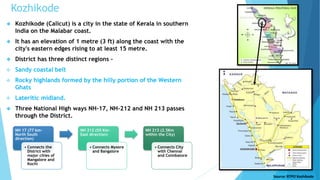
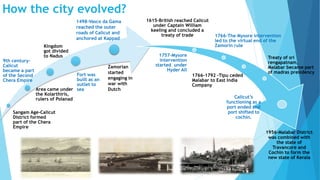
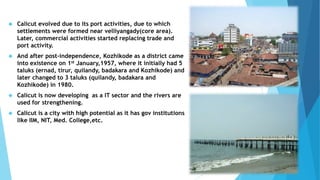
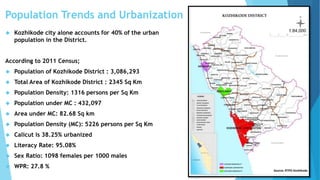
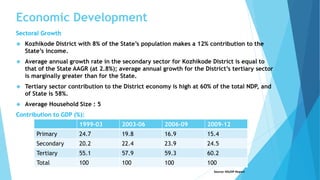
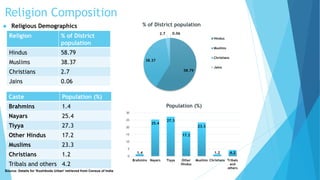
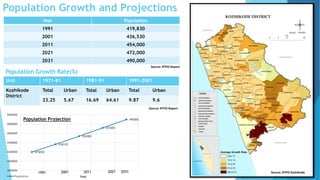


Kozhikode, Kerala is a coastal city located on the Malabar coast. It has a population of over 3 million according to the 2011 Census and is 38% urbanized. The document discusses Kozhikode's history, population growth, land use, economic activities, infrastructure services like water, sanitation, transport and key issues facing development. It provides statistics on demographics, religious composition, housing and outlines the evolution of the city from a port town established in the 9th century.


