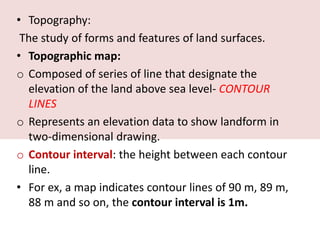
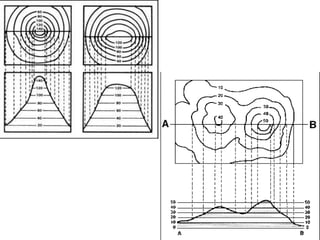
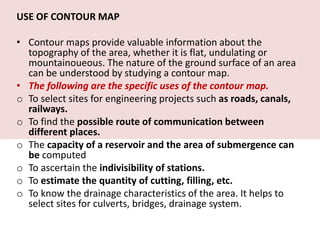
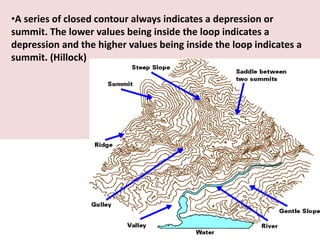
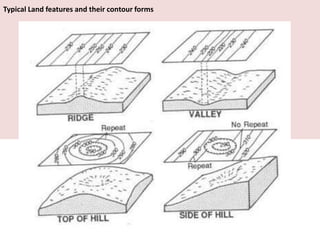
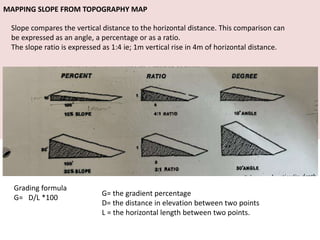
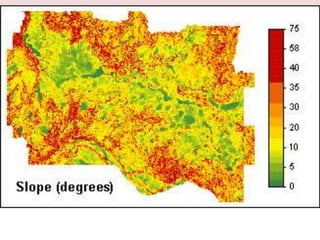
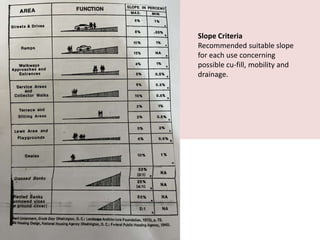
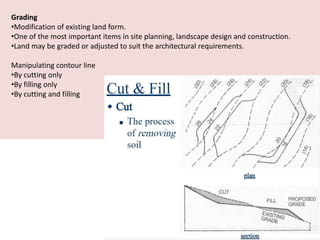
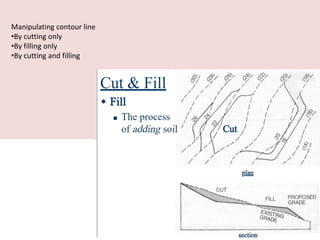
This document discusses the study of topography and contour maps. It defines topography as the study of land surfaces and their features. Contour maps represent elevation data through a series of contour lines that connect points of equal elevation. Characteristics of contour lines such as spacing and shape can indicate features of the landscape like slopes, hills, and depressions. Contour maps are useful for engineering projects, route planning, and understanding the drainage of an area. Slope can be measured from contour maps by comparing vertical and horizontal distances between points. Land can be graded by modifying contours through cutting, filling, or both.
• Topography:
The studyof forms and features of land surfaces.
• Topographic map:
o Composed of series of line that designate the
elevation of the land above sea level- CONTOUR
LINES
o Represents an elevation data to show landform in
two-dimensional drawing.
o Contour interval: the height between each contour
line.
• For ex, a map indicates contour lines of 90 m, 89 m,
88 m and so on, the contour interval is 1m.
4.
USE OF CONTOURMAP
• Contour maps provide valuable information about the
topography of the area, whether it is flat, undulating or
mountainoueous. The nature of the ground surface of an area
can be understood by studying a contour map.
• The following are the specific uses of the contour map.
o To select sites for engineering projects such as roads, canals,
railways.
o To find the possible route of communication between
different places.
o The capacity of a reservoir and the area of submergence can
be computed
o To ascertain the indivisibility of stations.
o To estimate the quantity of cutting, filling, etc.
o To know the drainage characteristics of the area. It helps to
select sites for culverts, bridges, drainage system.
5.
Characteristics of Contours
Thefollowing characteristics help in plotting or reading
a constant map.
• All the points on a contour line have the same
elevation.
• The elevations of the contour are indicated either by
inserting the figure in a break in respective contour or
printed close to the contour.
• Two contour lines do not intersect with each other.
• Contour lines always from a closed circuit. But these
lines may be within or outside the limit of the map.
• Contour do not have sharp turning.
6.
Characteristics of Contours
•The contour lines are closer near the top of a hill or
high ground and wide apart near the foot.
• This indicates a very steep slope towards the peak
and a flatter slope towards the foot.
• The contour lines are closer near the bank of a pond
or depression and wide towards the centre. This
indicates a steep slope near the bank and a flatter
slope at the centre.
• Uniformly spaced contour lines indicate a uniform
slope.
9.
•A series ofclosed contour always indicates a depression or
summit. The lower values being inside the loop indicates a
depression and the higher values being inside the loop indicates a
summit. (Hillock)
MAPPING SLOPE FROMTOPOGRAPHY MAP
Slope compares the vertical distance to the horizontal distance. This comparison can
be expressed as an angle, a percentage or as a ratio.
The slope ratio is expressed as 1:4 ie; 1m vertical rise in 4m of horizontal distance.
Grading formula
G= D/L *100
G= the gradient percentage
D= the distance in elevation between two points
L = the horizontal length between two points.
Grading
•Modification of existingland form.
•One of the most important items in site planning, landscape design and construction.
•Land may be graded or adjusted to suit the architectural requirements.
Manipulating contour line
•By cutting only
•By filling only
•By cutting and filling