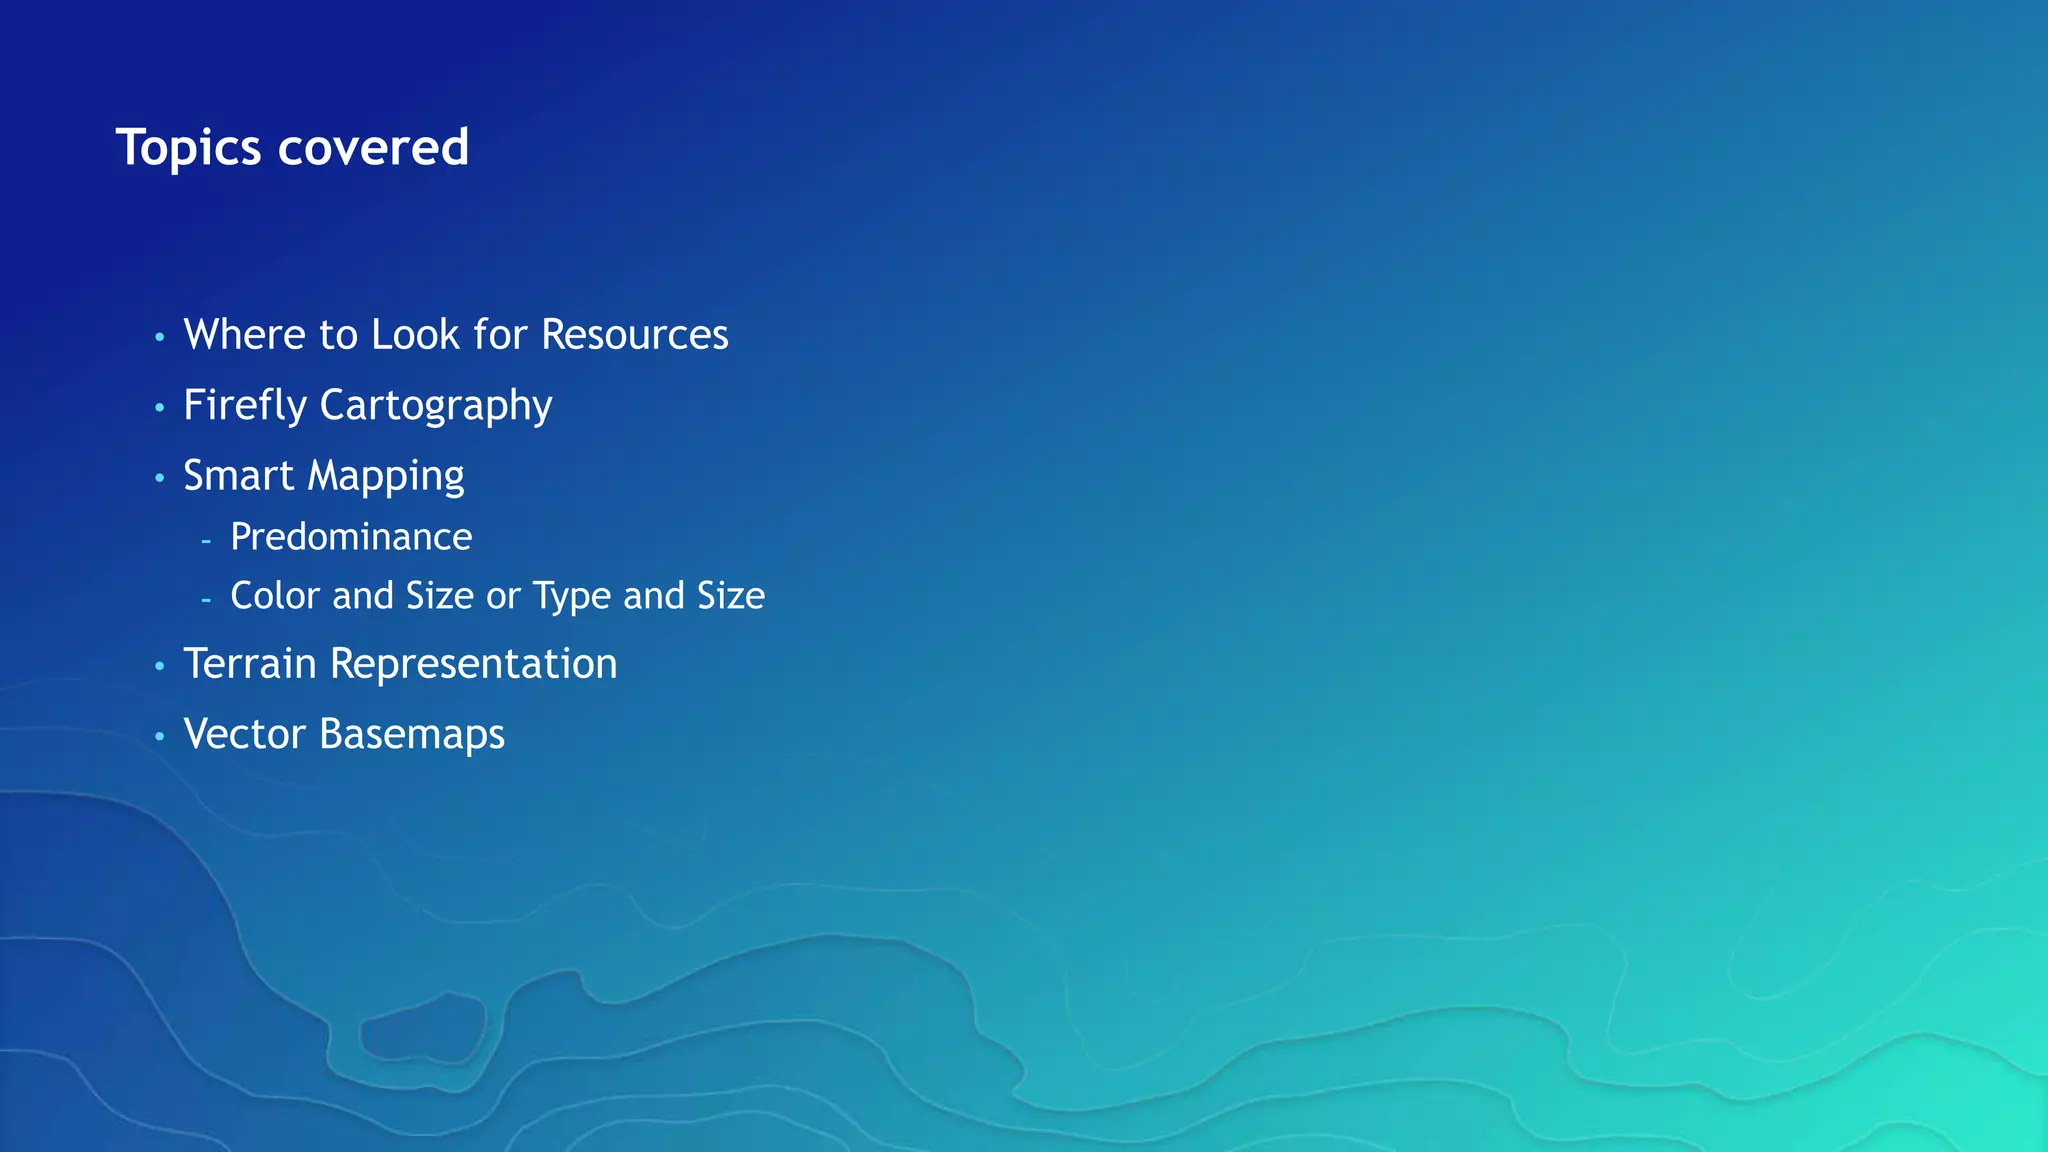
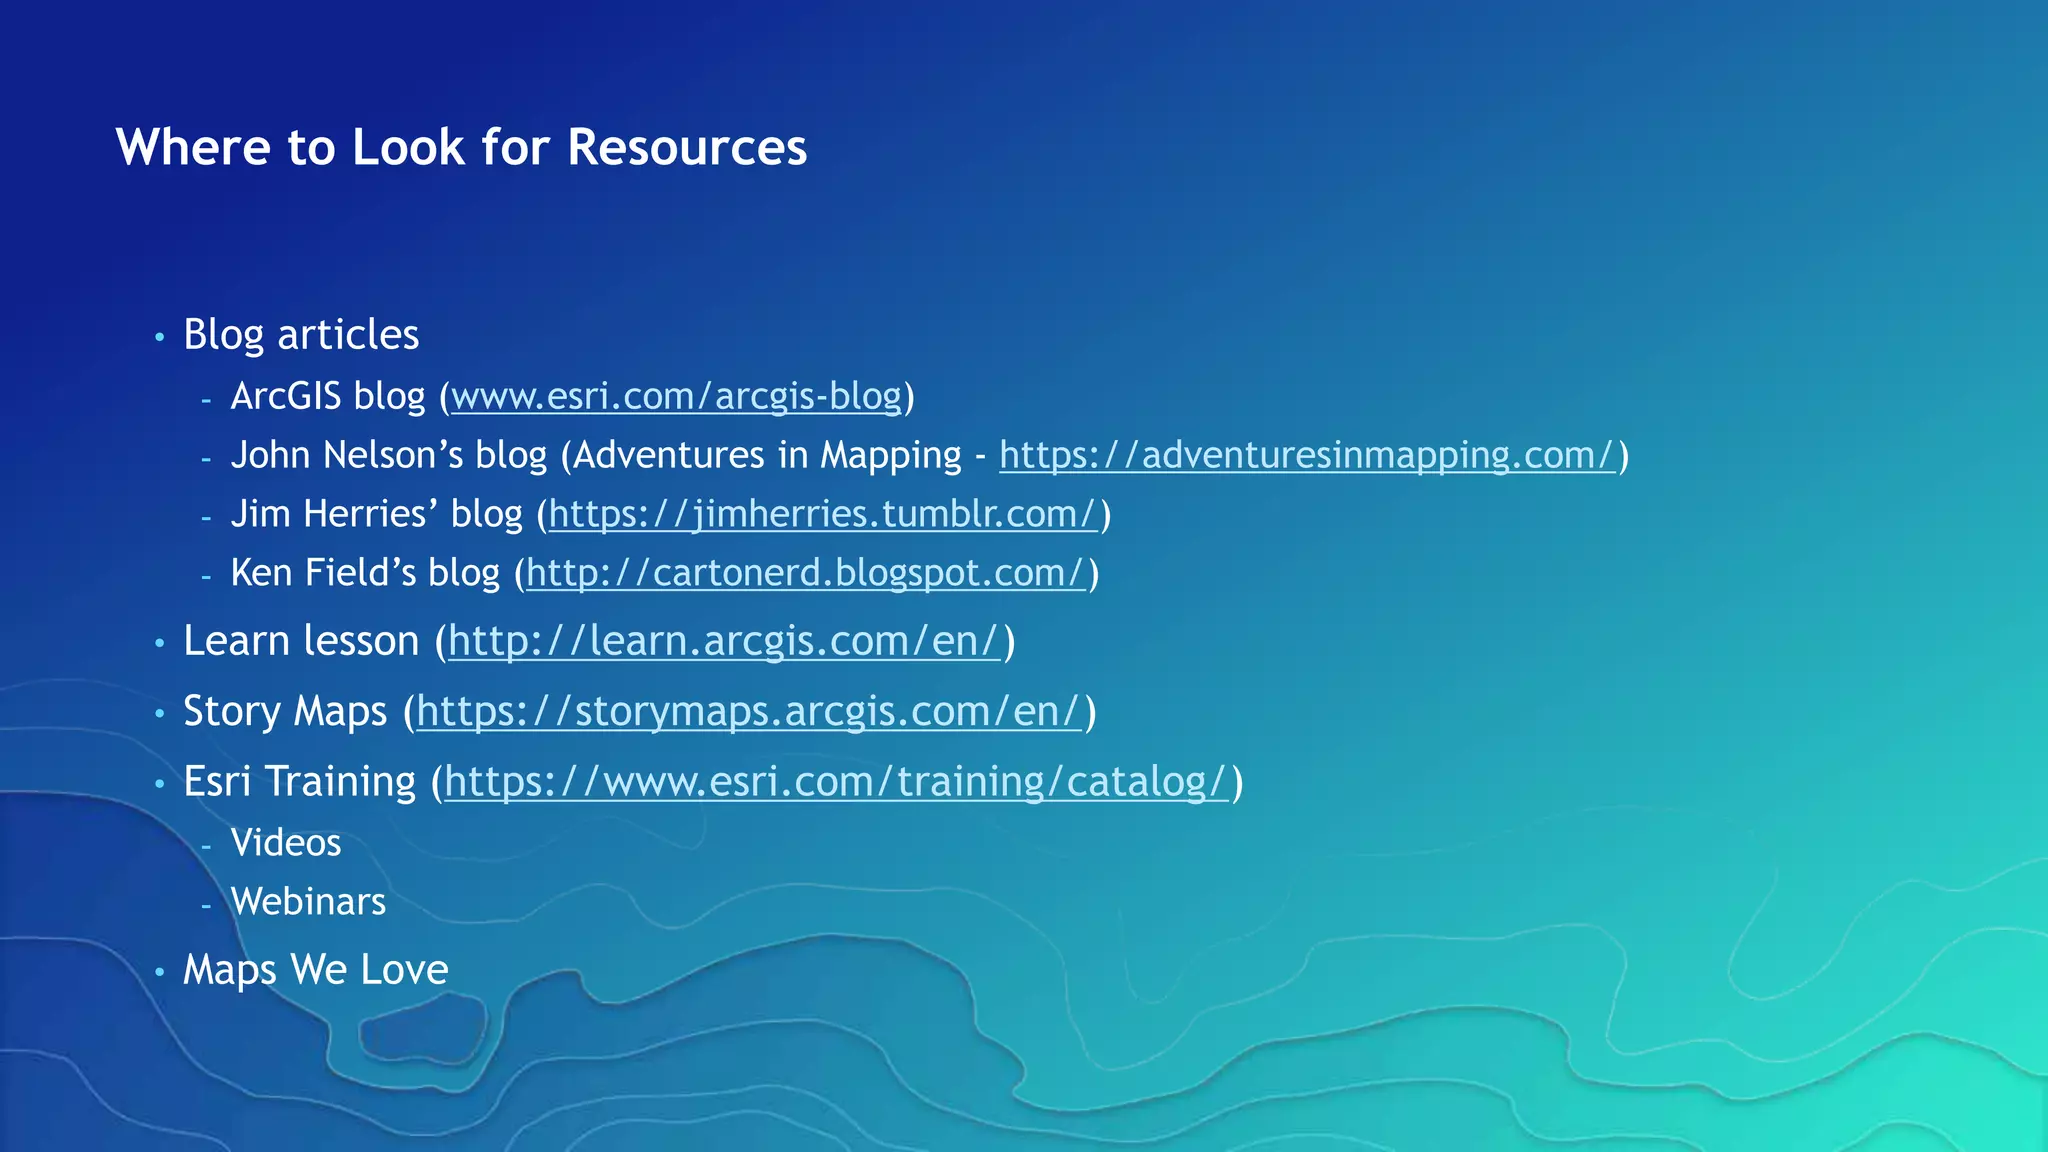
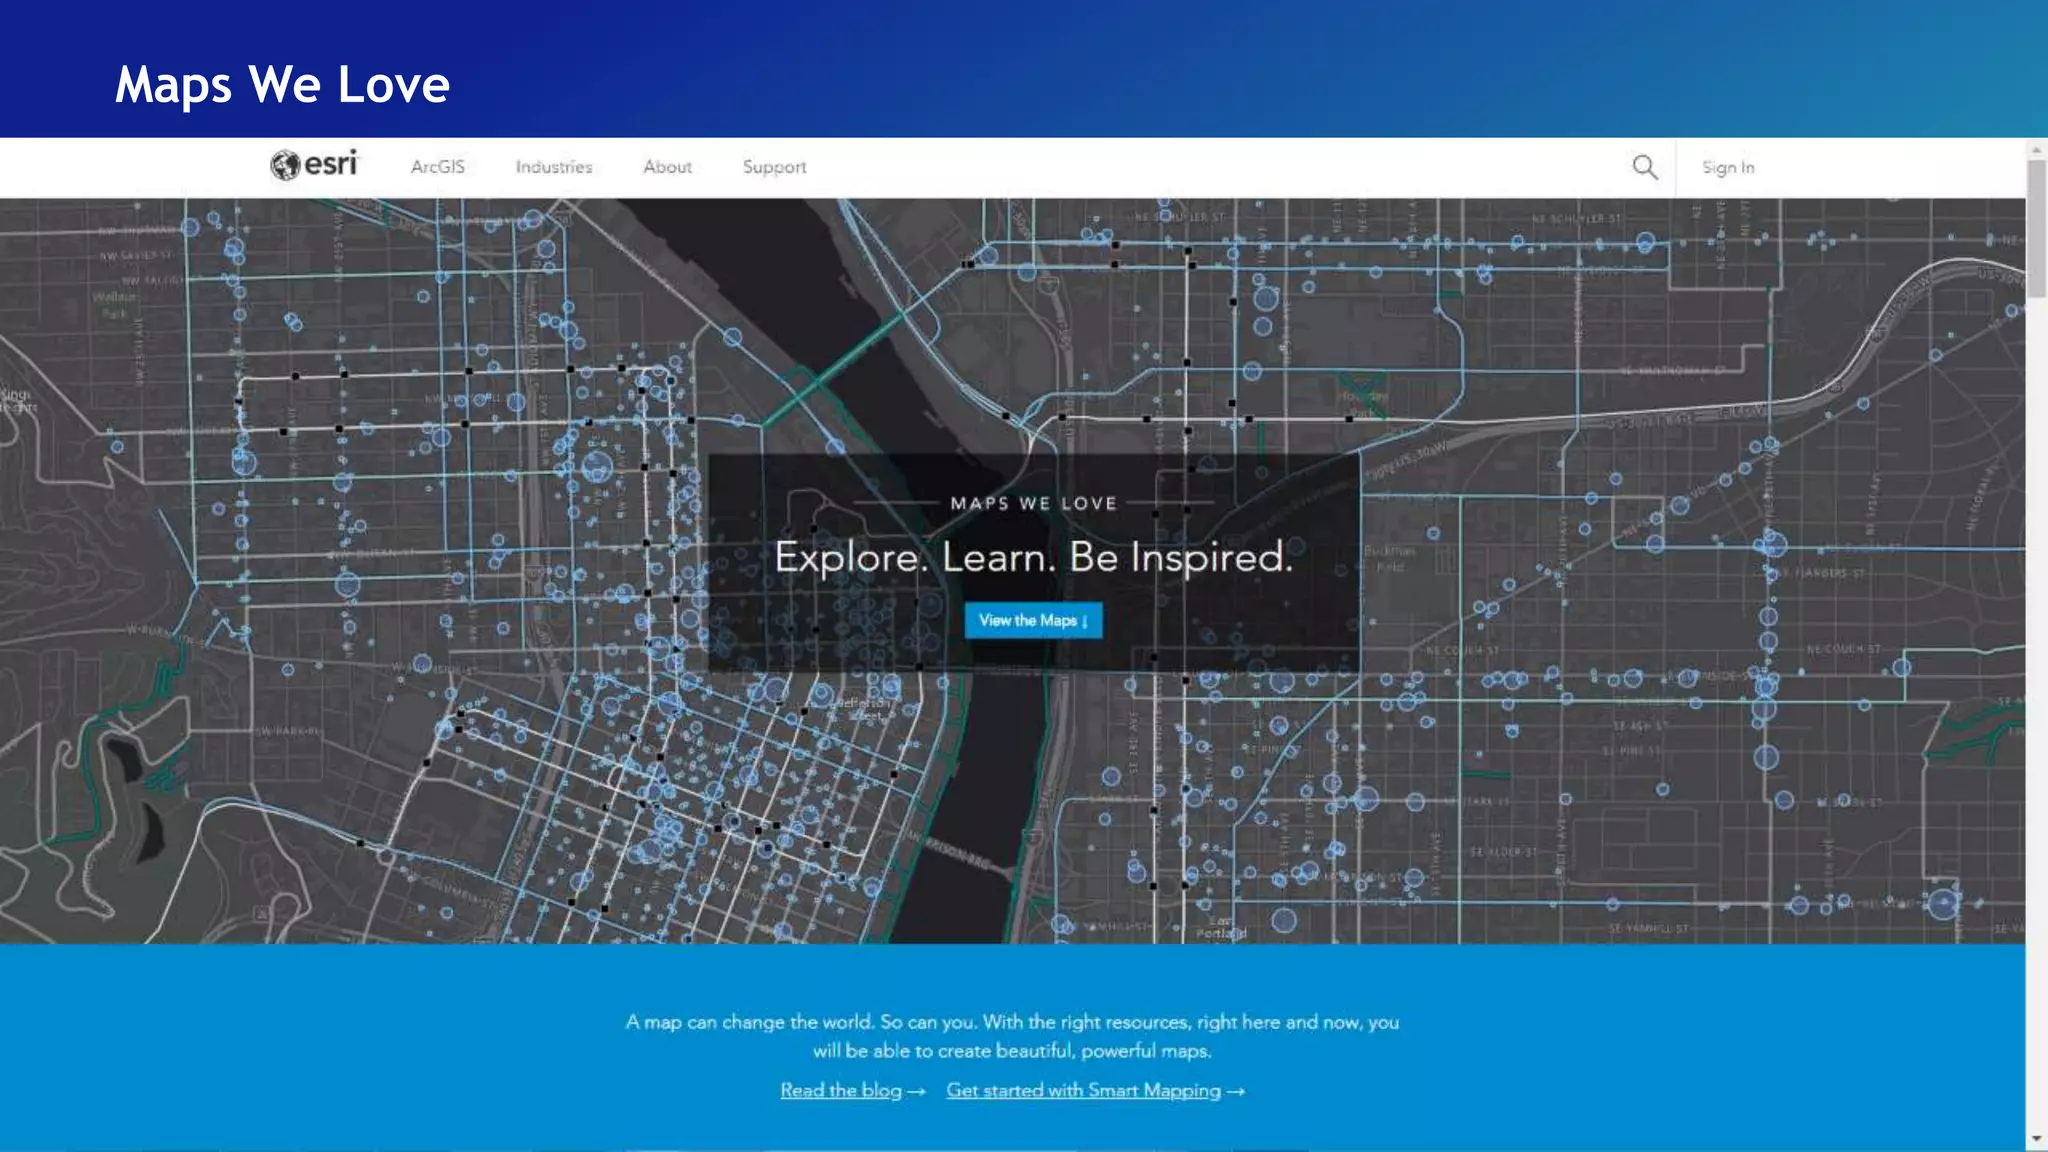
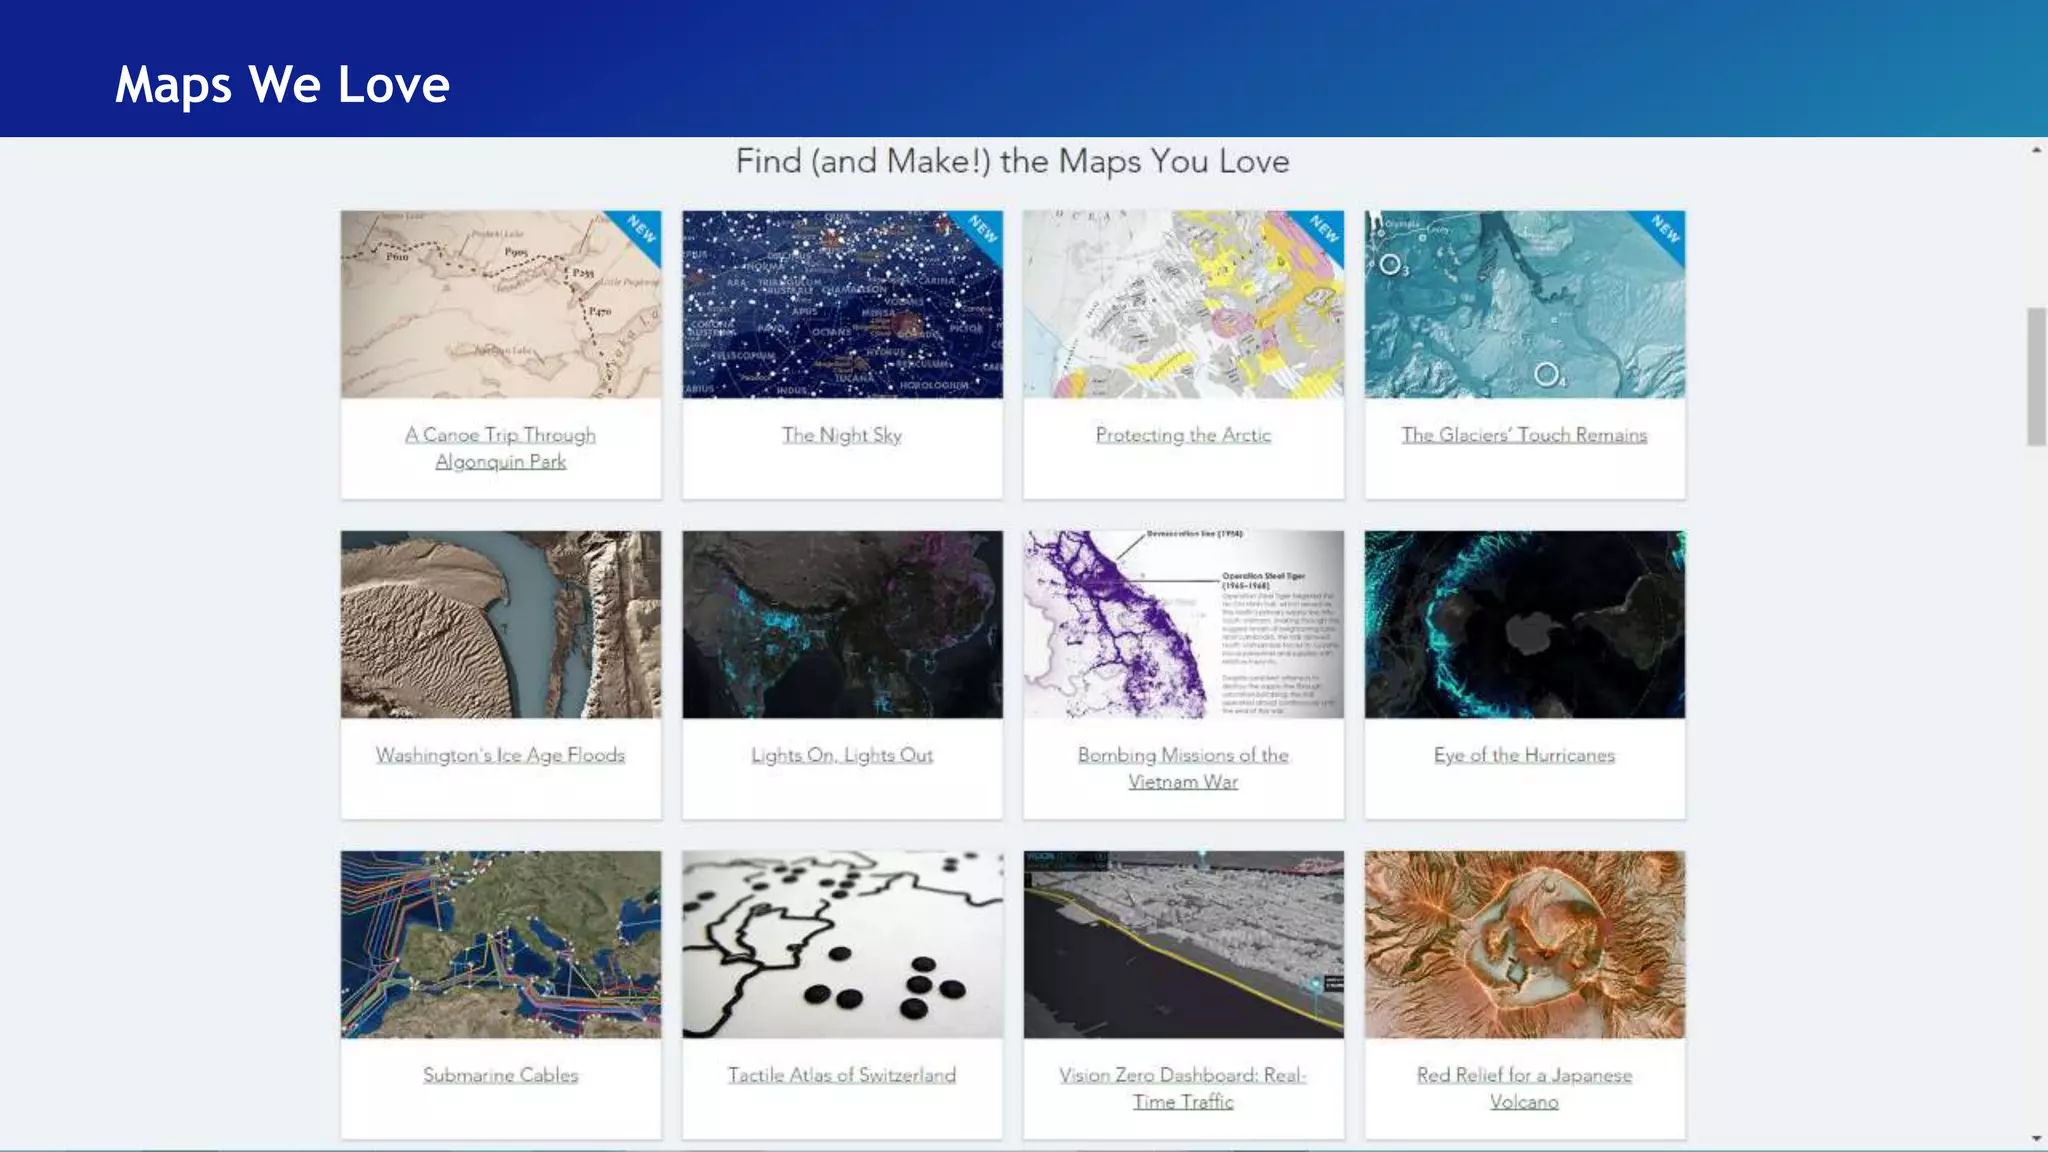
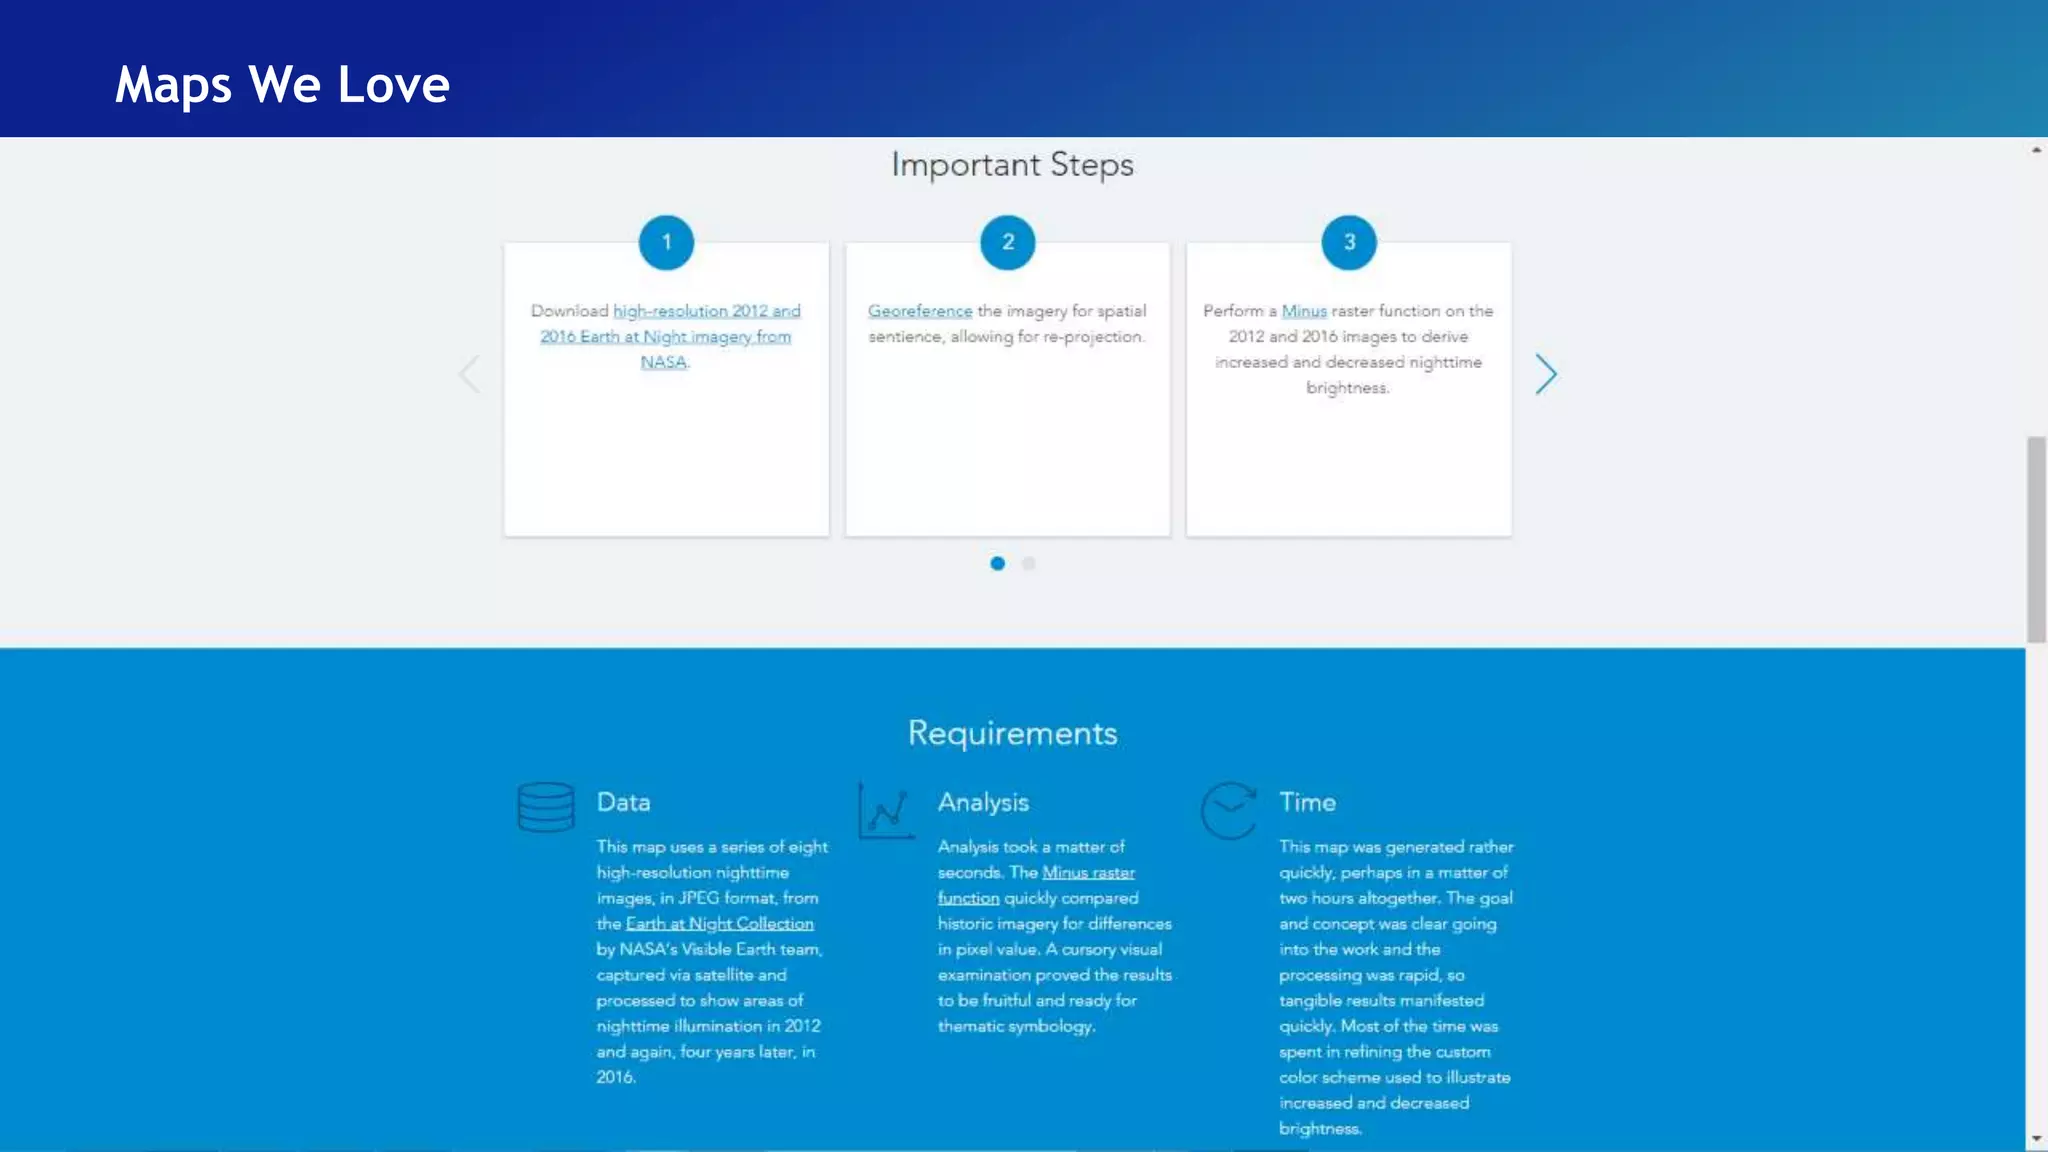
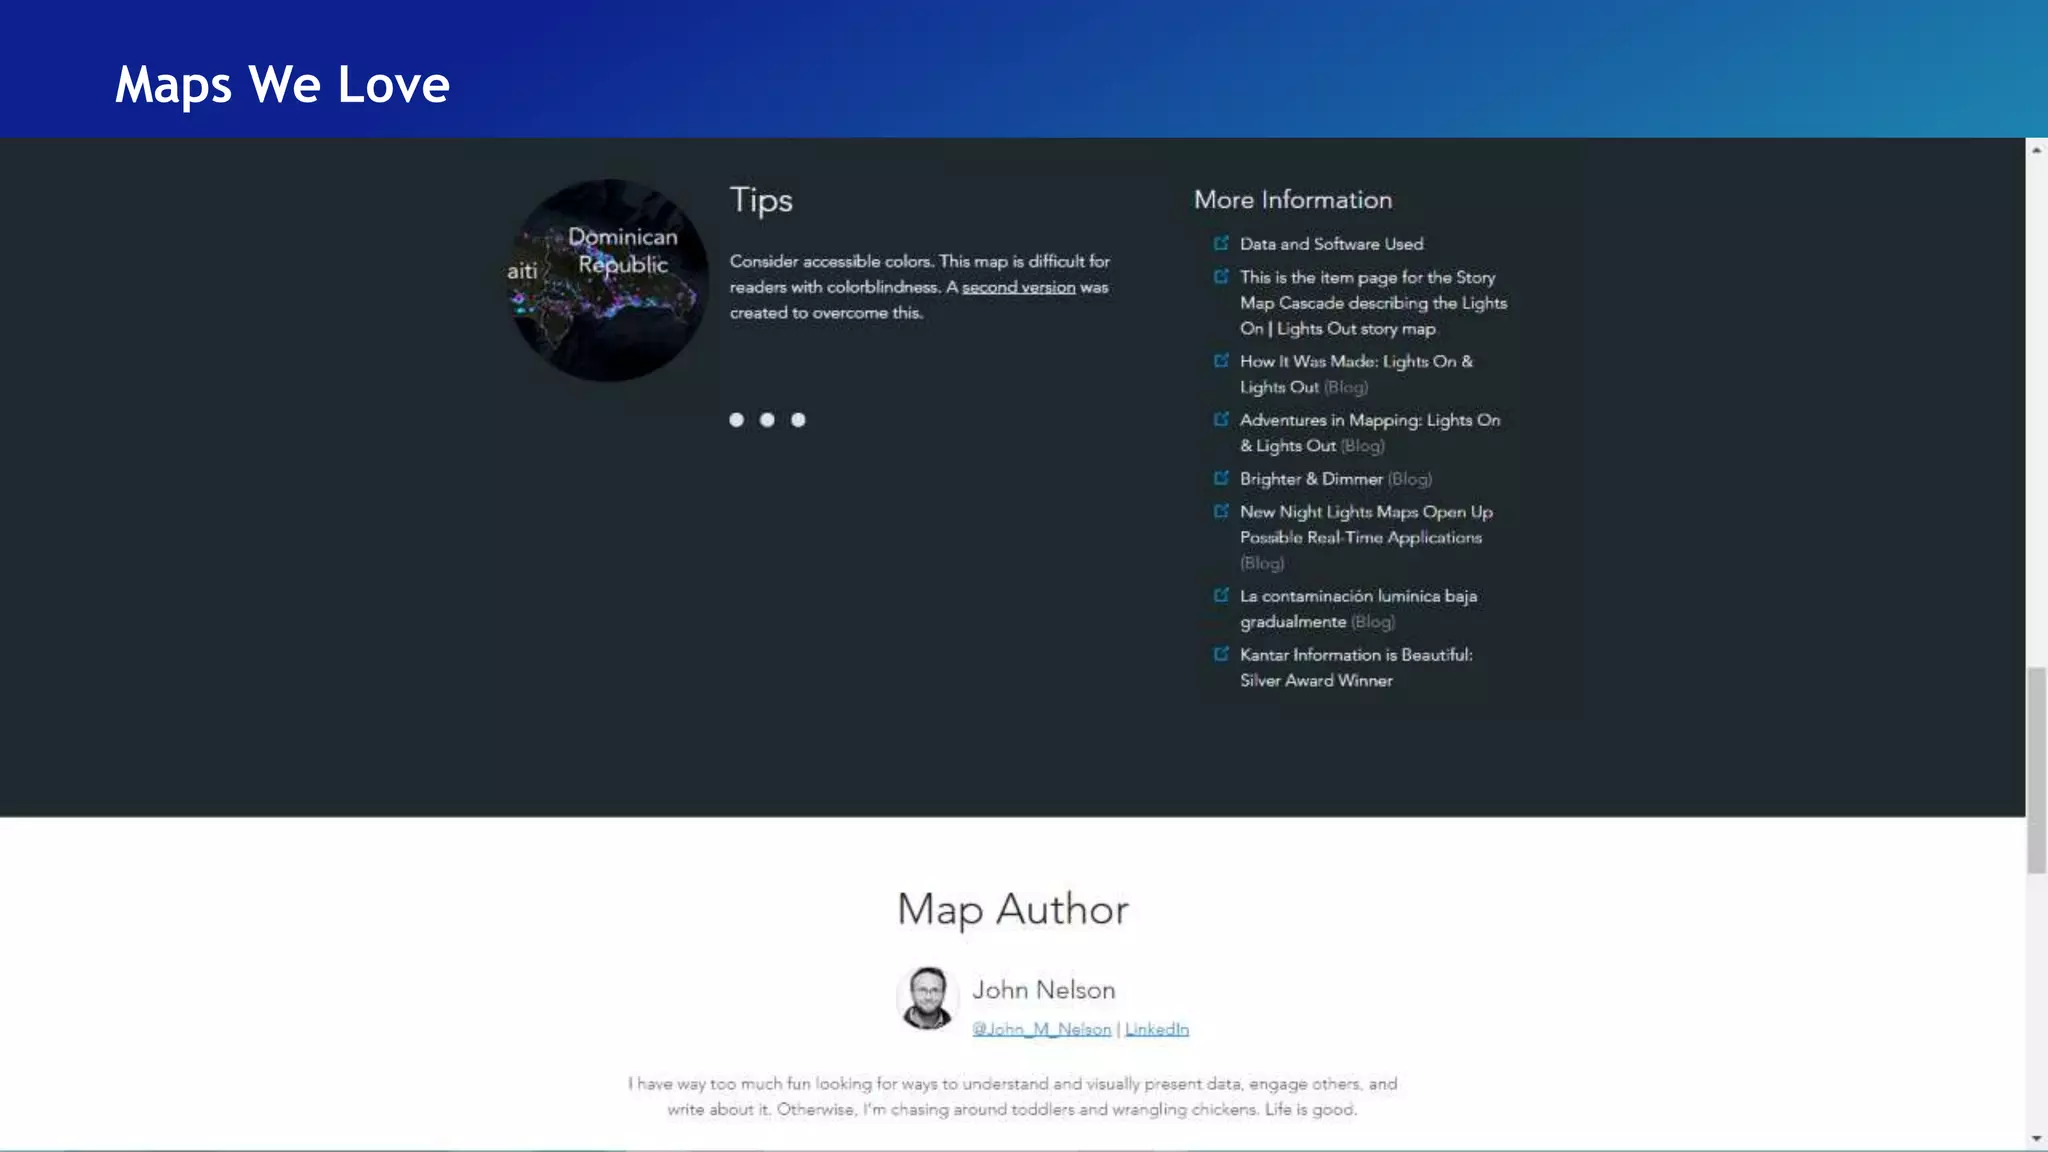
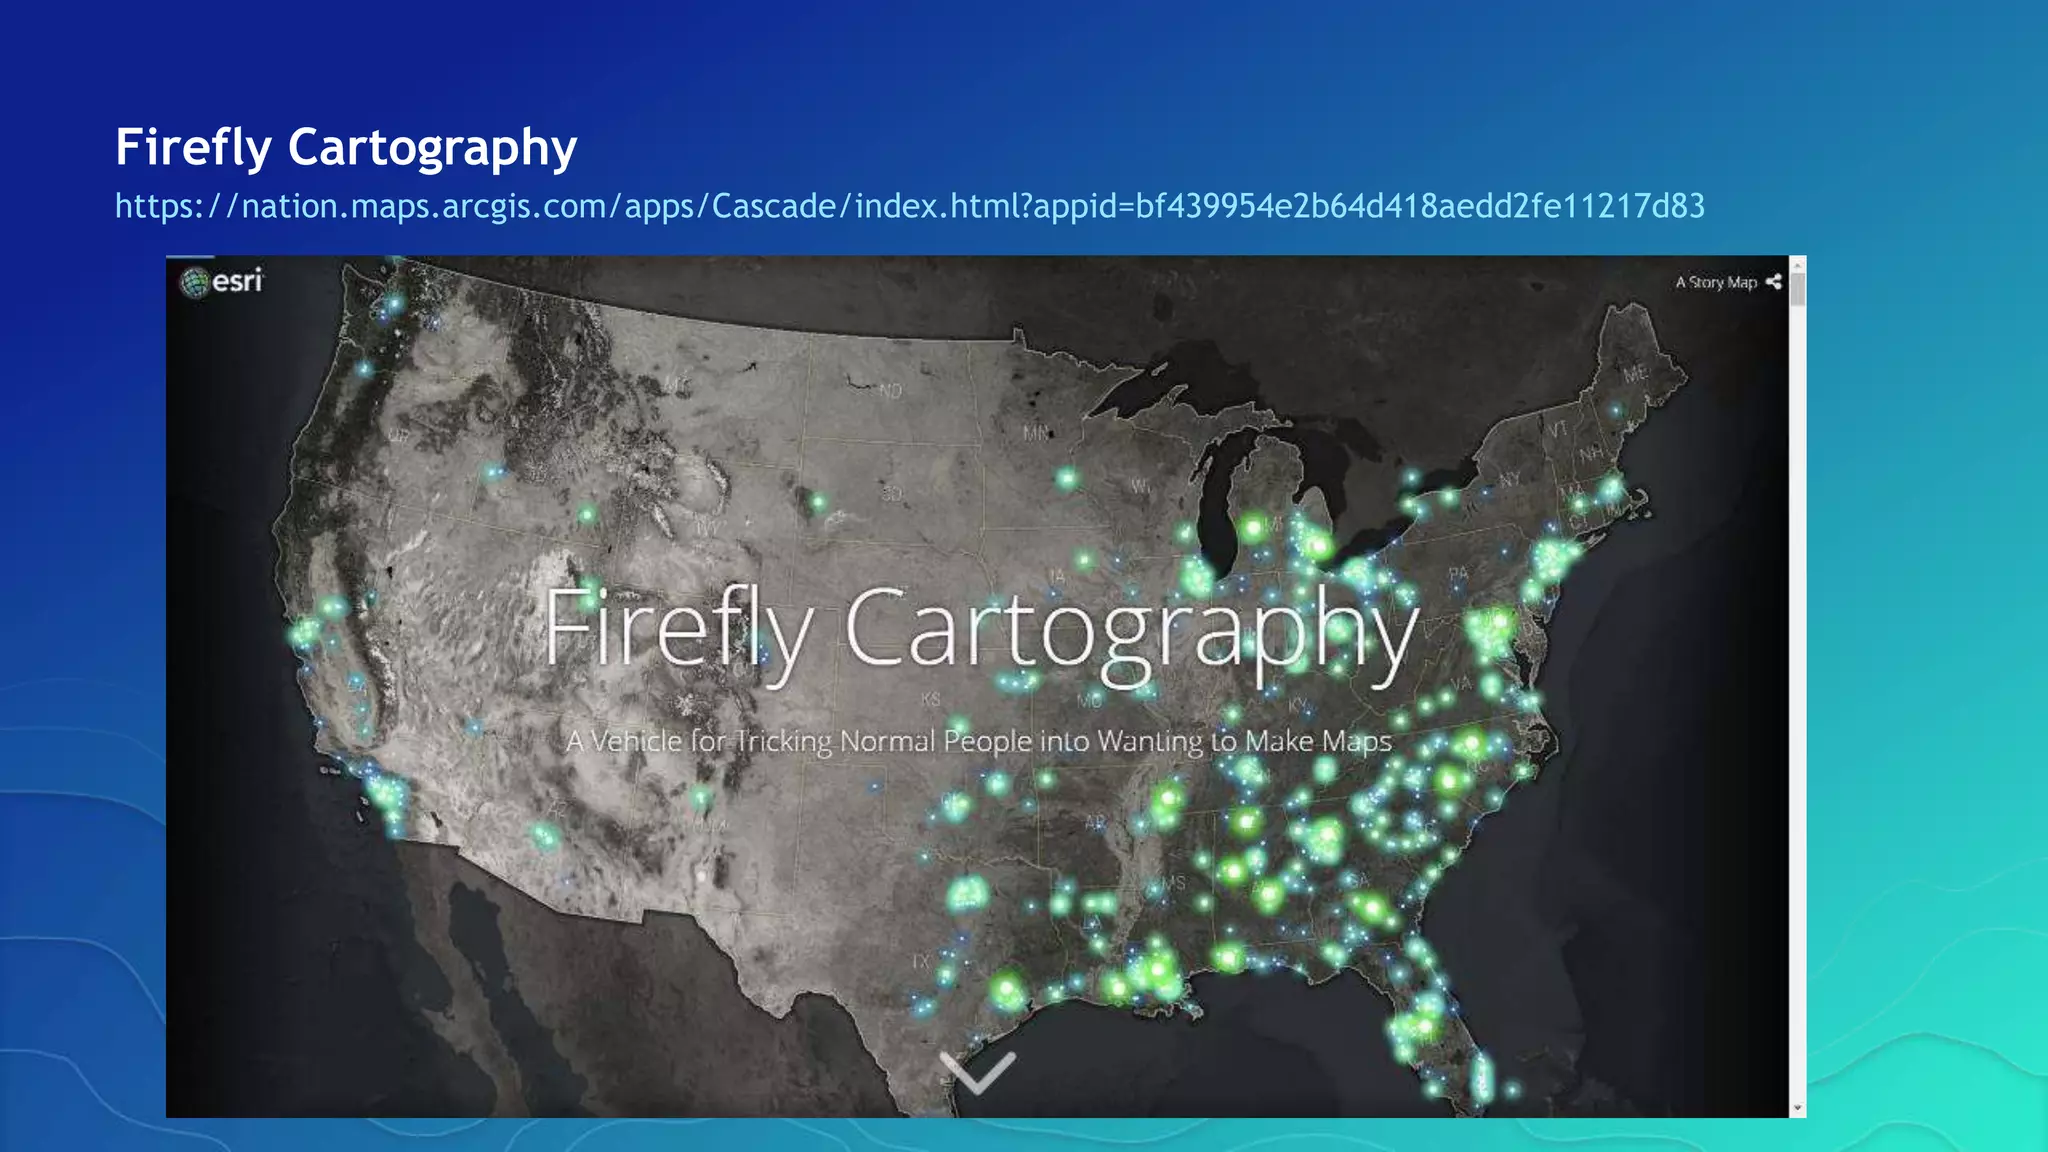
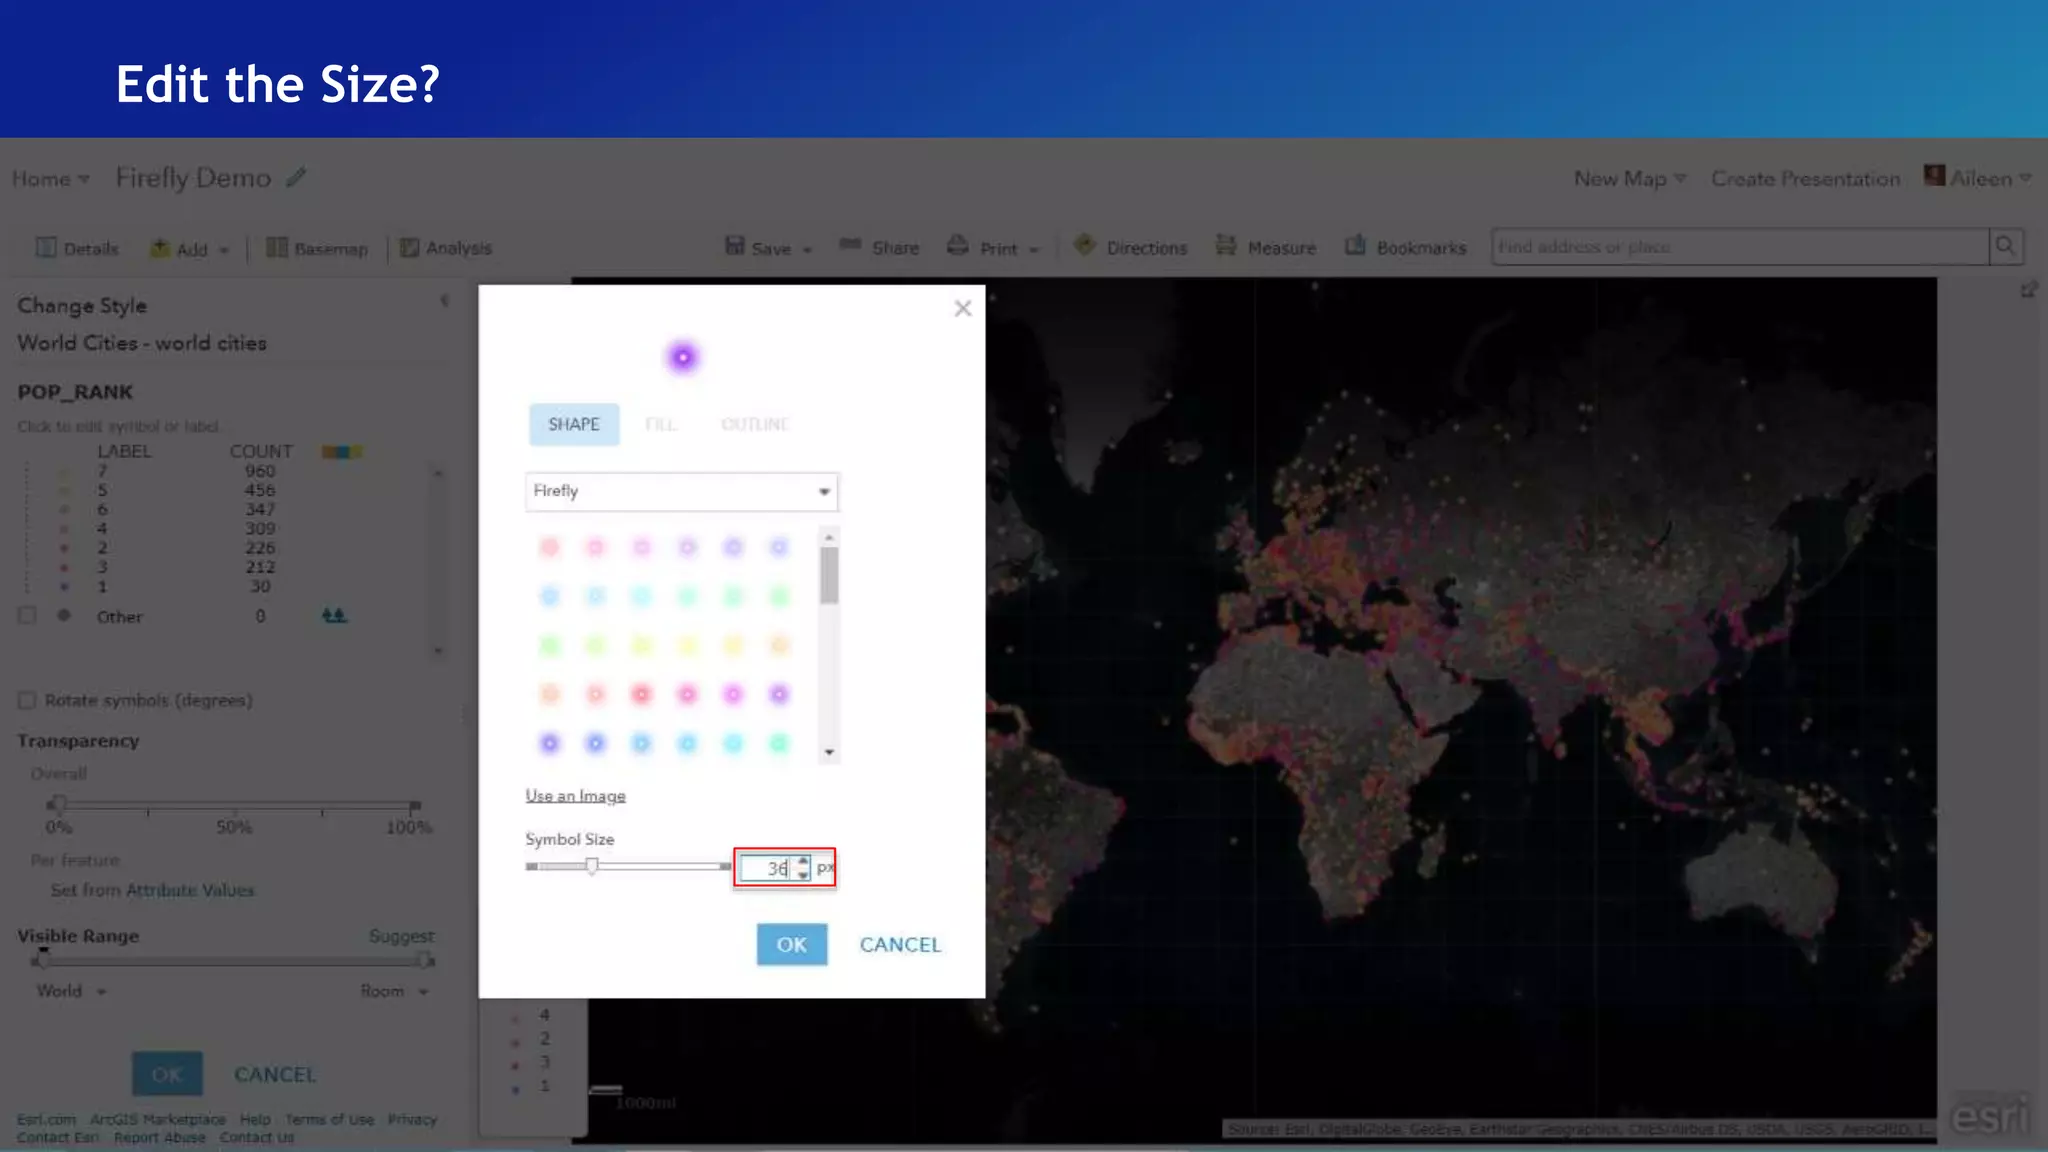
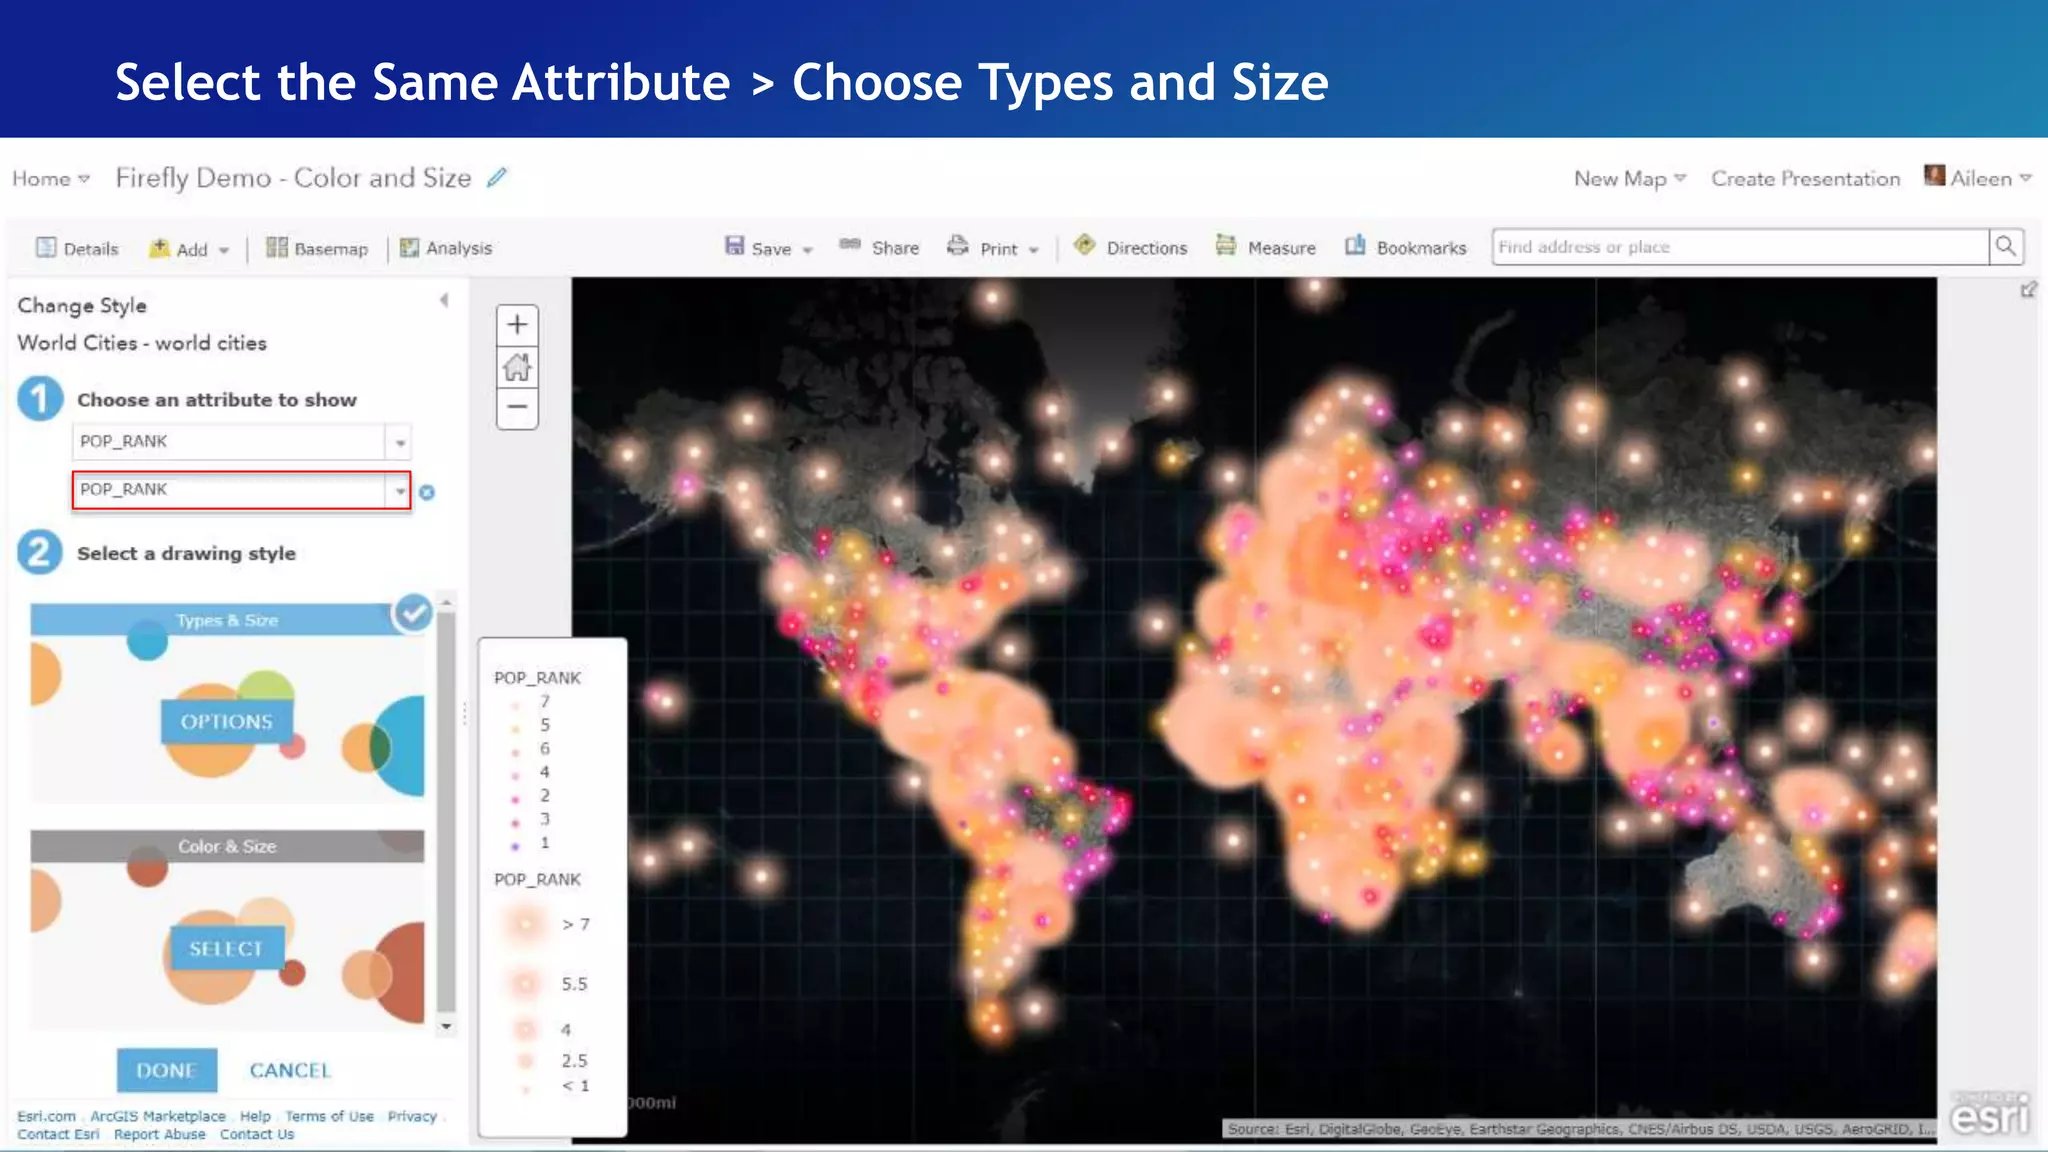
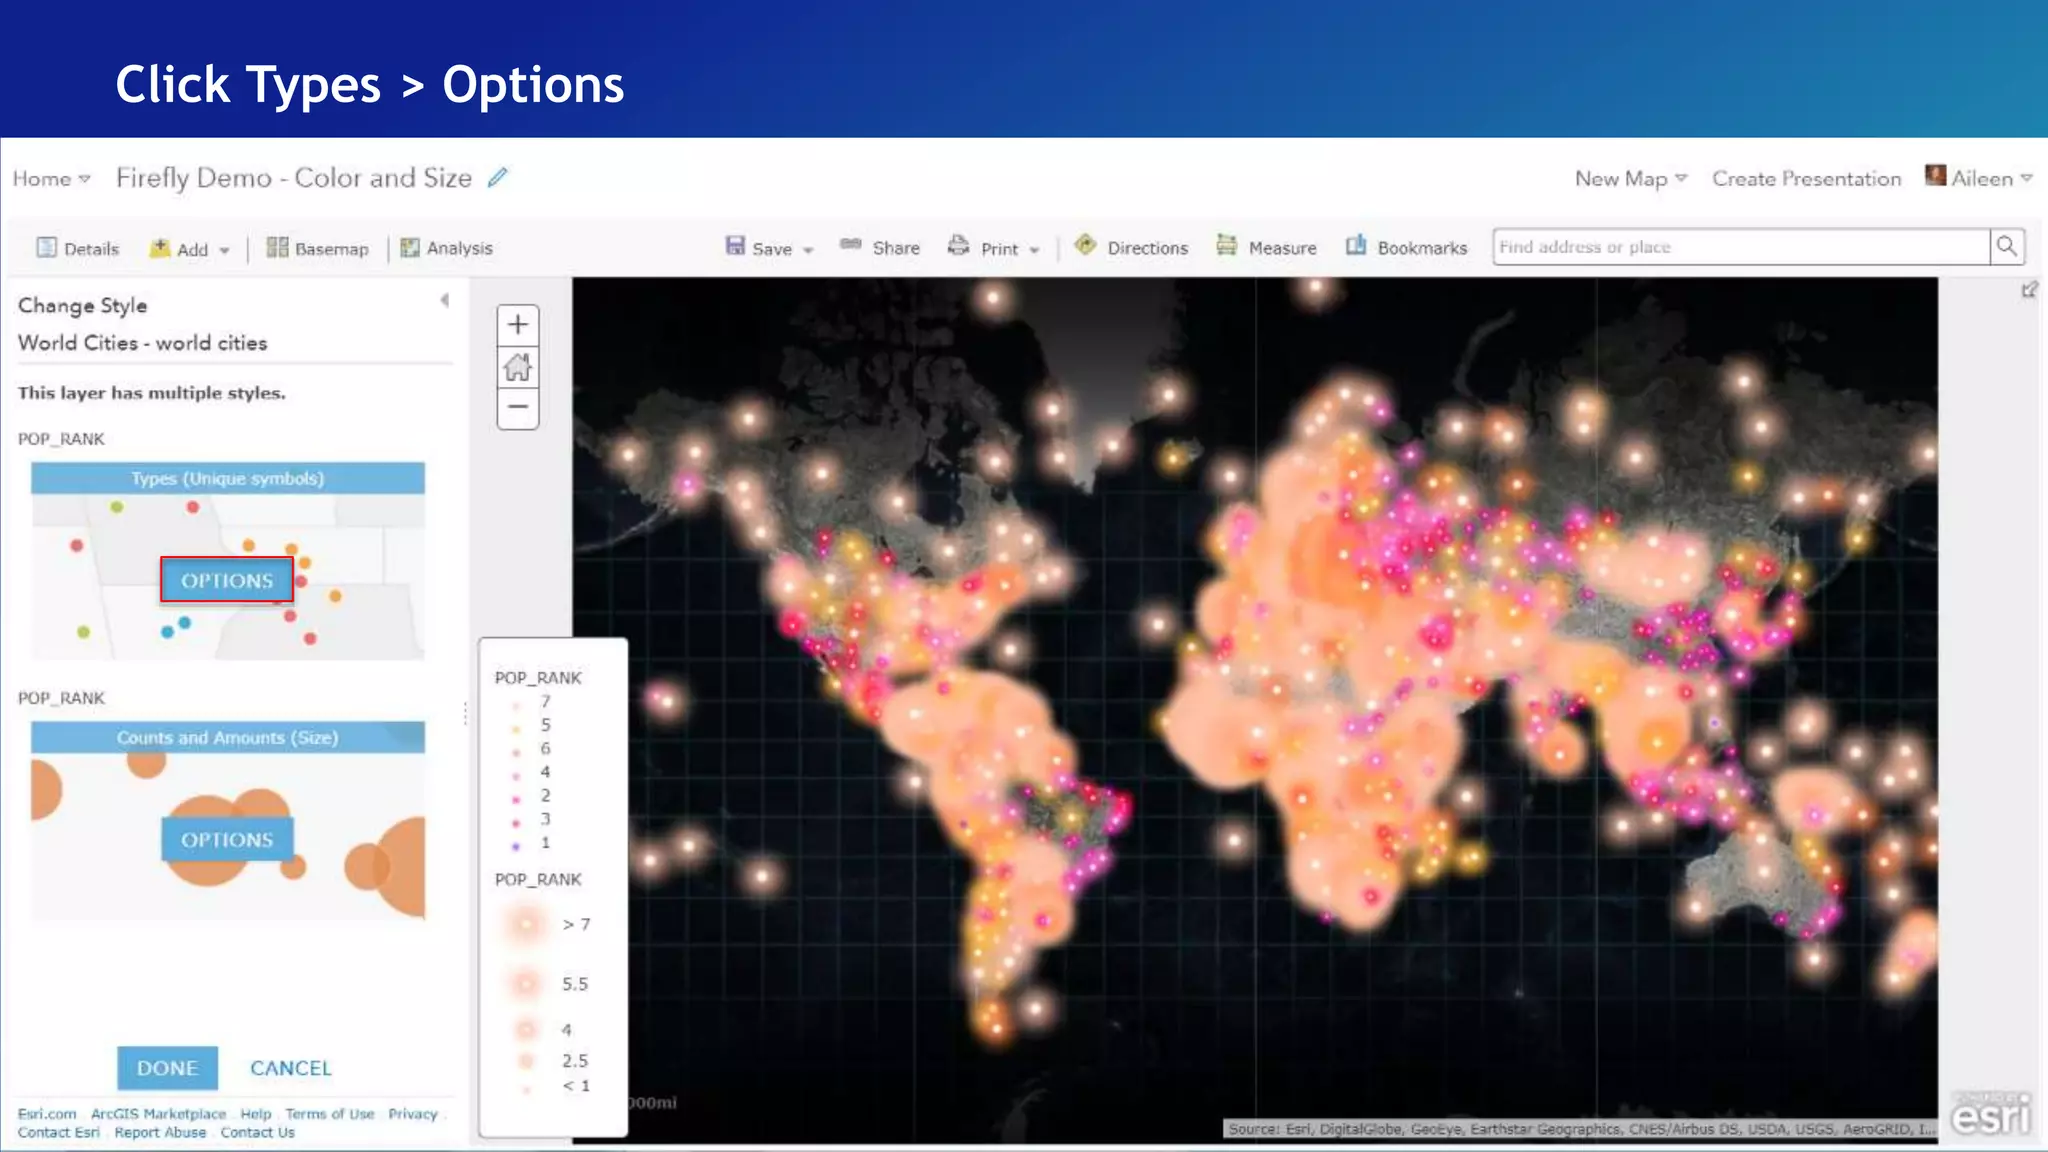
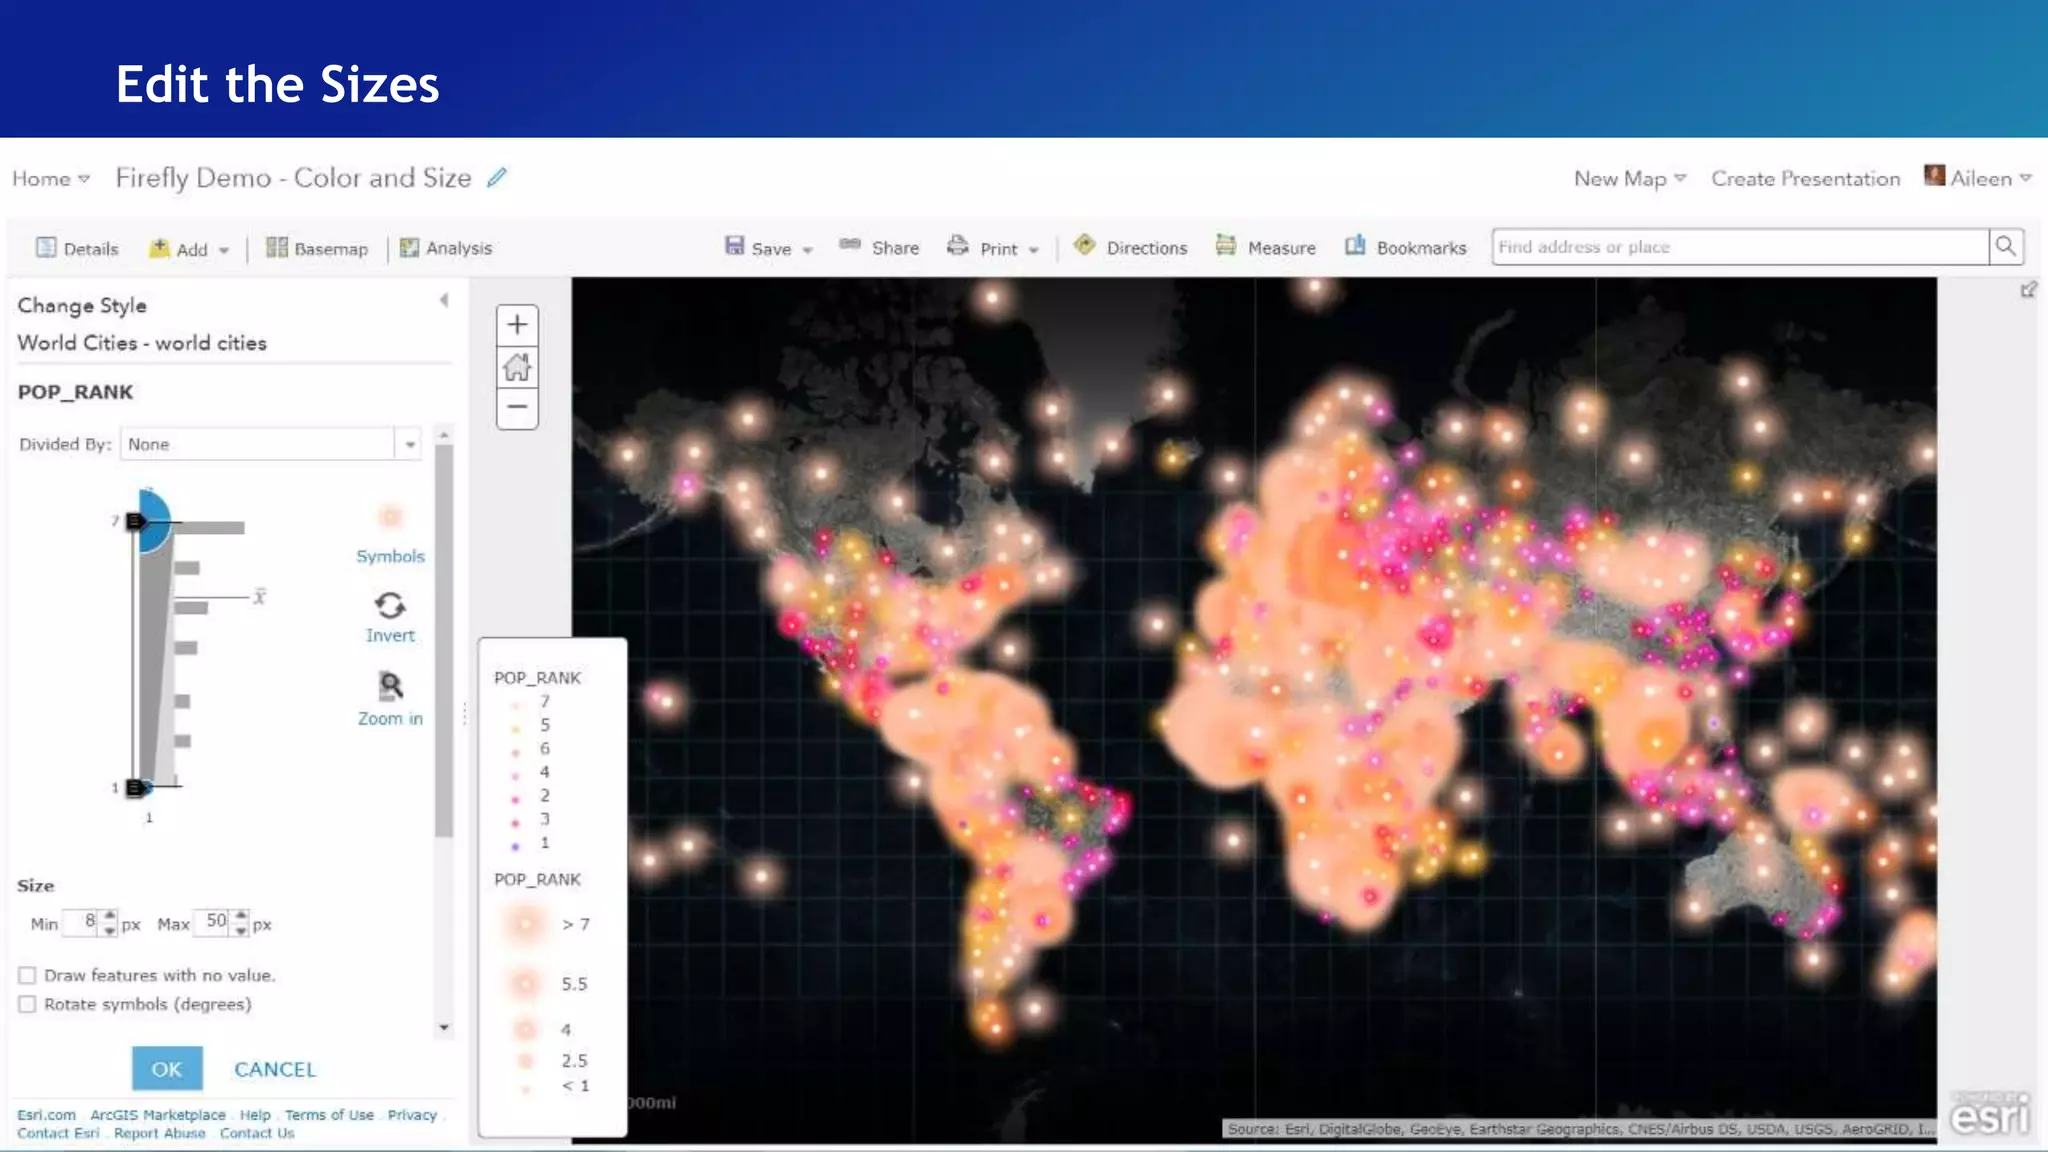
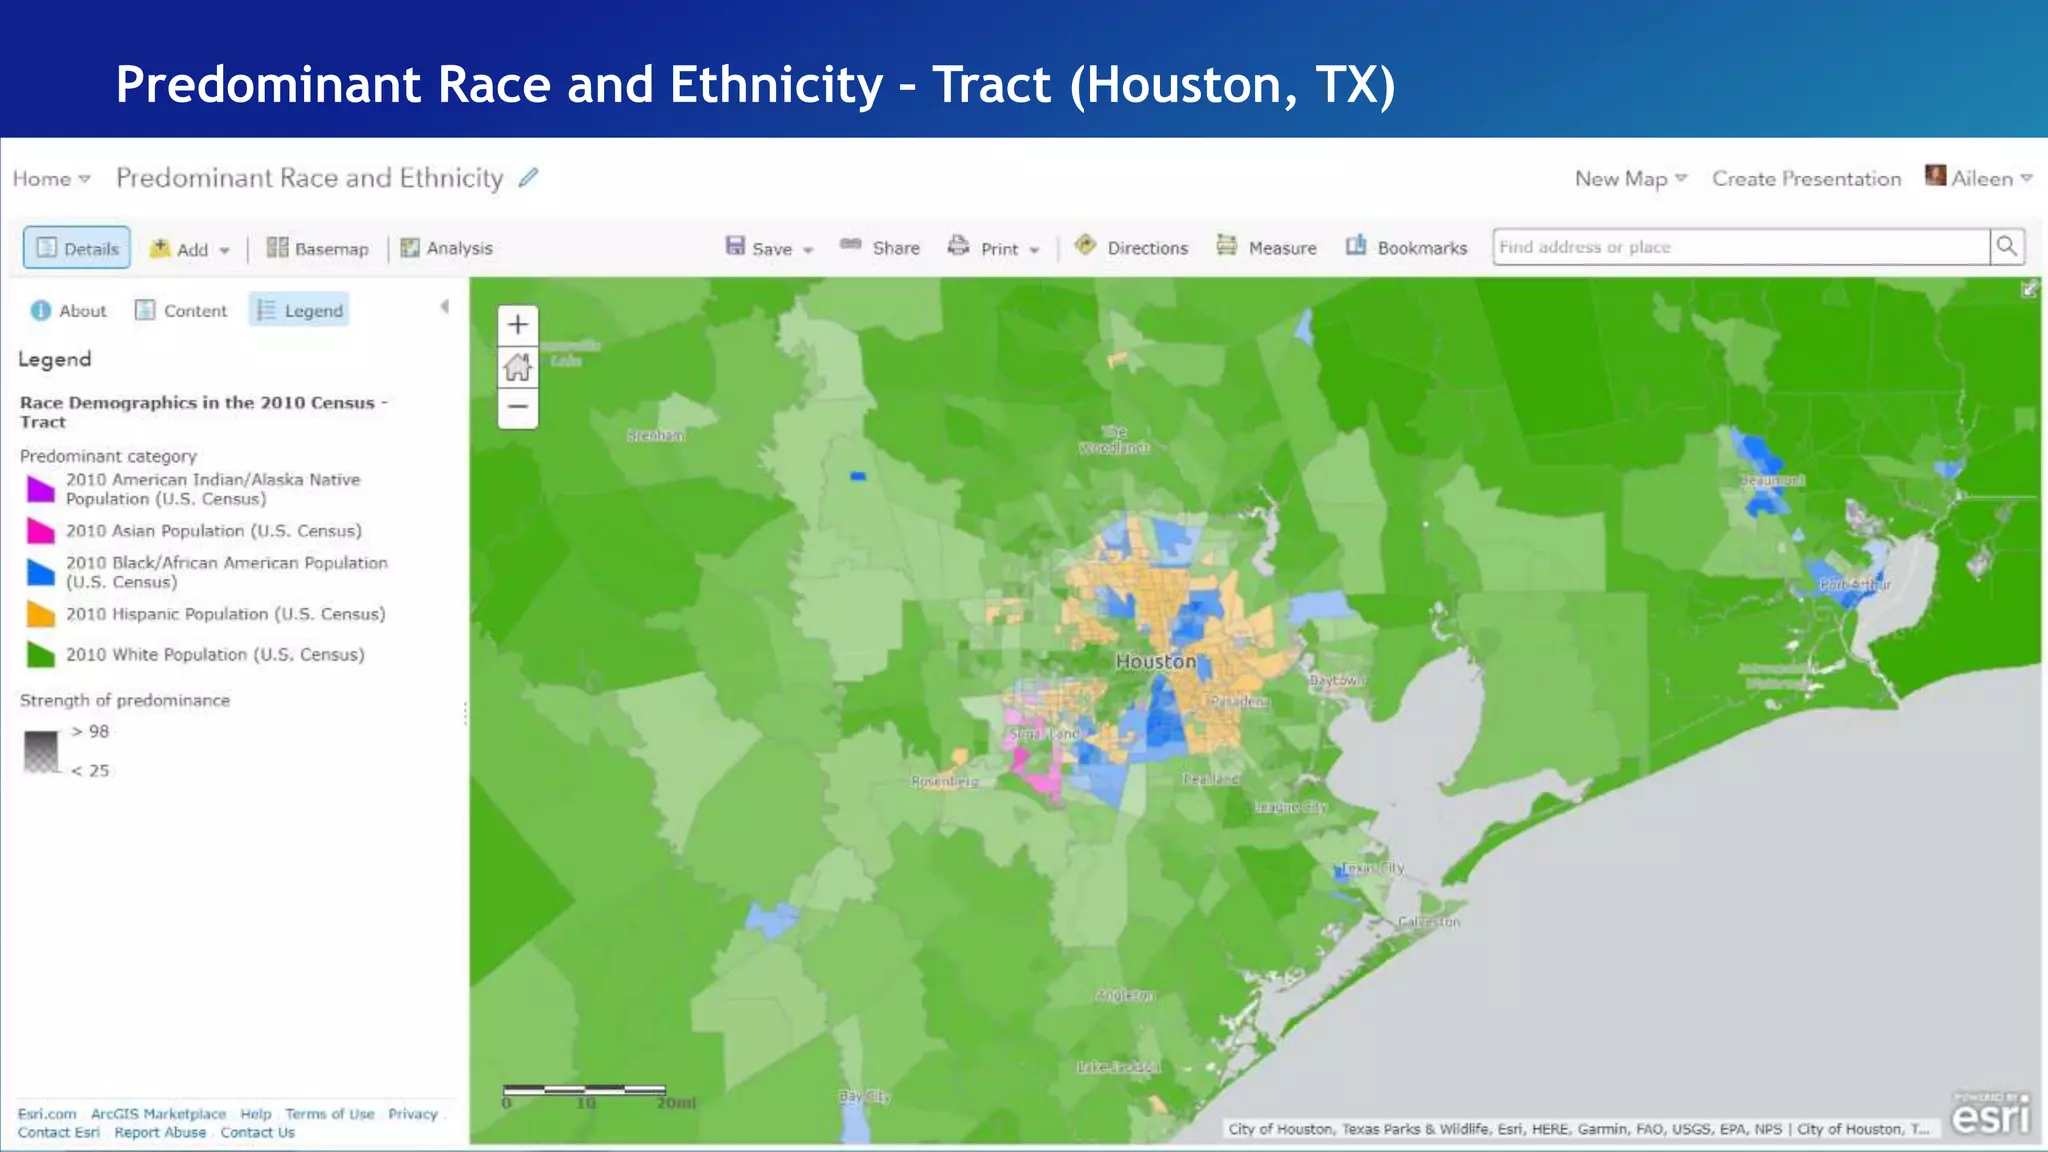
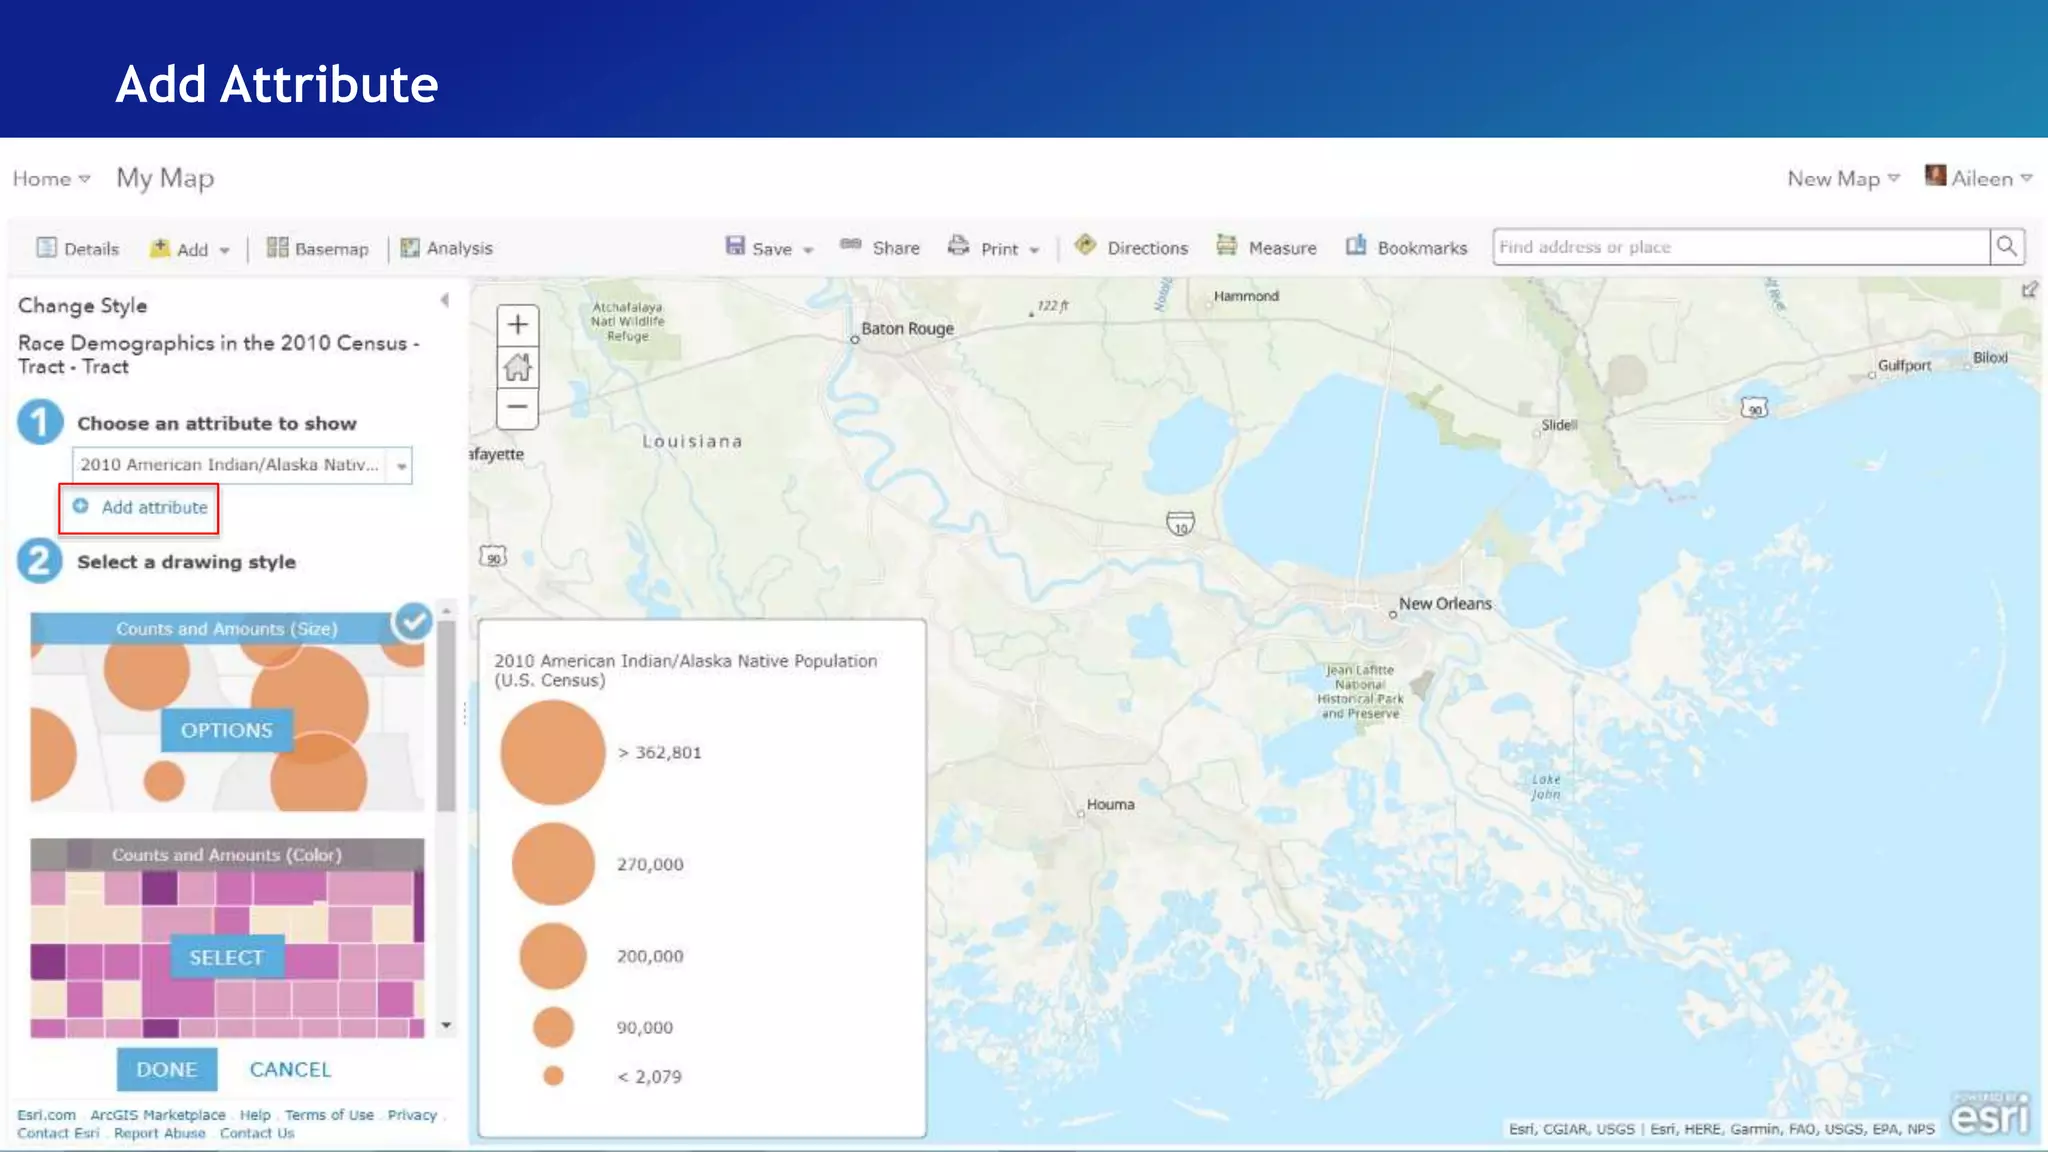
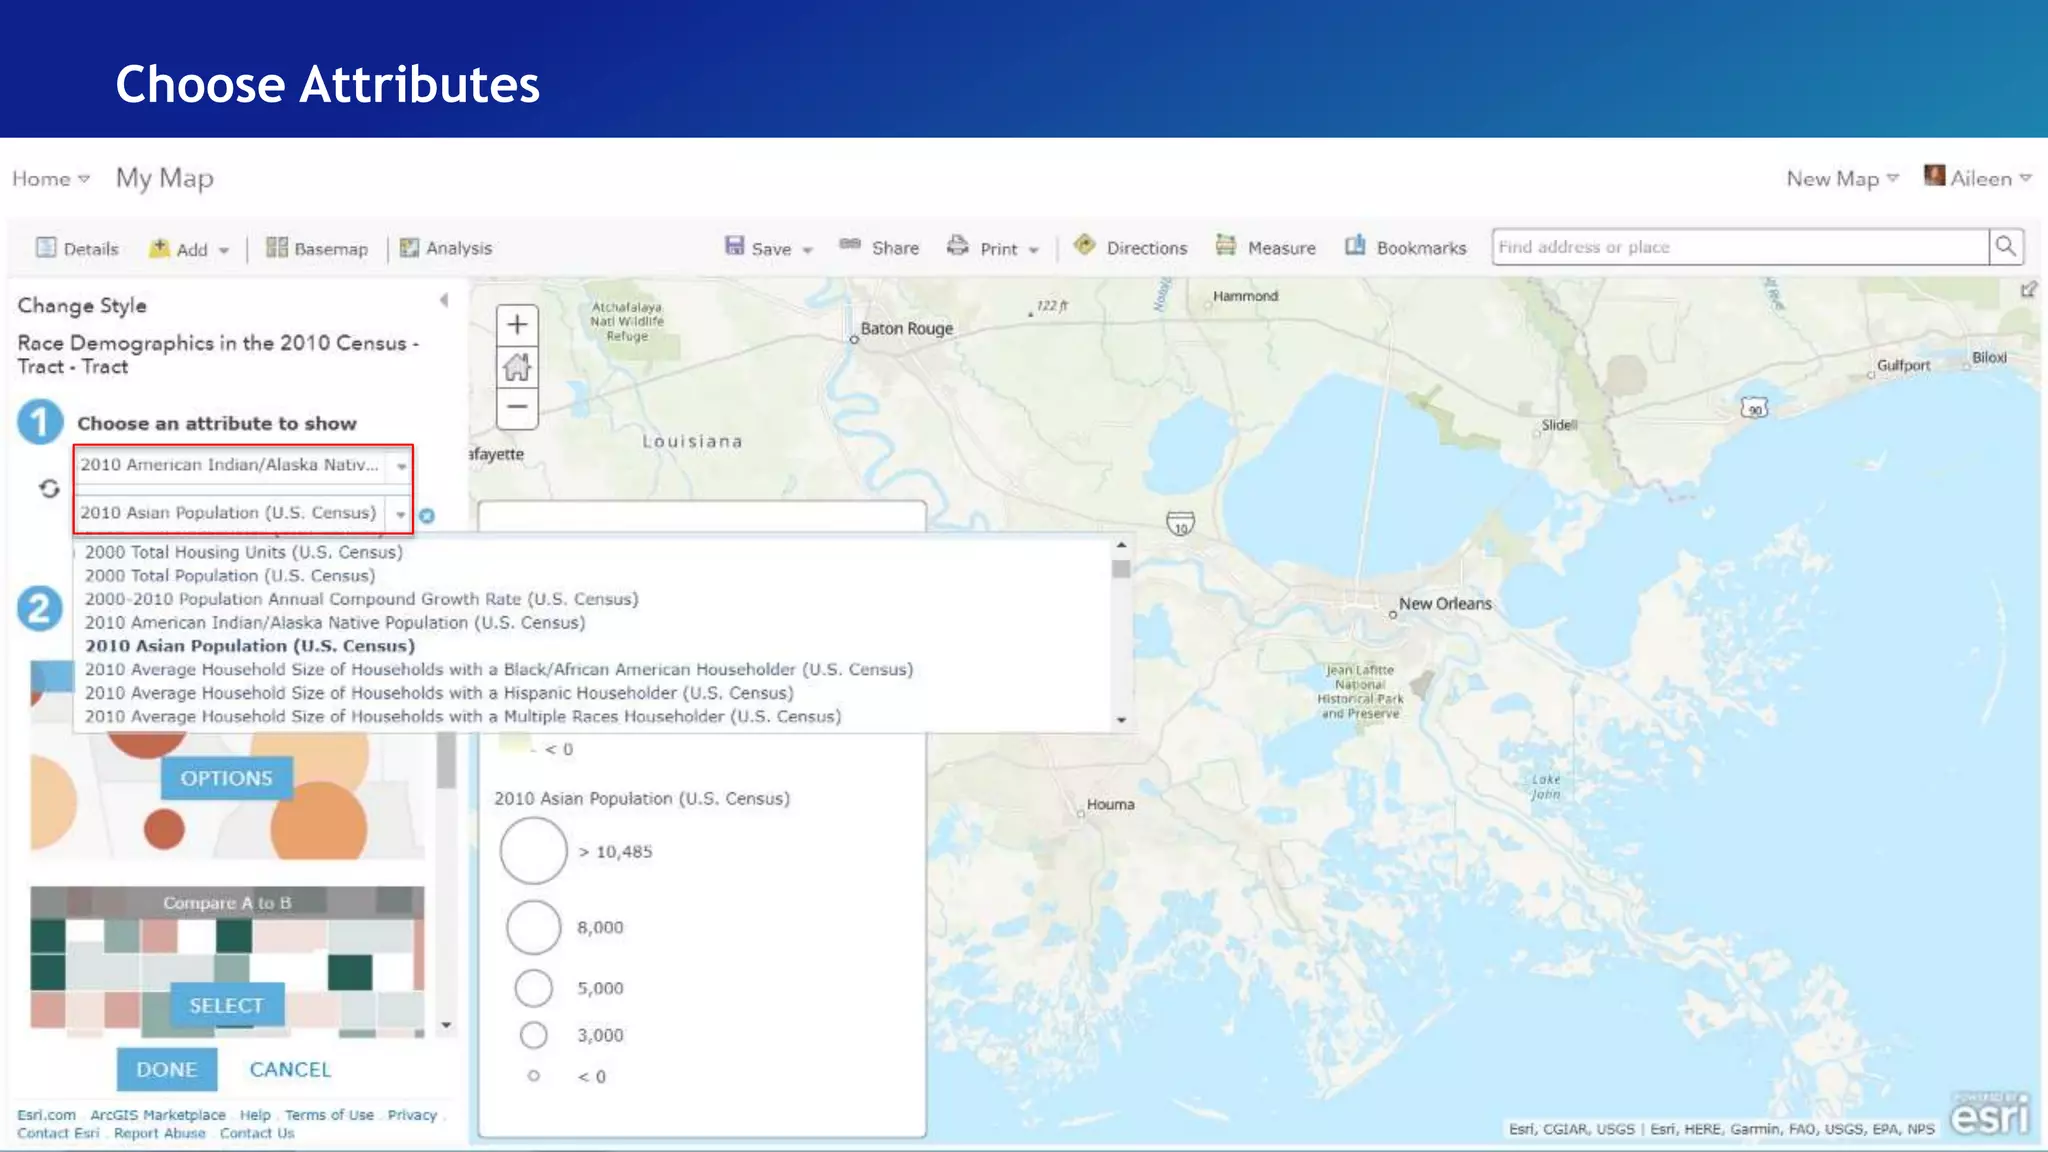
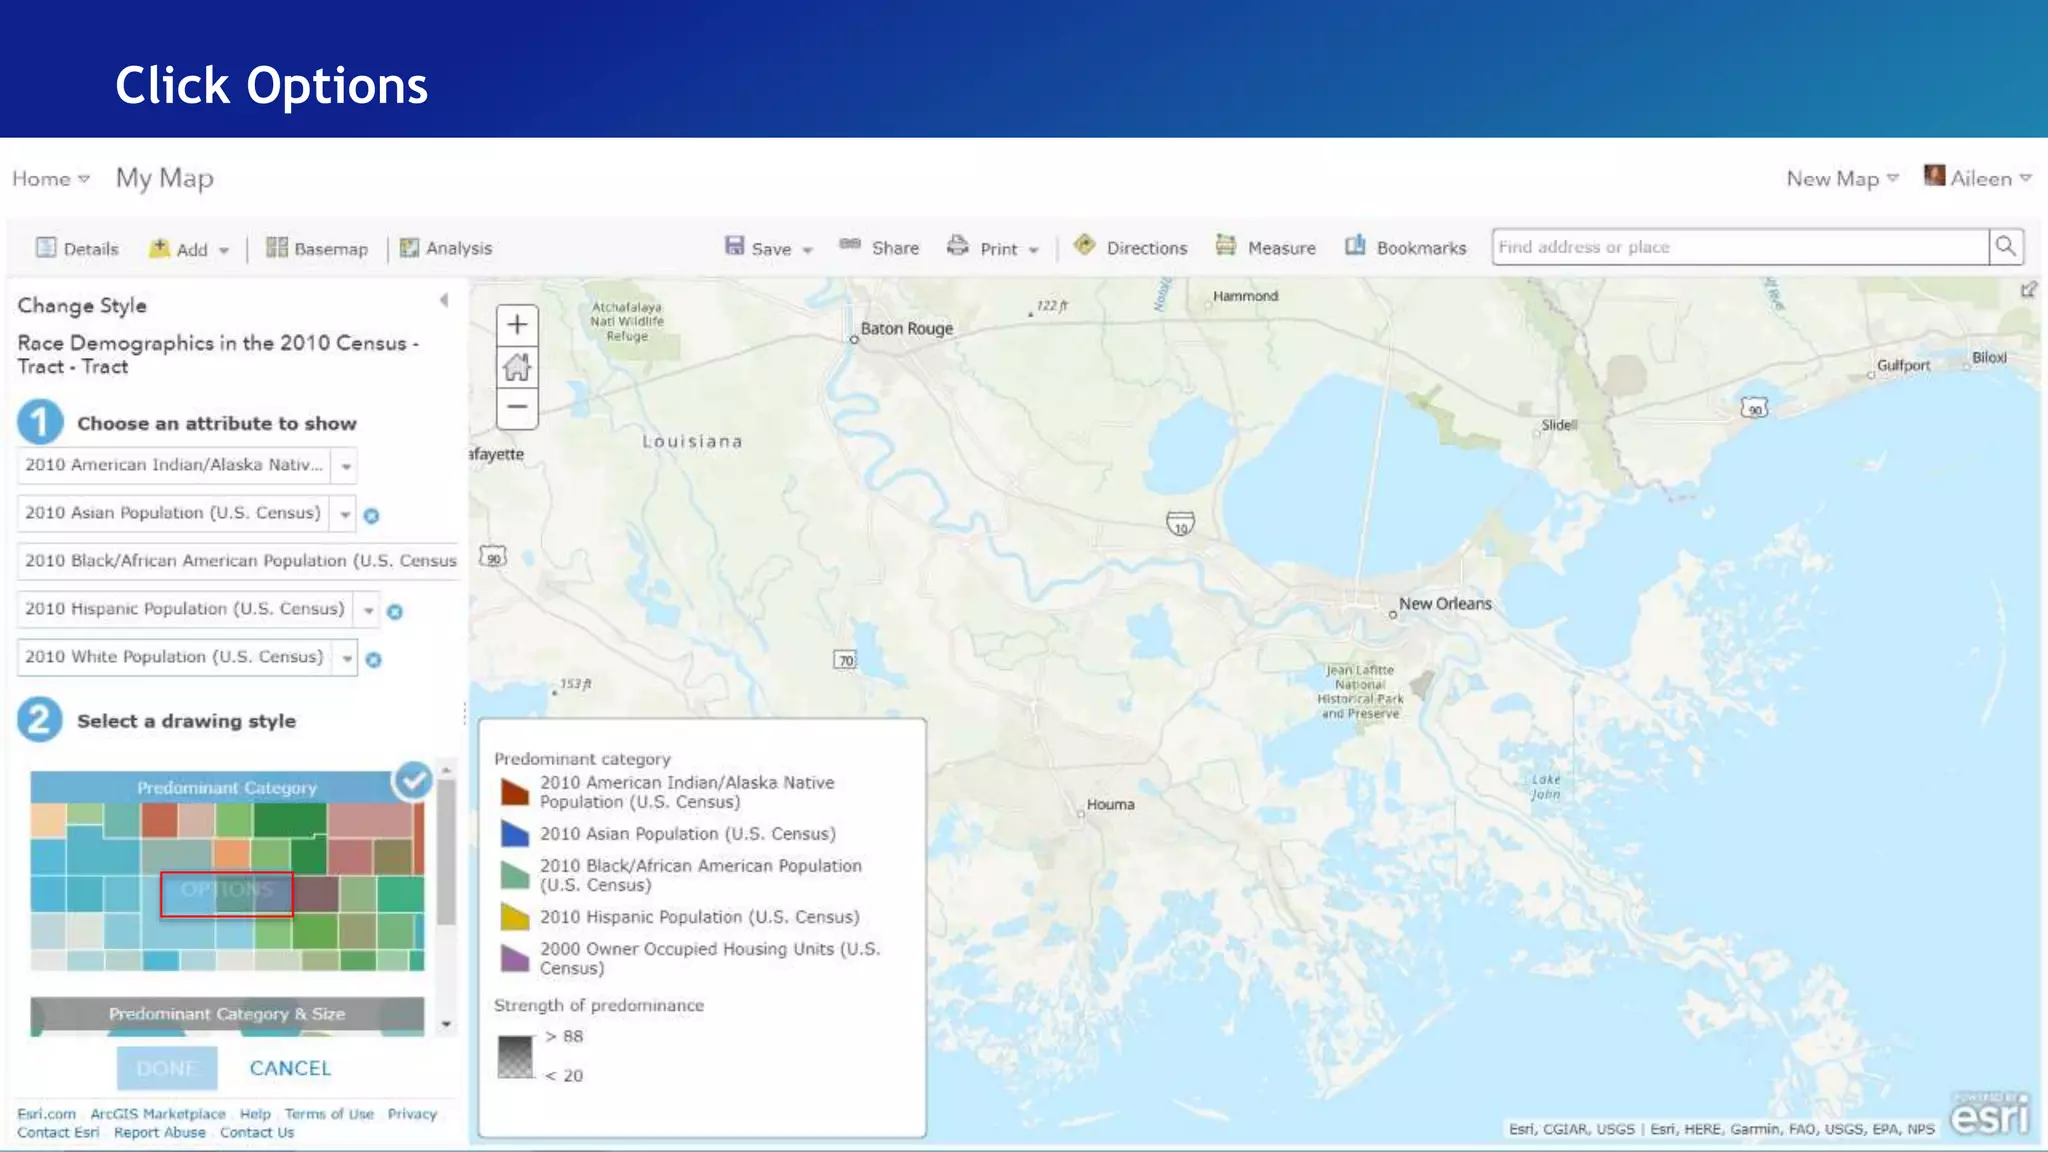
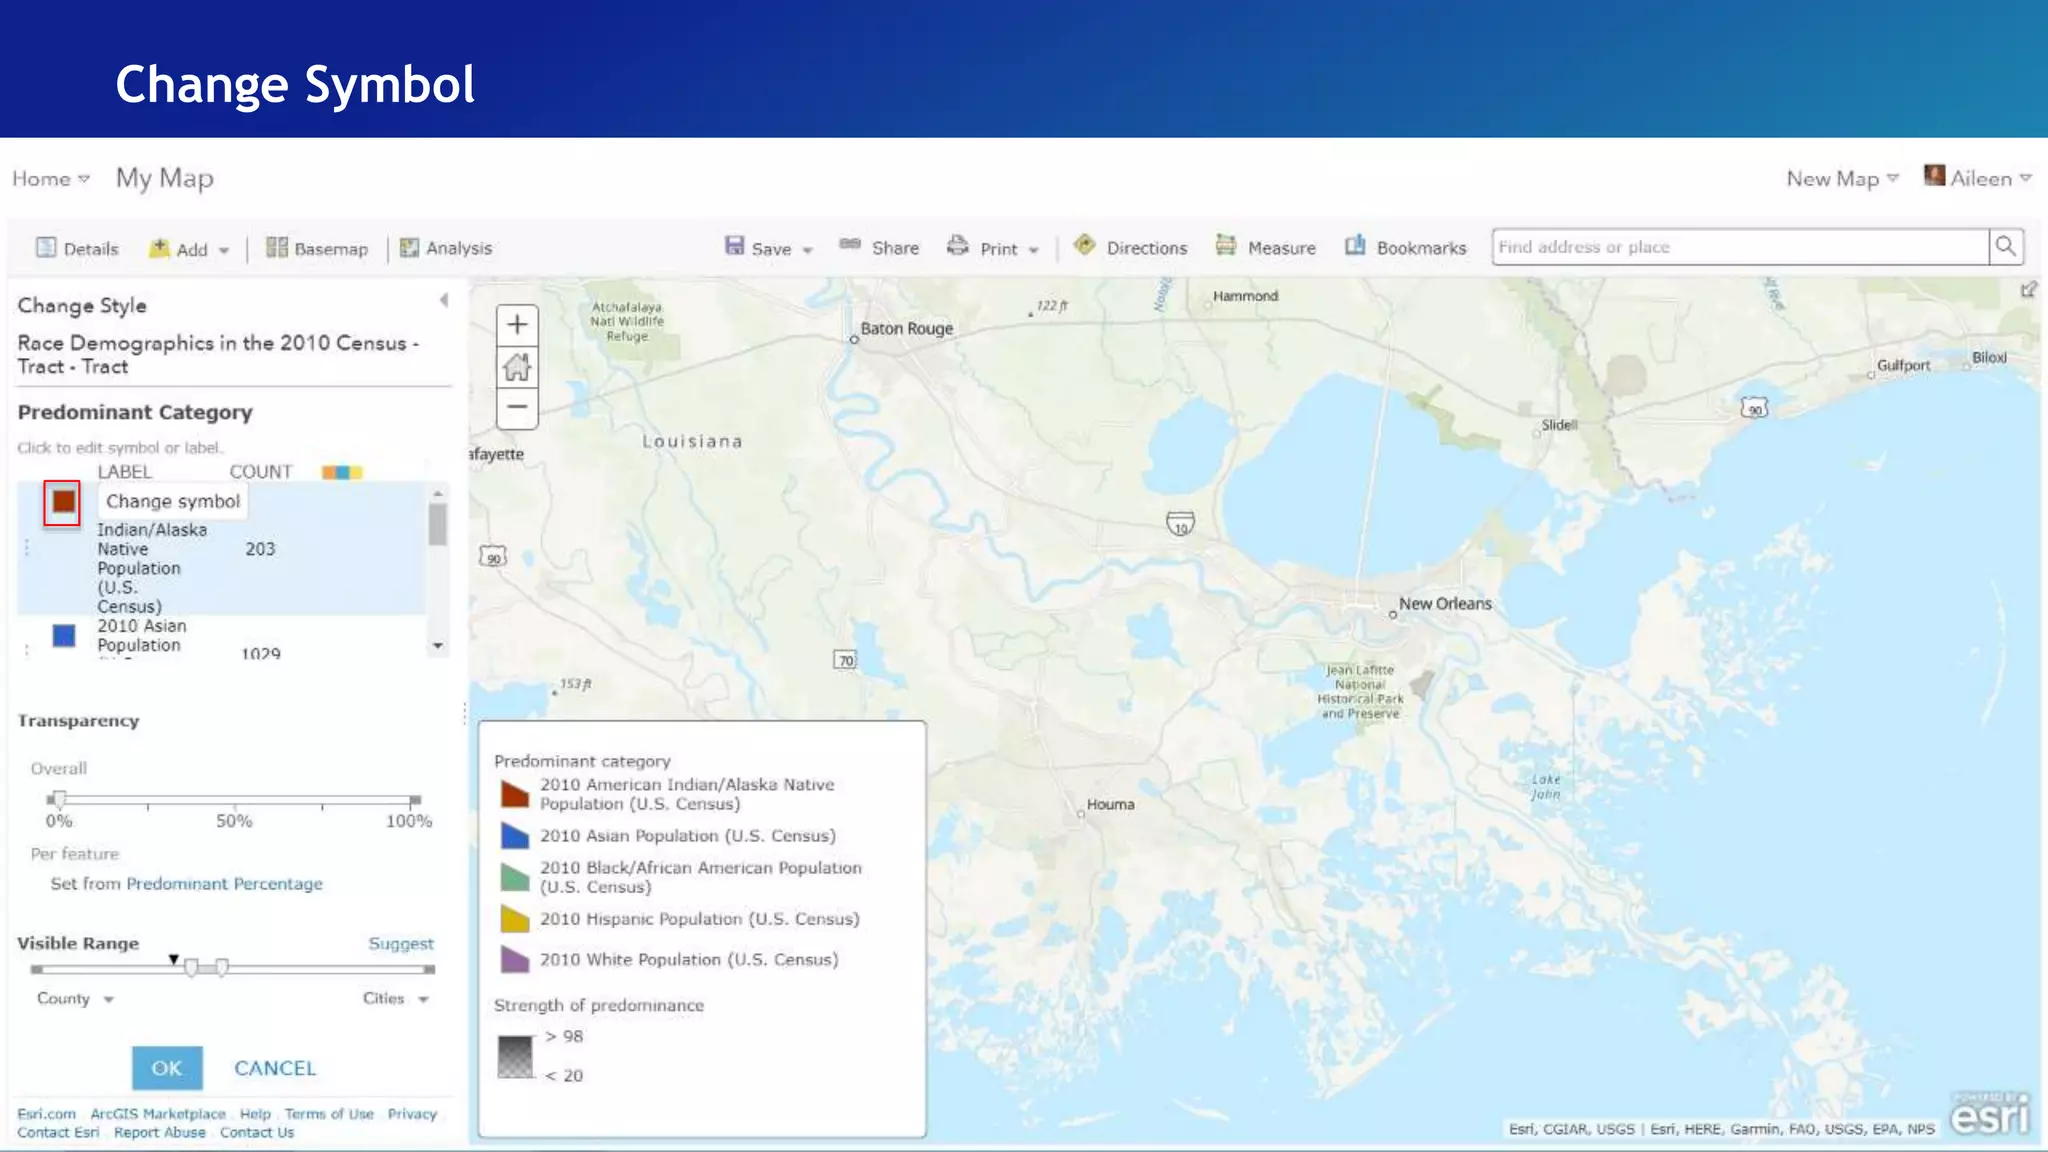
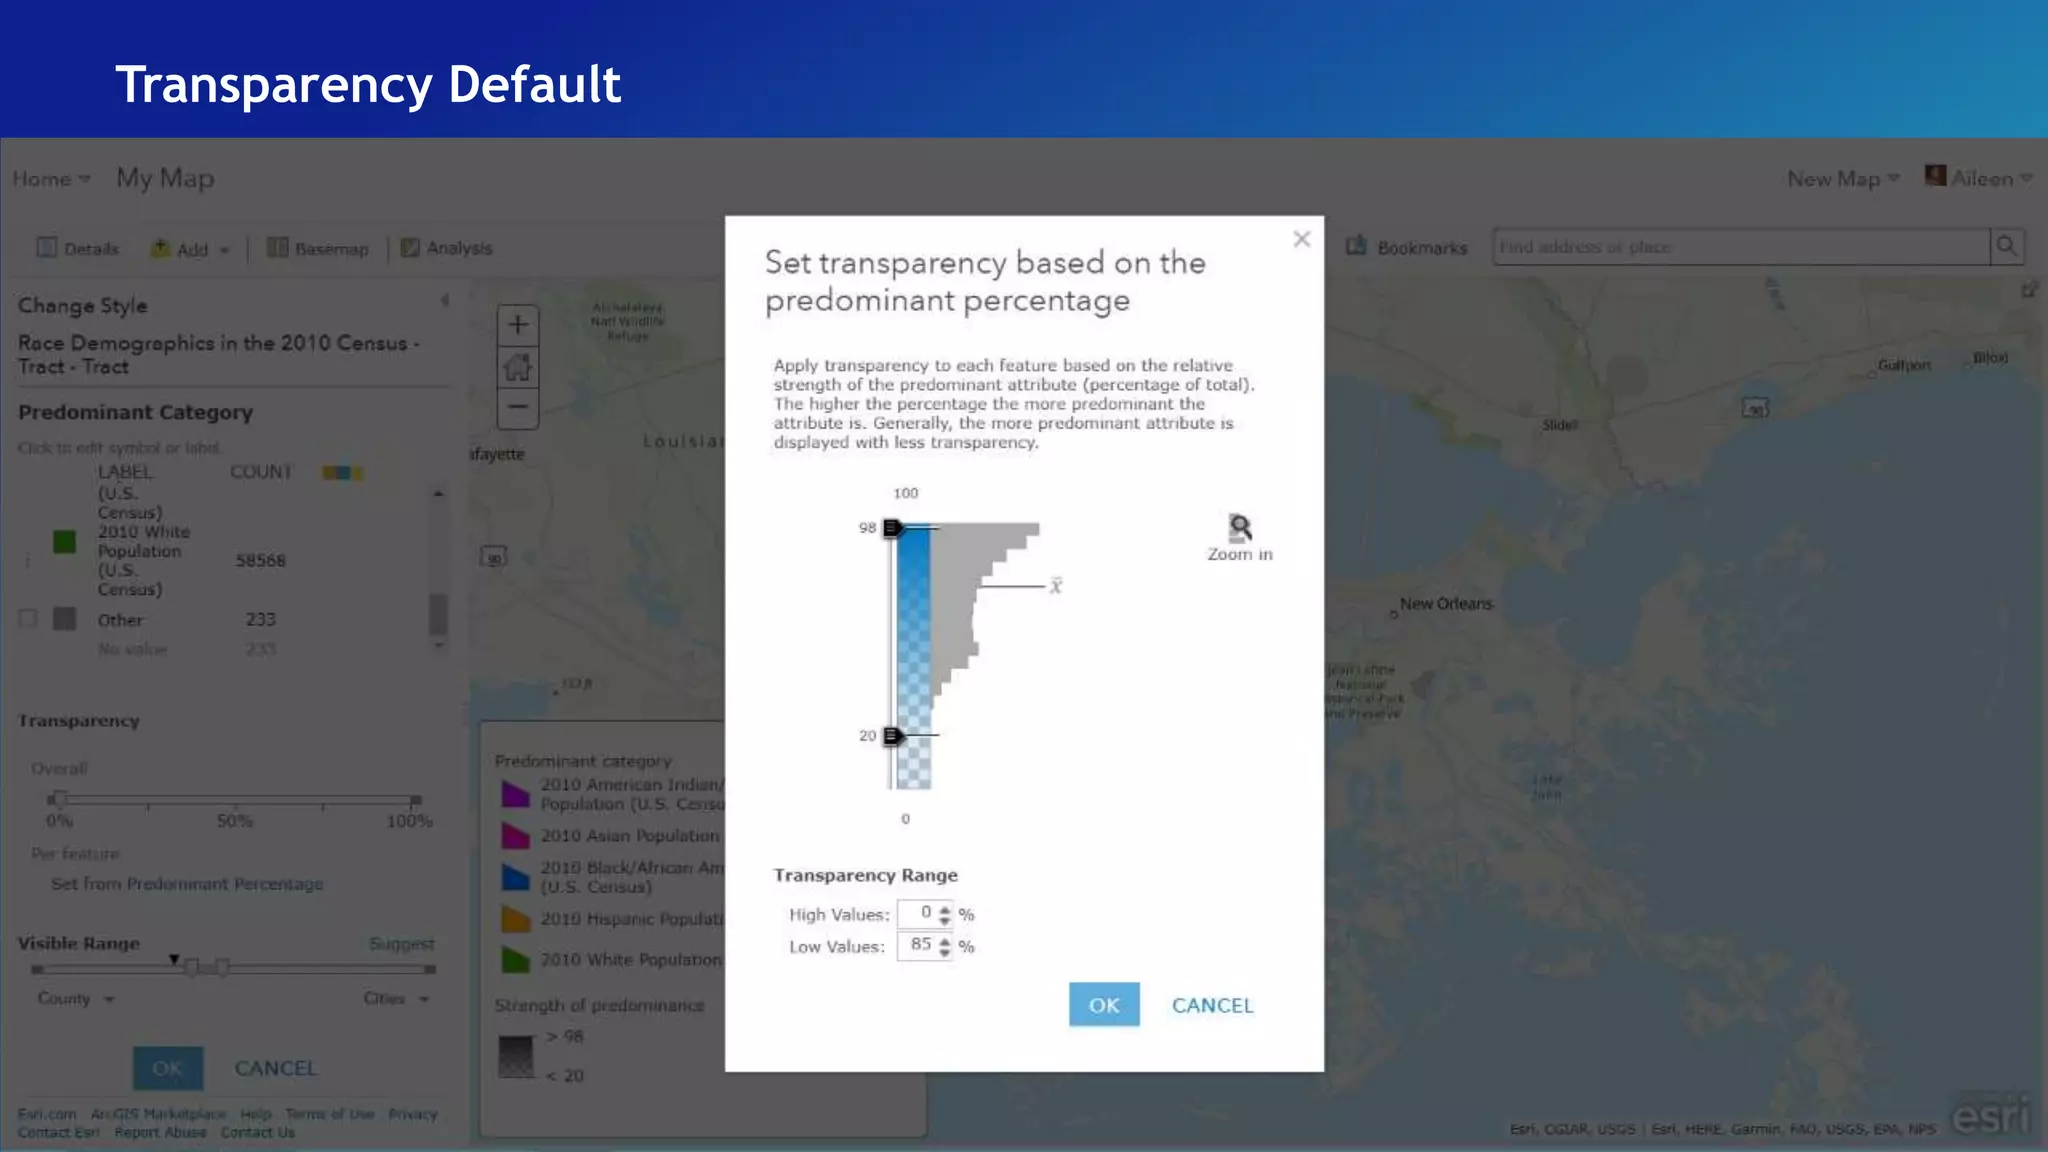
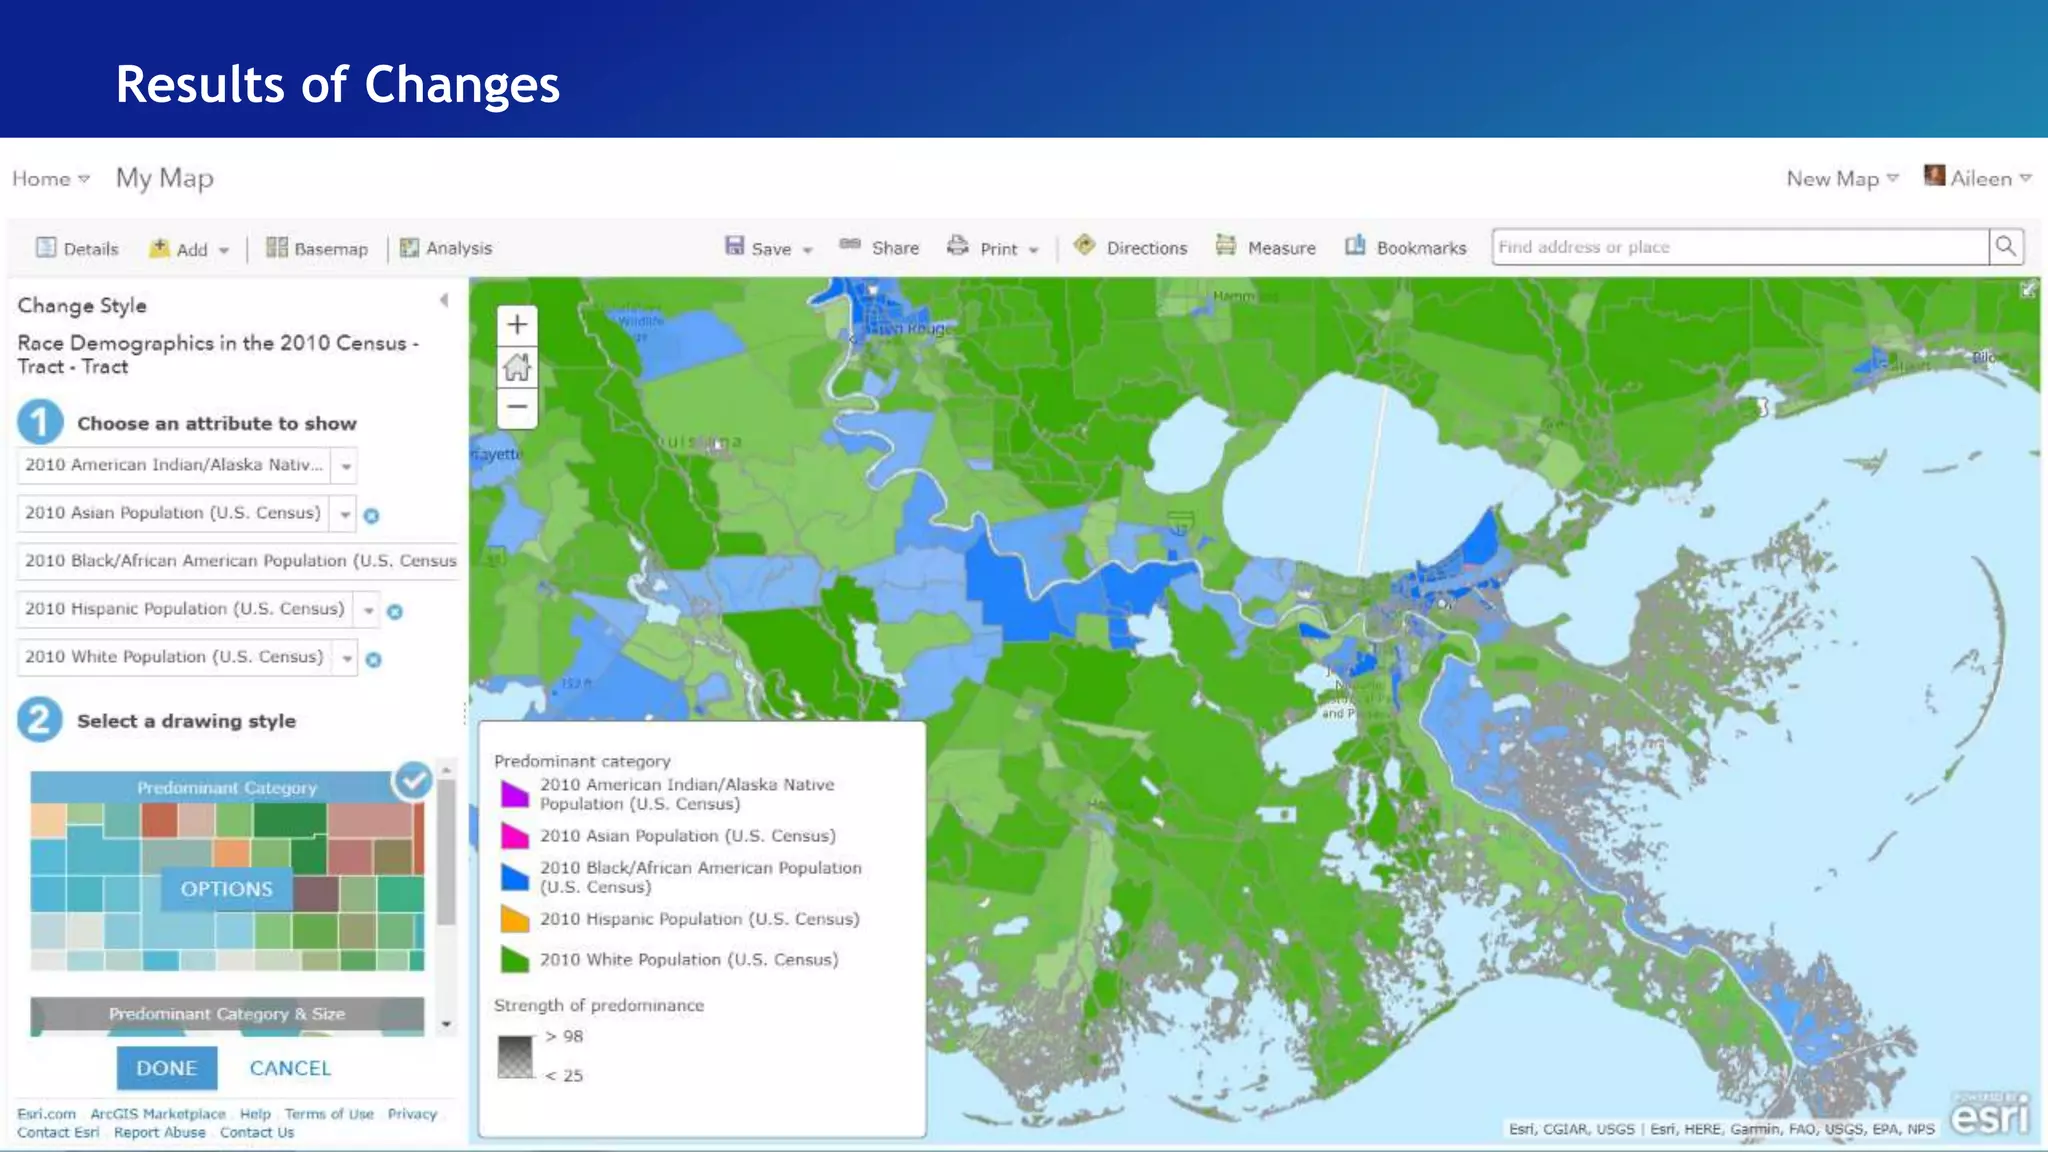
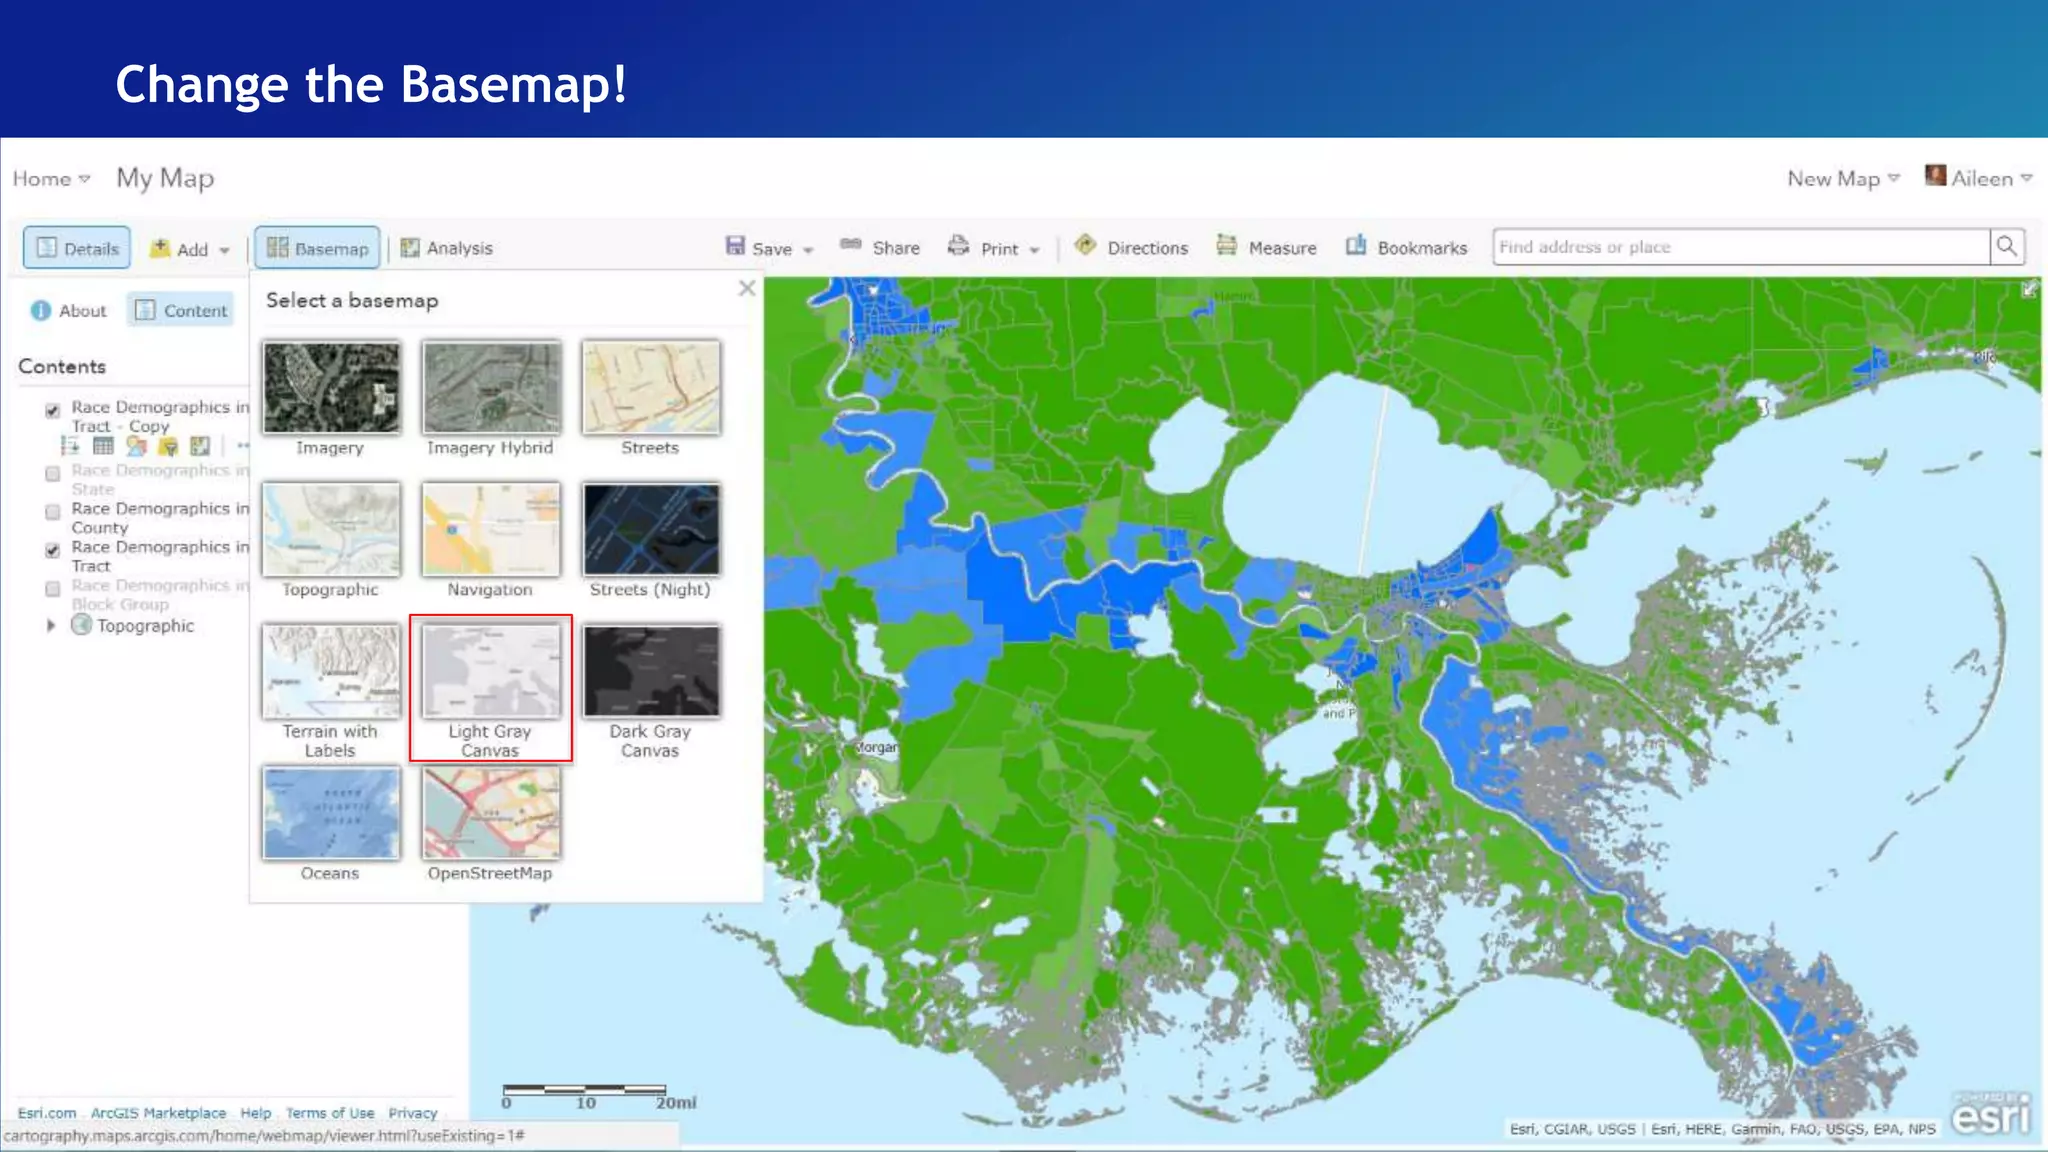
Compelling Cartography with
ArcGIS
Aileen Buckley, PhD
Research Cartographer
Esri – Redlands
@mappingcenter, @cartatesri
Topics covered
• Where to Look for Resources
• Firefly Cartography
• Smart Mapping
- Predominance
- Color and Size or Type and Size
• Terrain Representation
• Vector Basemaps
Where to Look for Resources
• Blog articles
- ArcGIS blog (www.esri.com/arcgis-blog)
- John Nelson’s blog (Adventures in Mapping - https://adventuresinmapping.com/)
- Jim Herries’ blog (https://jimherries.tumblr.com/)
- Ken Field’s blog (http://cartonerd.blogspot.com/)
• Learn lesson (http://learn.arcgis.com/en/)
• Story Maps (https://storymaps.arcgis.com/en/)
• Esri Training (https://www.esri.com/training/catalog/)
- Videos
- Webinars
• Maps We Love
Maps We Love
Maps We Love
Maps We Love
Maps We Love
Maps We Love
Firefly Cartography
https://nation.maps.arcgis.com/apps/Cascade/index.html?appid=bf439954e2b64d418aedd2fe11217d83
Firefly Cartography
Developed by John Nelson, Esri, who’s been making them since 2012
• Dark, de-saturated basemap (usually imagery)
• Masked highlight area and vignette
• Single bright, glowing, thematic layer
• “…tricks normal people into realizing how much they like maps”
• “… tricks students into realizing how much they like making maps”
• Now available:
- Firefly Basemap (ArcGIS Living Atlas of the World)
- Firefly Symbols (ArcGIS Living Atlas of the World)
- Firefly Symbols for ArcGIS Pro
Basemap
Basemap muted
Area of interest (drop shadow)
Area of interest (vignette)
Context
Context toned down
Thematic data – U.S. Military Bases
Colored and scaled by size
Glow
ArcGIS Pro or Desktop (or others)
• Download Firefly symbols
- PNGs
- See Resources for where to find them
• Create symbols using John’s instructions
- See Resources for where to find instructions
• Use in your maps
• This demo
ArcGIS Online
Add World Imagery (Firefly) As Basemap
Firefly Grid Lines
World Cities Added to Map
Color and Type / Color and Size
https://www.arcgis.com/apps/Cascade/index.html?appid=cc8ed7ffcd5a4e329cdc552d6856abe4
• Use both size and color to represent data values
- Color hues (e.g., red, green, blue) – qualitative data
- Color values (lightness darkness) – quantitative data
- Size – quantitative data
• Multivariate mapping – more complex, harder to read, easier to misinterpret BUT
• Can carry more meaning
World Cities with Firefly Cartography
Rank 6 50,000 to 99,999
Rank 5 100,000 to 249,999
Rank 4 250,000 to 499,999
Rank 3 500,000 to 999,999
Rank 2 1,000,000 to 4,999,999
Rank 1 5,000,000 and greater
Rank 7 Less than 50,000
Choose the Attribute > Drawing Style > Types (Unique Symbols)
What You See
Click Shape > Scroll to Firefly
Select Symbol
Set the Rest of the Symbols
Edit the Size?
Add Attribute
Select the Same Attribute > Choose Types and Size
Click Types > Options
Edit the Sizes
Invert the Order
Final Result
After Refinements
Smart Mapping
• A set of interconnected “smart” defaults that create data-driven workflows
• Based on the philosophy that making beautiful and correct maps should be fast and easy
• Workflows analyze your data and suggest the best way to represent it
• We suggest visible ranges so you'll see your data at scales that makes sense
• Smart defaults take the guesswork out of setting up many of the map properties
• You get to preview your styling choices on your screen
• With Smart Mapping, you can easily explore your data to discover new patterns
Predominance
https://blogs.esri.com/esri/arcgis/2017/10/10/map-multiple-attributes-at-once-using-predominance/
• Compare multiple related attributes, show which attribute is predominant, and by how
relatively much
Predominant Race and Ethnicity – Block Group
Predominant Race and Ethnicity – Tract (New Orleans, LA)
Predominant Race and Ethnicity – Tract (Houston, TX)
Predominant Race and Ethnicity – Tract (Los Angeles, CA)
Predominant Race and Ethnicity – Tract (Atlanta, GA)
Change Symbols
Choose Attribute
Add Attribute
Choose Attributes
Click Options
Change Symbol
Select Color
Check Colors – Set Transparency
Transparency Default
Change Values
Set Visible Range
Results of Changes
Change the Basemap!
Final Results
Terrain Representation
• Use Esri Terrain layer
• Use Esri Function Templates
• Use ArcGIS Function Templates
• Use ArcGIS Symbol Properties
ProductName = 'Airbus_WorldDEM4Ortho_24m' and ProductName NOT LIKE
'Ov_'
Set DRA Function
Use a Raster Function
Create a New Layer
Change the Appearance
Vector Basemaps
• Create your own version
of a basemap
• No need to curate data
• Just change the look
• Display in ArcGIS Pro, on
the web, in print
• Data updates
automatically if your
map is linked to the
original vector basemap
Esri Unique Basemaps
Esri Basic Basemaps
Unique Basemaps
Vector Basemaps
Vector Basemaps Group (ArcGIS Online)
https://www.arcgis.com/home/group.html?id=30de8da907d240a0bccd5ad3ff25ef4a#overview
• Light Gray Canvas
• Dark Gray Canvas
• Streets
• Human Geography
• Navigation
• Streets (Night)
• Topographic
• Colored Pencil
• Human Geography Dark Basemap
• Nova
• Imagery Hybrid
• Terrain with Labels
• Streets (with Relief)
• World Topograhic Map (v2)
• Mid-Century Map
• Hybrid Reference Layer (v2)
• Modern Antique Map
• Newspaper Map
• Streets (WGS84)
• Mappy Halloween
• Topographic (WGS 84)
1
2
Vector Basemaps
https://www.esri.com/arcgis-blog/products/arcgis-living-atlas/mapping/how-to-customize-esri-vector-
basemaps/?rmedium=redirect&rsource=blogs.esri.com%2Fesri%2Farcgis%2F2015%2F11%2F19%2Fhow-to-customize-esri-
vector-basemaps
• Sign in to your organization account on ArcGIS Online
• Search the Vector Basemap group by Esri
• Find the one you like
• Click … > Add to map
1
2
Vector Basemaps
• Click …
• Copy
• For the copied layer >
Save Layer
• Change the name
• Create the item
1
2
3
4
5
Vector Basemaps
• Sign in to your organization account on ArcGIS Online
• Search the Vector Basemap group by Esri
• Find the one you like
• Click … > Add to map
…or…
• In ArcGIS Online, open a new map
• Add > Browse Living Atlas Layers
• Check that it is a v2 vector tile layer
• Add to map
1
2
3
4
Tile Layer
Item Description page > Download style
1
2
Open JSON file in text editor
• Bracket
Format JSON file
• Open JSONLint
• Paste text
• Validate
• Copy to clipboard
• Copy back into text
Edit JSON file in text editor
https://arcgis-
content.maps.arcgis.com/apps/Cascade/index.html
?appid=d0e213513a074d60aee9ed908bc53c91
• Colors
• Lines
• Labels
• Sprites (points and fills)
Edit JSON file – ArcGIS Vector Tile Style Editor app
http://esri.github.io/arcgis-vectortile-style-editor/#
Edit JSON file – Vector Basemap Style Editor app
https://maps.esri.com/jg/VectorBasemapStyleEditor/index.html
Children’s Basemap
Update file in ArcGIS Online
View changes
Vector Basemaps
• Colors
• Lines
• Fonts
• Area fills (to some degree)
Localization
https://www.esri.com/arcgis-
blog/products/arcgis-living-
atlas/mapping/customize-esri-
vector-basemap-boundaries-and-
labels/?rmedium=redirect&rsource=
blogs.esri.com%2Fesri%2Farcgis%2F2
015%2F11%2F23%2Fcustomize-esri-
vector-basemap-boundaries-and-
labels
• Custom map with
local language
- e.g., Thai
Disputed Boundaries
• Custom map with
locally recognized boundaries
- e.g., Suriname
Vector Basemaps
• Quick tip about drawing order
https://arcgis-content.maps.arcgis.com/apps/Cascade/index.html?appid=a74a8b251f6141fa9561041d36ea56e3
https://arcgis-content.maps.arcgis.com/apps/Cascade/index.html?appid=099f8d201a114b28b3938926af92bedc
https://arcgis-content.maps.arcgis.com/apps/Cascade/index.html?appid=896afcf7752b474288f2aa9c3ffd97d9
https://arcgis-content.maps.arcgis.com/apps/Cascade/index.html?appid=4911bcc4f1fc47d68bde9d217642ac2e
https://arcgis-content.maps.arcgis.com/apps/Cascade/index.html?appid=d0e213513a074d60aee9ed908bc53c91
ArcGIS Online – What’s New in April 2018: Mapping & visualization
• When searching for layers and browsing Living Atlas layers, you can view your search
results in table view or list view, sort and filter the results to help you find what you
need, and add results to your favorites list.
• When using the Predominant Category and Predominant Category and Size styles, you
can now show up to 10 attributes. This enhancement allows you to do more comparisons
with related numeric data such as income groups and education levels.
• When styling layers in Map Viewer, you can now choose to show or hide color, size, or
transparency ramps in the legend using the Show in legend check box.
• The National Park Service symbol set in Map Viewer now includes the full set of the
latest symbols.
• Map Viewer and several configurable apps have increased the number of features that
you can visualize when viewing hosted feature layers. For more information, see How
can I visualize hosted feature layers with large amounts of data?
Firefly Cartography – Blog Articles
• How To: Fake Plastic Maps:
- https://blogs.esri.com/esri/arcgis/2016/11/30/how-to-fake-plastic-maps/
• Earthquakes and Emergence:
- https://adventuresinmapping.com/2017/11/01/earthquakes-and-emergence/
• Luminance Hack:
- https://www.esri.com/arcgis-blog/products/arcgis-pro/data-management/luminance-
hack/?rmedium=redirect&rsource=blogs.esri.com%2Fesri%2Farcgis%2F2017%2F10%2F26%2Fluminance-hack
• Earthquakes:
- https://adventuresinmapping.com/2017/10/26/earthquakes/
• Lights on & Lights Out:
- https://adventuresinmapping.com/2017/04/18/lights-on-lights-out/
• Firefly Cartography:
- https://adventuresinmapping.com/2016/10/17/firefly-cartography/
• How to: Hurricane Map:
- https://adventuresinmapping.com/2016/06/07/how-to-hurricane-map/
Firefly Cartography – Blog Articles
• Firefly Cartography:
- https://nation.maps.arcgis.com/apps/Cascade/index.html?appid=bf439954e2b64d418aedd2fe1
1217d83
• Seismic Illumination:
- https://storymaps.esri.com/stories/2017/seismic-illumination/index.html
• Light On, Lights Out:
- http://www.esri.com/products/maps-we-love/lights-on-out
• Eye of the Hurricanes:
- http://www.esri.com/products/maps-we-love/hurricane-map
• Coastal Views from the United Kingdom:
- http://www.esri.com/products/maps-we-love/coastal-view-uk
Firefly Cartography – Maps We Love (http://www.esri.com/products/maps-
we-love)
Smart Mapping – Blog Articles 1
• Map Multiple Attributes at Once using Predominance:
- https://blogs.esri.com/esri/arcgis/2017/10/10/map-multiple-attributes-at-once-using-
predominance/
• Clustering in ArcGIS Online Enables Data Exploration:
- https://blogs.esri.com/esri/arcgis/2017/09/20/clustering-now-available-in-arcgis-online/
• Use Arcade Expressions to Map the Land to Improvement Ratios in Your Area:
- https://blogs.esri.com/esri/arcgis/2017/05/15/use-arcade-expressions-to-map-the-
improvement-ratios-in-your-area/
• Heat Mapping in Two Simple Steps:
- https://blogs.esri.com/esri/arcgis/2017/04/05/heat-mapping-in-two-simple-steps/
• How to Combine Color and Size Effectively in Your Maps:
- https://blogs.esri.com/esri/arcgis/2017/04/05/show-color-and-size-in-one-map/
• How to Make Smart Color Choices in Your Maps:
- https://blogs.esri.com/esri/arcgis/2017/03/15/how-to-smart-map-color/
Smart Mapping – Blog Articles
• Use Arcade Expressions to Map Your Ideas:
- https://blogs.esri.com/esri/arcgis/2016/12/15/use-arcade-expressions-to-map-your-ideas/
• How to Smart Map in 3 Easy Steps:
- https://blogs.esri.com/esri/arcgis/2016/12/01/how-to-smart-map-in-3-easy-steps/
• Add Demographics to Your Datasets (Fast!):
- https://blogs.esri.com/esri/arcgis/2016/07/19/add-demographics-to-your-datasets-fast/
• Make a Demographic Map in 5 Minutes:
- https://blogs.esri.com/esri/arcgis/2016/04/26/make-a-demographic-map-in-5-minutes/
• Smart Mapping with dynamic workspaces:
- https://blogs.esri.com/esri/arcgis/2016/05/25/smart-mapping-with-dynamic-workspaces/
• 6 Easy Ways to Improve Your Maps:
- https://www.esri.com/arcgis-blog/products/arcgis-online/mapping/6-easy-ways-to-improve-your-
maps/?rmedium=redirect&rsource=blogs.esri.com%2Fesri%2Farcgis%2F2016%2F04%2F12%2Fsix_easy_ways_to
_improve_your_maps
Smart Mapping – Blog Articles 2
• Using Smart Mapping in custom web apps:
- https://blogs.esri.com/esri/arcgis/2016/03/28/using-smart-mapping-in-custom-web-apps/
• Smart Mapping Part 5: Tips and Tricks:
- https://blogs.esri.com/esri/arcgis/2015/06/16/smart-mapping-part-5-tips-and-tricks/
• Smart Mapping Part 4: Pairing Data with Maps:
- https://blogs.esri.com/esri/arcgis/2015/05/12/smart-mapping-part-4-pairing-data-with-maps/
• Smart Mapping Part 3: Rounding classes for Color and Size drawing styles:
- https://blogs.esri.com/esri/arcgis/2015/03/20/smart-mapping-part-3-rounding-classes-for-
color-and-size-drawing-styles/
• Smart Mapping Part 2: Making Better Size and Color Maps:
- https://blogs.esri.com/esri/arcgis/2015/03/17/smart-mapping-part-2-making-better-size-and-
color-maps/
• Introducing Smart Mapping:
- https://blogs.esri.com/esri/arcgis/2015/03/02/introducing-smart-mapping/
Smart Mapping – Blog Articles 3
• Using Smart Mapping in custom web apps:
- https://blogs.esri.com/esri/arcgis/2016/03/28/using-smart-mapping-in-custom-web-apps/
• Smart Mapping Part 5: Tips and Tricks:
- https://blogs.esri.com/esri/arcgis/2015/06/16/smart-mapping-part-5-tips-and-tricks/
• Smart Mapping Part 4: Pairing Data with Maps:
- https://blogs.esri.com/esri/arcgis/2015/05/12/smart-mapping-part-4-pairing-data-with-maps/
• Smart Mapping Part 3: Rounding classes for Color and Size drawing styles:
- https://blogs.esri.com/esri/arcgis/2015/03/20/smart-mapping-part-3-rounding-classes-for-
color-and-size-drawing-styles/
• Smart Mapping Part 2: Making Better Size and Color Maps:
- https://blogs.esri.com/esri/arcgis/2015/03/17/smart-mapping-part-2-making-better-size-and-
color-maps/
• Introducing Smart Mapping:
- https://blogs.esri.com/esri/arcgis/2015/03/02/introducing-smart-mapping/
Smart Mapping – Story Maps
• Smart Mapping:
- https://arcgis-
content.maps.arcgis.com/apps/Cascade/index.html?appid=e71df22089774da8afbe305ad7fd611
1
• How to Smart Map: Color & Size:
- https://www.arcgis.com/apps/Cascade/index.html?appid=cc8ed7ffcd5a4e329cdc552d6856abe4
• How to Smart Map: Color:
- https://www.arcgis.com/apps/Cascade/index.html?appid=9ad60f8362a44a00ad5f52326edb1f2d
• How to Smart Map:
- https://www.arcgis.com/apps/Cascade/index.html?appid=e71df22089774da8afbe305ad7fd6111
Smart Mapping – Videos
• Data Driven Design for Your Maps:
- http://www.esri.com/videos/iframe?videoid=jkeJTjW0yjk&autoplay=true
• Smart Mapping:
- http://www.esri.com/videos/iframe?videoid=HlIzMHo1jNg&autoplay=true
• Smart Mapping for Election Results:
- http://www.esri.com/videos/iframe?videoid=-C8GFpj6zMw&autoplay=true
• Smart Mapping in ArcGIS Online:
- http://videoembed.esri.com/iframe/4830/000000/width/960/1/00:00:00&autoplay=true
• Building a Web App for Data Exploration:
- http://www.esri.com/videos/iframe?videoid=0NEPa6eP7tg&autoplay=true
• Predominance:
- http://www.esri.com/videos/iframe?videoid=0bY4-dS1-LA&autoplay=true
• Mapping Counts and Percents Together:
- http://www.esri.com/videos/iframe?videoid=f7d3VW7B_14&autoplay=true
• ArcGIS Online: Data Exploration with Smart Mapping:
- https://www.youtube.com/watch?v=zlKcR1HlrP0&feature=youtu.be
Vector Basemaps – Blog articles
• How to Update Your Vector Basemap to the New Version (v2):
- https://blogs.esri.com/esri/arcgis/2018/01/11/91131/
• Working with and Customizing Esri Vector Basemaps: The Basics:
- https://blogs.esri.com/esri/arcgis/2017/09/27/working-with-and-customizing-esri-vector-basemaps-the-basics/
• Updated Vector Basemaps and New mapstyler (August 2017):
- https://blogs.esri.com/esri/arcgis/2017/08/03/updated-vector-basemaps-and-new-mapstyler-august-2017/
• The Twelve Ways of a Christmas Vector Basemap:
- https://blogs.esri.com/esri/arcgis/2016/12/20/the-twelve-ways-of-a-christmas-vector-basemap/
• Customize Esri Vector Basemap Boundaries and Labels:
- https://www.esri.com/arcgis-blog/products/arcgis-living-atlas/mapping/customize-esri-vector-basemap-boundaries-and-
labels/?rmedium=redirect&rsource=blogs.esri.com%2Fesri%2Farcgis%2F2015%2F11%2F23%2Fcustomize-esri-vector-basemap-
boundaries-and-labels
• How to Customize Esri Vector Basemaps:
- https://www.esri.com/arcgis-blog/products/arcgis-living-atlas/mapping/how-to-customize-esri-vector-
basemaps/?rmedium=redirect&rsource=blogs.esri.com%2Fesri%2Farcgis%2F2015%2F11%2F19%2Fhow-to-customize-esri-
vector-basemaps
Vector Basemaps – Story Maps
• Customizing Esri's Vector Basemaps: Part 1 - Starting:
- https://arcg.is/jKrSX
• Customizing Esri's Vector Basemaps: Part 2 - Colors:
- https://arcg.is/1Srq01
• Customizing Esri's Vector Basemaps: Part 3 - Lines:
- https://arcg.is/vvi04
• Customizing Esri's Vector Basemaps: Part 4 - Labels:
- https://arcg.is/0aPTaC
• Fonts and Sprites:
- https://arcgis-
content.maps.arcgis.com/apps/Cascade/index.html?appid=d0e213513a074d60aee9ed908bc53c
91
Living Atlas – Story Maps
• Calculate Crop Production with Living Atlas Layers in ArcGIS Pro:
https://landscapeteam.maps.arcgis.com/apps/MapJournal/index.html?appid=d60b406d
eb6c4c7c9c0aee98cf1c97af
• Styling Basemaps:
• https://youtu.be/Sur16Qe1ymw
• Living Atlas: Introducing a GIS of the World
• https://youtu.be/ZHIckoMtt4Y
• Living Atlas - Webinars
• February 2017 Living Atlas Community Webinar Recording Now Available!:
• https://blogs.esri.com/esri/arcgis/2017/02/24/february-2017-living-atlas-community-
webinar-recording-available/
• November 2017 Living Atlas Community Webinar Recording Available:
Living Atlas – Videos
Living Atlas – Webinars
• February 2017 Living Atlas Community Webinar Recording Now Available!:
- https://blogs.esri.com/esri/arcgis/2017/02/24/february-2017-living-atlas-community-webinar-
recording-available/
• November 2017 Living Atlas Community Webinar Recording Available:
- https://blogs.esri.com/esri/arcgis/2017/11/13/november-2017-living-atlas-community-
webinar-recording-available/
• FREE Living Atlas Webinar! Make Meaningful Policy Maps For Your Community Using the
Living Atlas:
- https://blogs.esri.com/esri/arcgis/2017/10/20/free-living-atlas-webinar-make-meaningful-
policy-maps-for-your-community-using-the-living-atlas/

Compelling Cartography with ArcGIS

  • 1.
    Compelling Cartography with ArcGIS AileenBuckley, PhD Research Cartographer Esri – Redlands @mappingcenter, @cartatesri
  • 2.
    Topics covered • Whereto Look for Resources • Firefly Cartography • Smart Mapping - Predominance - Color and Size or Type and Size • Terrain Representation • Vector Basemaps
  • 3.
    Where to Lookfor Resources • Blog articles - ArcGIS blog (www.esri.com/arcgis-blog) - John Nelson’s blog (Adventures in Mapping - https://adventuresinmapping.com/) - Jim Herries’ blog (https://jimherries.tumblr.com/) - Ken Field’s blog (http://cartonerd.blogspot.com/) • Learn lesson (http://learn.arcgis.com/en/) • Story Maps (https://storymaps.arcgis.com/en/) • Esri Training (https://www.esri.com/training/catalog/) - Videos - Webinars • Maps We Love
  • 4.
  • 5.
  • 6.
  • 7.
  • 8.
  • 9.
  • 10.
    Firefly Cartography Developed byJohn Nelson, Esri, who’s been making them since 2012 • Dark, de-saturated basemap (usually imagery) • Masked highlight area and vignette • Single bright, glowing, thematic layer • “…tricks normal people into realizing how much they like maps” • “… tricks students into realizing how much they like making maps” • Now available: - Firefly Basemap (ArcGIS Living Atlas of the World) - Firefly Symbols (ArcGIS Living Atlas of the World) - Firefly Symbols for ArcGIS Pro
  • 12.
  • 13.
  • 14.
    Area of interest(drop shadow)
  • 15.
    Area of interest(vignette)
  • 16.
  • 17.
  • 18.
    Thematic data –U.S. Military Bases
  • 19.
  • 20.
  • 21.
    ArcGIS Pro orDesktop (or others) • Download Firefly symbols - PNGs - See Resources for where to find them • Create symbols using John’s instructions - See Resources for where to find instructions • Use in your maps • This demo ArcGIS Online
  • 22.
    Add World Imagery(Firefly) As Basemap
  • 23.
  • 24.
  • 25.
    Color and Type/ Color and Size https://www.arcgis.com/apps/Cascade/index.html?appid=cc8ed7ffcd5a4e329cdc552d6856abe4 • Use both size and color to represent data values - Color hues (e.g., red, green, blue) – qualitative data - Color values (lightness darkness) – quantitative data - Size – quantitative data • Multivariate mapping – more complex, harder to read, easier to misinterpret BUT • Can carry more meaning
  • 26.
    World Cities withFirefly Cartography Rank 6 50,000 to 99,999 Rank 5 100,000 to 249,999 Rank 4 250,000 to 499,999 Rank 3 500,000 to 999,999 Rank 2 1,000,000 to 4,999,999 Rank 1 5,000,000 and greater Rank 7 Less than 50,000
  • 27.
    Choose the Attribute> Drawing Style > Types (Unique Symbols)
  • 28.
  • 29.
    Click Shape >Scroll to Firefly
  • 30.
  • 31.
    Set the Restof the Symbols
  • 32.
  • 33.
  • 34.
    Select the SameAttribute > Choose Types and Size
  • 35.
  • 36.
  • 37.
  • 38.
  • 39.
  • 40.
    Smart Mapping • Aset of interconnected “smart” defaults that create data-driven workflows • Based on the philosophy that making beautiful and correct maps should be fast and easy • Workflows analyze your data and suggest the best way to represent it • We suggest visible ranges so you'll see your data at scales that makes sense • Smart defaults take the guesswork out of setting up many of the map properties • You get to preview your styling choices on your screen • With Smart Mapping, you can easily explore your data to discover new patterns
  • 41.
  • 42.
    Predominant Race andEthnicity – Block Group
  • 43.
    Predominant Race andEthnicity – Tract (New Orleans, LA)
  • 44.
    Predominant Race andEthnicity – Tract (Houston, TX)
  • 45.
    Predominant Race andEthnicity – Tract (Los Angeles, CA)
  • 46.
    Predominant Race andEthnicity – Tract (Atlanta, GA)
  • 49.
  • 50.
  • 51.
  • 52.
  • 53.
  • 54.
  • 55.
  • 56.
    Check Colors –Set Transparency
  • 57.
  • 58.
  • 59.
  • 60.
  • 61.
  • 62.
  • 63.
    Terrain Representation • UseEsri Terrain layer • Use Esri Function Templates • Use ArcGIS Function Templates • Use ArcGIS Symbol Properties
  • 65.
    ProductName = 'Airbus_WorldDEM4Ortho_24m'and ProductName NOT LIKE 'Ov_'
  • 66.
  • 67.
    Use a RasterFunction
  • 68.
  • 69.
  • 70.
    Vector Basemaps • Createyour own version of a basemap • No need to curate data • Just change the look • Display in ArcGIS Pro, on the web, in print • Data updates automatically if your map is linked to the original vector basemap
  • 71.
  • 72.
  • 73.
  • 74.
  • 75.
    Vector Basemaps Group(ArcGIS Online) https://www.arcgis.com/home/group.html?id=30de8da907d240a0bccd5ad3ff25ef4a#overview • Light Gray Canvas • Dark Gray Canvas • Streets • Human Geography • Navigation • Streets (Night) • Topographic • Colored Pencil • Human Geography Dark Basemap • Nova • Imagery Hybrid • Terrain with Labels • Streets (with Relief) • World Topograhic Map (v2) • Mid-Century Map • Hybrid Reference Layer (v2) • Modern Antique Map • Newspaper Map • Streets (WGS84) • Mappy Halloween • Topographic (WGS 84)
  • 76.
    Vector Basemaps Group(ArcGIS Online) https://www.arcgis.com/home/group.html?id=30de8da907d240a0bccd5ad3ff25ef4a#overview • Light Gray Canvas • Dark Gray Canvas • Streets • Human Geography • Navigation • Streets (Night) • Topographic • Colored Pencil • Human Geography Dark Basemap • Nova • Imagery Hybrid • Terrain with Labels • Streets (with Relief) • World Topograhic Map (v2) • Mid-Century Map • Hybrid Reference Layer (v2) • Modern Antique Map • Newspaper Map • Streets (WGS84) • Mappy Halloween • Topographic (WGS 84) 1 2
  • 77.
  • 78.
    Vector Basemaps • Click… • Copy • For the copied layer > Save Layer • Change the name • Create the item 1 2 3 4 5
  • 79.
    Vector Basemaps • Signin to your organization account on ArcGIS Online • Search the Vector Basemap group by Esri • Find the one you like • Click … > Add to map …or… • In ArcGIS Online, open a new map • Add > Browse Living Atlas Layers • Check that it is a v2 vector tile layer • Add to map 1 2 3 4
  • 80.
  • 81.
    Item Description page> Download style 1 2
  • 82.
    Open JSON filein text editor • Bracket
  • 83.
    Format JSON file •Open JSONLint • Paste text • Validate • Copy to clipboard • Copy back into text
  • 84.
    Edit JSON filein text editor https://arcgis- content.maps.arcgis.com/apps/Cascade/index.html ?appid=d0e213513a074d60aee9ed908bc53c91 • Colors • Lines • Labels • Sprites (points and fills)
  • 85.
    Edit JSON file– ArcGIS Vector Tile Style Editor app http://esri.github.io/arcgis-vectortile-style-editor/#
  • 86.
    Edit JSON file– Vector Basemap Style Editor app https://maps.esri.com/jg/VectorBasemapStyleEditor/index.html
  • 87.
  • 88.
    Update file inArcGIS Online
  • 89.
    Update file inArcGIS Online
  • 90.
  • 91.
    Vector Basemaps • Colors •Lines • Fonts • Area fills (to some degree)
  • 92.
  • 93.
    Disputed Boundaries • Custommap with locally recognized boundaries - e.g., Suriname
  • 94.
    Vector Basemaps • Quicktip about drawing order
  • 95.
  • 96.
  • 97.
  • 98.
  • 99.
  • 100.
    ArcGIS Online –What’s New in April 2018: Mapping & visualization • When searching for layers and browsing Living Atlas layers, you can view your search results in table view or list view, sort and filter the results to help you find what you need, and add results to your favorites list. • When using the Predominant Category and Predominant Category and Size styles, you can now show up to 10 attributes. This enhancement allows you to do more comparisons with related numeric data such as income groups and education levels. • When styling layers in Map Viewer, you can now choose to show or hide color, size, or transparency ramps in the legend using the Show in legend check box. • The National Park Service symbol set in Map Viewer now includes the full set of the latest symbols. • Map Viewer and several configurable apps have increased the number of features that you can visualize when viewing hosted feature layers. For more information, see How can I visualize hosted feature layers with large amounts of data?
  • 102.
    Firefly Cartography –Blog Articles • How To: Fake Plastic Maps: - https://blogs.esri.com/esri/arcgis/2016/11/30/how-to-fake-plastic-maps/ • Earthquakes and Emergence: - https://adventuresinmapping.com/2017/11/01/earthquakes-and-emergence/ • Luminance Hack: - https://www.esri.com/arcgis-blog/products/arcgis-pro/data-management/luminance- hack/?rmedium=redirect&rsource=blogs.esri.com%2Fesri%2Farcgis%2F2017%2F10%2F26%2Fluminance-hack • Earthquakes: - https://adventuresinmapping.com/2017/10/26/earthquakes/ • Lights on & Lights Out: - https://adventuresinmapping.com/2017/04/18/lights-on-lights-out/ • Firefly Cartography: - https://adventuresinmapping.com/2016/10/17/firefly-cartography/ • How to: Hurricane Map: - https://adventuresinmapping.com/2016/06/07/how-to-hurricane-map/
  • 103.
    Firefly Cartography –Blog Articles • Firefly Cartography: - https://nation.maps.arcgis.com/apps/Cascade/index.html?appid=bf439954e2b64d418aedd2fe1 1217d83 • Seismic Illumination: - https://storymaps.esri.com/stories/2017/seismic-illumination/index.html • Light On, Lights Out: - http://www.esri.com/products/maps-we-love/lights-on-out • Eye of the Hurricanes: - http://www.esri.com/products/maps-we-love/hurricane-map • Coastal Views from the United Kingdom: - http://www.esri.com/products/maps-we-love/coastal-view-uk Firefly Cartography – Maps We Love (http://www.esri.com/products/maps- we-love)
  • 104.
    Smart Mapping –Blog Articles 1 • Map Multiple Attributes at Once using Predominance: - https://blogs.esri.com/esri/arcgis/2017/10/10/map-multiple-attributes-at-once-using- predominance/ • Clustering in ArcGIS Online Enables Data Exploration: - https://blogs.esri.com/esri/arcgis/2017/09/20/clustering-now-available-in-arcgis-online/ • Use Arcade Expressions to Map the Land to Improvement Ratios in Your Area: - https://blogs.esri.com/esri/arcgis/2017/05/15/use-arcade-expressions-to-map-the- improvement-ratios-in-your-area/ • Heat Mapping in Two Simple Steps: - https://blogs.esri.com/esri/arcgis/2017/04/05/heat-mapping-in-two-simple-steps/ • How to Combine Color and Size Effectively in Your Maps: - https://blogs.esri.com/esri/arcgis/2017/04/05/show-color-and-size-in-one-map/ • How to Make Smart Color Choices in Your Maps: - https://blogs.esri.com/esri/arcgis/2017/03/15/how-to-smart-map-color/
  • 105.
    Smart Mapping –Blog Articles • Use Arcade Expressions to Map Your Ideas: - https://blogs.esri.com/esri/arcgis/2016/12/15/use-arcade-expressions-to-map-your-ideas/ • How to Smart Map in 3 Easy Steps: - https://blogs.esri.com/esri/arcgis/2016/12/01/how-to-smart-map-in-3-easy-steps/ • Add Demographics to Your Datasets (Fast!): - https://blogs.esri.com/esri/arcgis/2016/07/19/add-demographics-to-your-datasets-fast/ • Make a Demographic Map in 5 Minutes: - https://blogs.esri.com/esri/arcgis/2016/04/26/make-a-demographic-map-in-5-minutes/ • Smart Mapping with dynamic workspaces: - https://blogs.esri.com/esri/arcgis/2016/05/25/smart-mapping-with-dynamic-workspaces/ • 6 Easy Ways to Improve Your Maps: - https://www.esri.com/arcgis-blog/products/arcgis-online/mapping/6-easy-ways-to-improve-your- maps/?rmedium=redirect&rsource=blogs.esri.com%2Fesri%2Farcgis%2F2016%2F04%2F12%2Fsix_easy_ways_to _improve_your_maps
  • 106.
    Smart Mapping –Blog Articles 2 • Using Smart Mapping in custom web apps: - https://blogs.esri.com/esri/arcgis/2016/03/28/using-smart-mapping-in-custom-web-apps/ • Smart Mapping Part 5: Tips and Tricks: - https://blogs.esri.com/esri/arcgis/2015/06/16/smart-mapping-part-5-tips-and-tricks/ • Smart Mapping Part 4: Pairing Data with Maps: - https://blogs.esri.com/esri/arcgis/2015/05/12/smart-mapping-part-4-pairing-data-with-maps/ • Smart Mapping Part 3: Rounding classes for Color and Size drawing styles: - https://blogs.esri.com/esri/arcgis/2015/03/20/smart-mapping-part-3-rounding-classes-for- color-and-size-drawing-styles/ • Smart Mapping Part 2: Making Better Size and Color Maps: - https://blogs.esri.com/esri/arcgis/2015/03/17/smart-mapping-part-2-making-better-size-and- color-maps/ • Introducing Smart Mapping: - https://blogs.esri.com/esri/arcgis/2015/03/02/introducing-smart-mapping/
  • 107.
    Smart Mapping –Blog Articles 3 • Using Smart Mapping in custom web apps: - https://blogs.esri.com/esri/arcgis/2016/03/28/using-smart-mapping-in-custom-web-apps/ • Smart Mapping Part 5: Tips and Tricks: - https://blogs.esri.com/esri/arcgis/2015/06/16/smart-mapping-part-5-tips-and-tricks/ • Smart Mapping Part 4: Pairing Data with Maps: - https://blogs.esri.com/esri/arcgis/2015/05/12/smart-mapping-part-4-pairing-data-with-maps/ • Smart Mapping Part 3: Rounding classes for Color and Size drawing styles: - https://blogs.esri.com/esri/arcgis/2015/03/20/smart-mapping-part-3-rounding-classes-for- color-and-size-drawing-styles/ • Smart Mapping Part 2: Making Better Size and Color Maps: - https://blogs.esri.com/esri/arcgis/2015/03/17/smart-mapping-part-2-making-better-size-and- color-maps/ • Introducing Smart Mapping: - https://blogs.esri.com/esri/arcgis/2015/03/02/introducing-smart-mapping/
  • 108.
    Smart Mapping –Story Maps • Smart Mapping: - https://arcgis- content.maps.arcgis.com/apps/Cascade/index.html?appid=e71df22089774da8afbe305ad7fd611 1 • How to Smart Map: Color & Size: - https://www.arcgis.com/apps/Cascade/index.html?appid=cc8ed7ffcd5a4e329cdc552d6856abe4 • How to Smart Map: Color: - https://www.arcgis.com/apps/Cascade/index.html?appid=9ad60f8362a44a00ad5f52326edb1f2d • How to Smart Map: - https://www.arcgis.com/apps/Cascade/index.html?appid=e71df22089774da8afbe305ad7fd6111
  • 109.
    Smart Mapping –Videos • Data Driven Design for Your Maps: - http://www.esri.com/videos/iframe?videoid=jkeJTjW0yjk&autoplay=true • Smart Mapping: - http://www.esri.com/videos/iframe?videoid=HlIzMHo1jNg&autoplay=true • Smart Mapping for Election Results: - http://www.esri.com/videos/iframe?videoid=-C8GFpj6zMw&autoplay=true • Smart Mapping in ArcGIS Online: - http://videoembed.esri.com/iframe/4830/000000/width/960/1/00:00:00&autoplay=true • Building a Web App for Data Exploration: - http://www.esri.com/videos/iframe?videoid=0NEPa6eP7tg&autoplay=true • Predominance: - http://www.esri.com/videos/iframe?videoid=0bY4-dS1-LA&autoplay=true • Mapping Counts and Percents Together: - http://www.esri.com/videos/iframe?videoid=f7d3VW7B_14&autoplay=true • ArcGIS Online: Data Exploration with Smart Mapping: - https://www.youtube.com/watch?v=zlKcR1HlrP0&feature=youtu.be
  • 110.
    Vector Basemaps –Blog articles • How to Update Your Vector Basemap to the New Version (v2): - https://blogs.esri.com/esri/arcgis/2018/01/11/91131/ • Working with and Customizing Esri Vector Basemaps: The Basics: - https://blogs.esri.com/esri/arcgis/2017/09/27/working-with-and-customizing-esri-vector-basemaps-the-basics/ • Updated Vector Basemaps and New mapstyler (August 2017): - https://blogs.esri.com/esri/arcgis/2017/08/03/updated-vector-basemaps-and-new-mapstyler-august-2017/ • The Twelve Ways of a Christmas Vector Basemap: - https://blogs.esri.com/esri/arcgis/2016/12/20/the-twelve-ways-of-a-christmas-vector-basemap/ • Customize Esri Vector Basemap Boundaries and Labels: - https://www.esri.com/arcgis-blog/products/arcgis-living-atlas/mapping/customize-esri-vector-basemap-boundaries-and- labels/?rmedium=redirect&rsource=blogs.esri.com%2Fesri%2Farcgis%2F2015%2F11%2F23%2Fcustomize-esri-vector-basemap- boundaries-and-labels • How to Customize Esri Vector Basemaps: - https://www.esri.com/arcgis-blog/products/arcgis-living-atlas/mapping/how-to-customize-esri-vector- basemaps/?rmedium=redirect&rsource=blogs.esri.com%2Fesri%2Farcgis%2F2015%2F11%2F19%2Fhow-to-customize-esri- vector-basemaps
  • 111.
    Vector Basemaps –Story Maps • Customizing Esri's Vector Basemaps: Part 1 - Starting: - https://arcg.is/jKrSX • Customizing Esri's Vector Basemaps: Part 2 - Colors: - https://arcg.is/1Srq01 • Customizing Esri's Vector Basemaps: Part 3 - Lines: - https://arcg.is/vvi04 • Customizing Esri's Vector Basemaps: Part 4 - Labels: - https://arcg.is/0aPTaC • Fonts and Sprites: - https://arcgis- content.maps.arcgis.com/apps/Cascade/index.html?appid=d0e213513a074d60aee9ed908bc53c 91
  • 112.
    Living Atlas –Story Maps • Calculate Crop Production with Living Atlas Layers in ArcGIS Pro: https://landscapeteam.maps.arcgis.com/apps/MapJournal/index.html?appid=d60b406d eb6c4c7c9c0aee98cf1c97af • Styling Basemaps: • https://youtu.be/Sur16Qe1ymw • Living Atlas: Introducing a GIS of the World • https://youtu.be/ZHIckoMtt4Y • Living Atlas - Webinars • February 2017 Living Atlas Community Webinar Recording Now Available!: • https://blogs.esri.com/esri/arcgis/2017/02/24/february-2017-living-atlas-community- webinar-recording-available/ • November 2017 Living Atlas Community Webinar Recording Available: Living Atlas – Videos
  • 113.
    Living Atlas –Webinars • February 2017 Living Atlas Community Webinar Recording Now Available!: - https://blogs.esri.com/esri/arcgis/2017/02/24/february-2017-living-atlas-community-webinar- recording-available/ • November 2017 Living Atlas Community Webinar Recording Available: - https://blogs.esri.com/esri/arcgis/2017/11/13/november-2017-living-atlas-community- webinar-recording-available/ • FREE Living Atlas Webinar! Make Meaningful Policy Maps For Your Community Using the Living Atlas: - https://blogs.esri.com/esri/arcgis/2017/10/20/free-living-atlas-webinar-make-meaningful- policy-maps-for-your-community-using-the-living-atlas/

Editor's Notes

  • #13 A fundamental (and often overlooked) cartographic concept is the firm establishment of a foreground/background visual hierarchy. Content meant to provide spatial context (the basemap) should recede in visual priority, helping to establish the thematic layers that they support (rather than compete with them).
  • #14 There are lots of ways to sufficiently mute your basemap (including having no basemap at all), but for satellite imagery, de-saturation is a nice option. An image that is all or mostly black and white won’t pollute as much of the color channel, ideally reserved for thematic data, in our cognitive wet-works.
  • #15 Defining the topic area helps establish a focused coverage. In this case, an inverted semitransparent fill of the area of interest reduces perimeter noise. Additionally, there are a few offset copies of the border with reduced opacity to create a subtle drop-shadow of the area.
  • #16 Additionally, a vignette effect draws the eye to where it needs to be, burning the edges of the composition back, to further frame the subject (in ArcGIS Pro you can add a rectangle to the layout, with a gradient fill -or you can apply it in a graphic design program). This is a photography minor talking -I don’t think I would have thought of it without lots of hours in a darkroom. This is a nice talking point on the difference between training and an education. Anyway…
  • #17 There’s a fine line to walk when trying to provide enough context for a map reader, without bloating the basemap with too much attention-stealing detail. We Americans are used to seeing our maps with state borders, so they do a good job of providing a reference. But these are far too bright.
  • #18 So here they are toned down almost to nothing (line opacity pushed down to about 20% -also, a dark version in a thicker stroke underneath that, for a little contrast over the variable satellite background).
  • #19 Here’s the star player. First chair. The reason for this basemap to exist. This is a map of all the military bases in the United States. But there are some interesting attributes about this data that we don’t see when we just use dots.
  • #20 Here are those military installations colored and scaled by their size. Some general rules of thematic cartography: – If the basemap is dark, the thematic data should increase towards brightness. If it’s a light basemap, the thematic data should increase to darkness. Contrast is the vehicle for communicating prominence. But these are just solid-colored dots. – Color gradients should not replicate the rainbow. There are plenty of studies that demonstrate how poor of a choice a rainbow color gradient is for continuous data graphics (relatedly, check out thisamazing color bonanza). If you stick to the cool end or the warm end of the spectrum for a thematic gradient, stay on that side.
  • #21 What if they glowed?! Here are those same military locations using a glow effect for the point symbol, rather than a solid color. Some notes on glows… – How: Glows are a radial gradient. The have an abrupt white center (yes, white), followed by an opaque theme color, finally grading to a fully transparent theme color at the perimeter. – Why: The glow effect, while providing a distinct aesthetic, and perhaps hijacking some primitive cognitive wires, is a fitting example of Waldo Tobler‘s First Law of Geography: “everything is related to everything else, but near things are more related than distant things.” Or, the effect a thing has on its surroundings dissipates with distance. It’s the foundational concept of quantitative geography -and happens to be a convenient rationalization for glowing symbology. For example, the impact that these military bases impart on their surrounding areas is quite strong on-base, and diminishes as you travel away (air and ground transportation noise, traffic impacts, employment draw to local residents, the visual impact on the land). Things rarely just end abruptly -they make a difference to their surroundings. This is why I grate a little when I see hurricane maps with fine solid crisp one-dimensional lines sweeping out the path of the eye.