Downloaded 71 times
![Mapping Your Data Christopher Martin [email_address]](https://image.slidesharecdn.com/mapping2-1209000010308938-9/85/Mapping-Your-Data-2-1-320.jpg)
![Mapping Your Data Christopher Martin [email_address]](https://image.slidesharecdn.com/mapping2-1209000010308938-9/75/Mapping-Your-Data-2-1-2048.jpg)
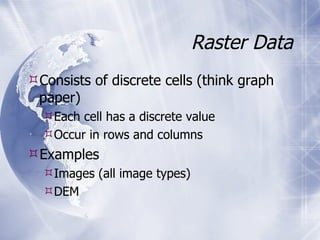
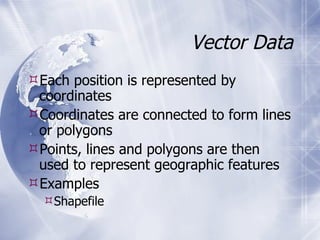
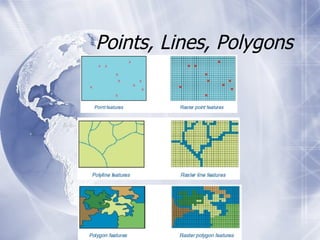
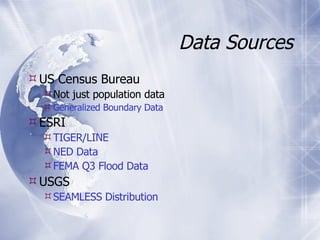
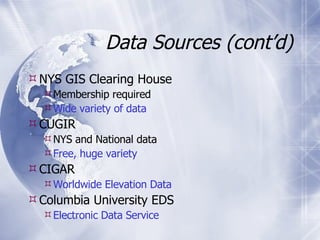
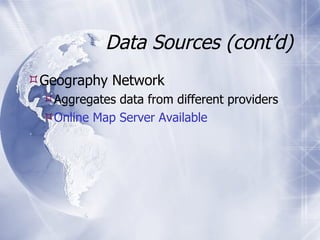
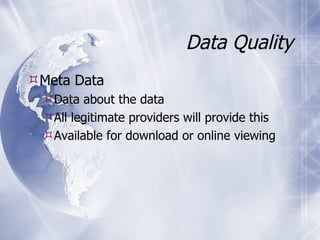
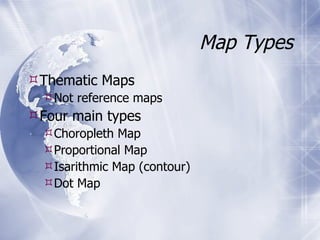
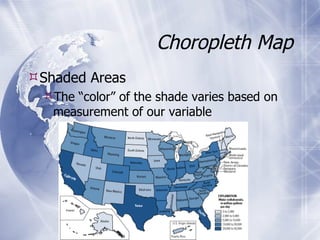
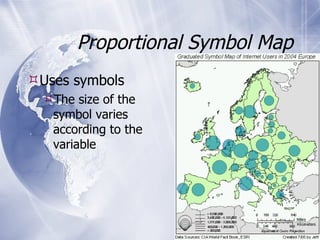
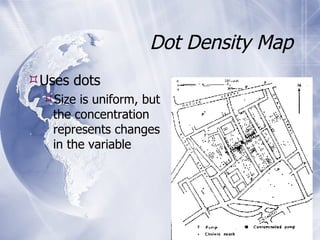
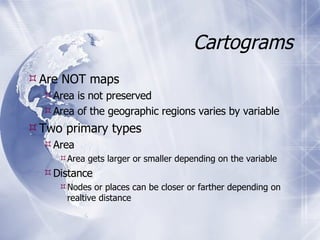
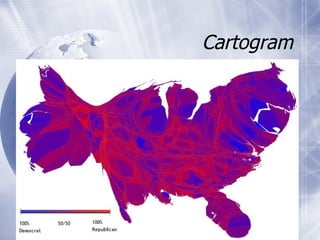
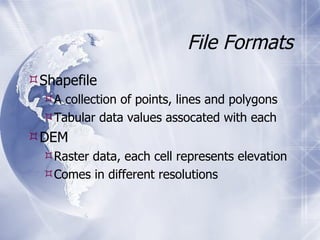
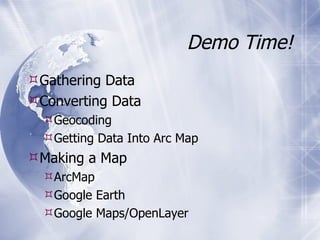

The document provides an overview of mapping data types, sources, and visualization techniques. It discusses two primary data models for maps: raster and vector data. Raster data consists of cells with discrete values arranged in rows and columns, while vector data uses coordinates to represent points, lines, and polygons. It lists several sources for mapping data, and describes common map types like choropleth, proportional symbol, dot density, and cartogram maps. Finally, it mentions some file formats and mapping software/tools.


