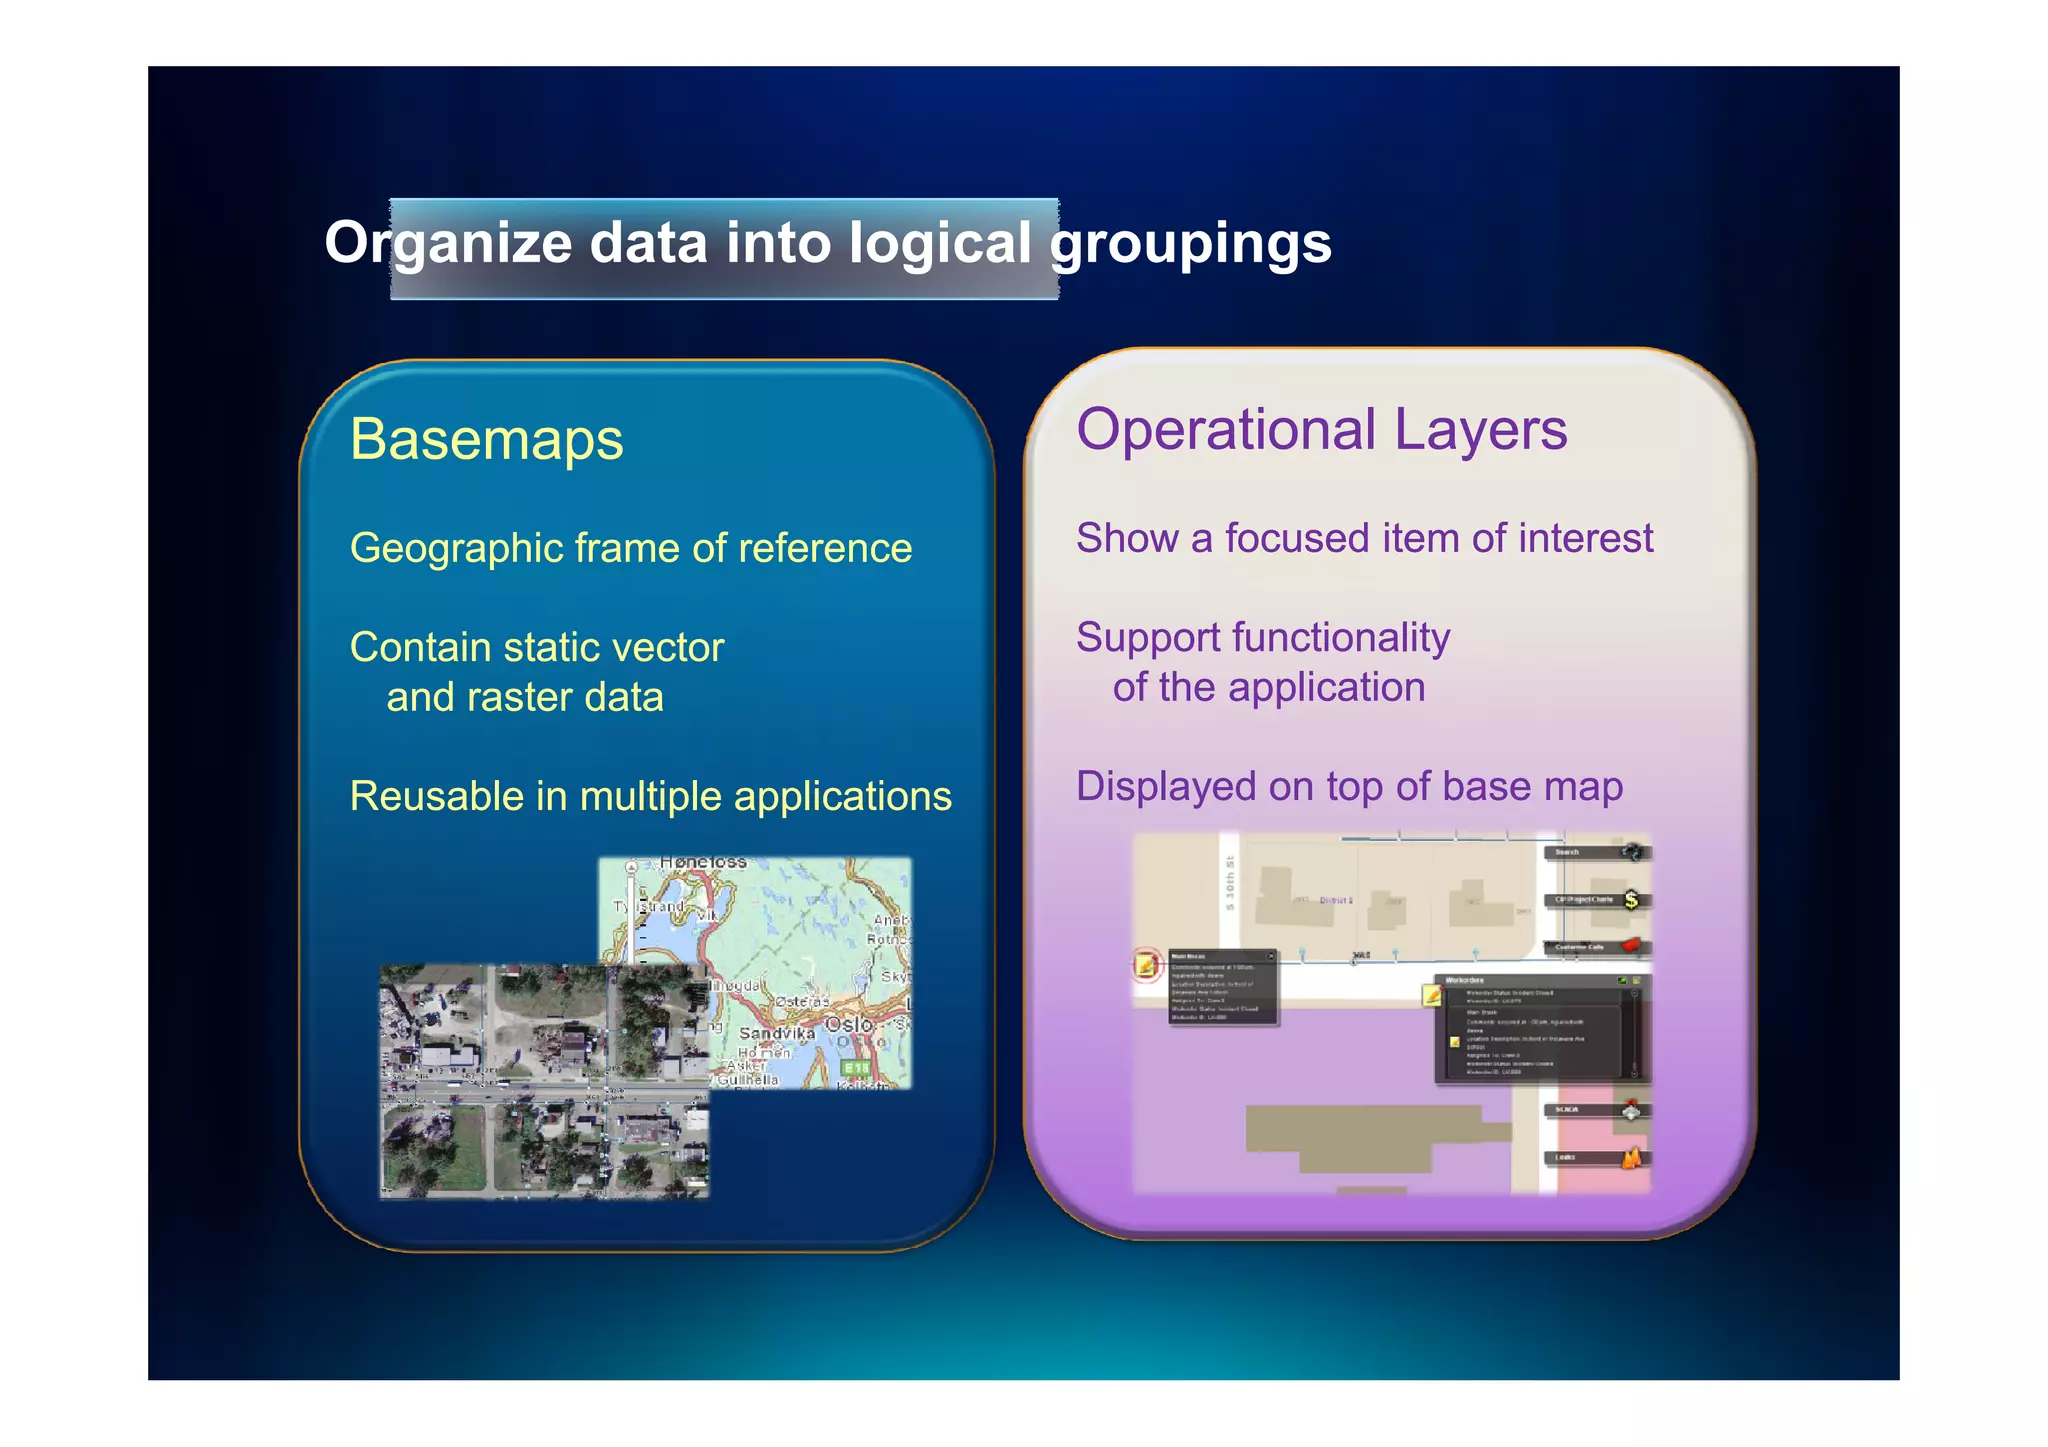
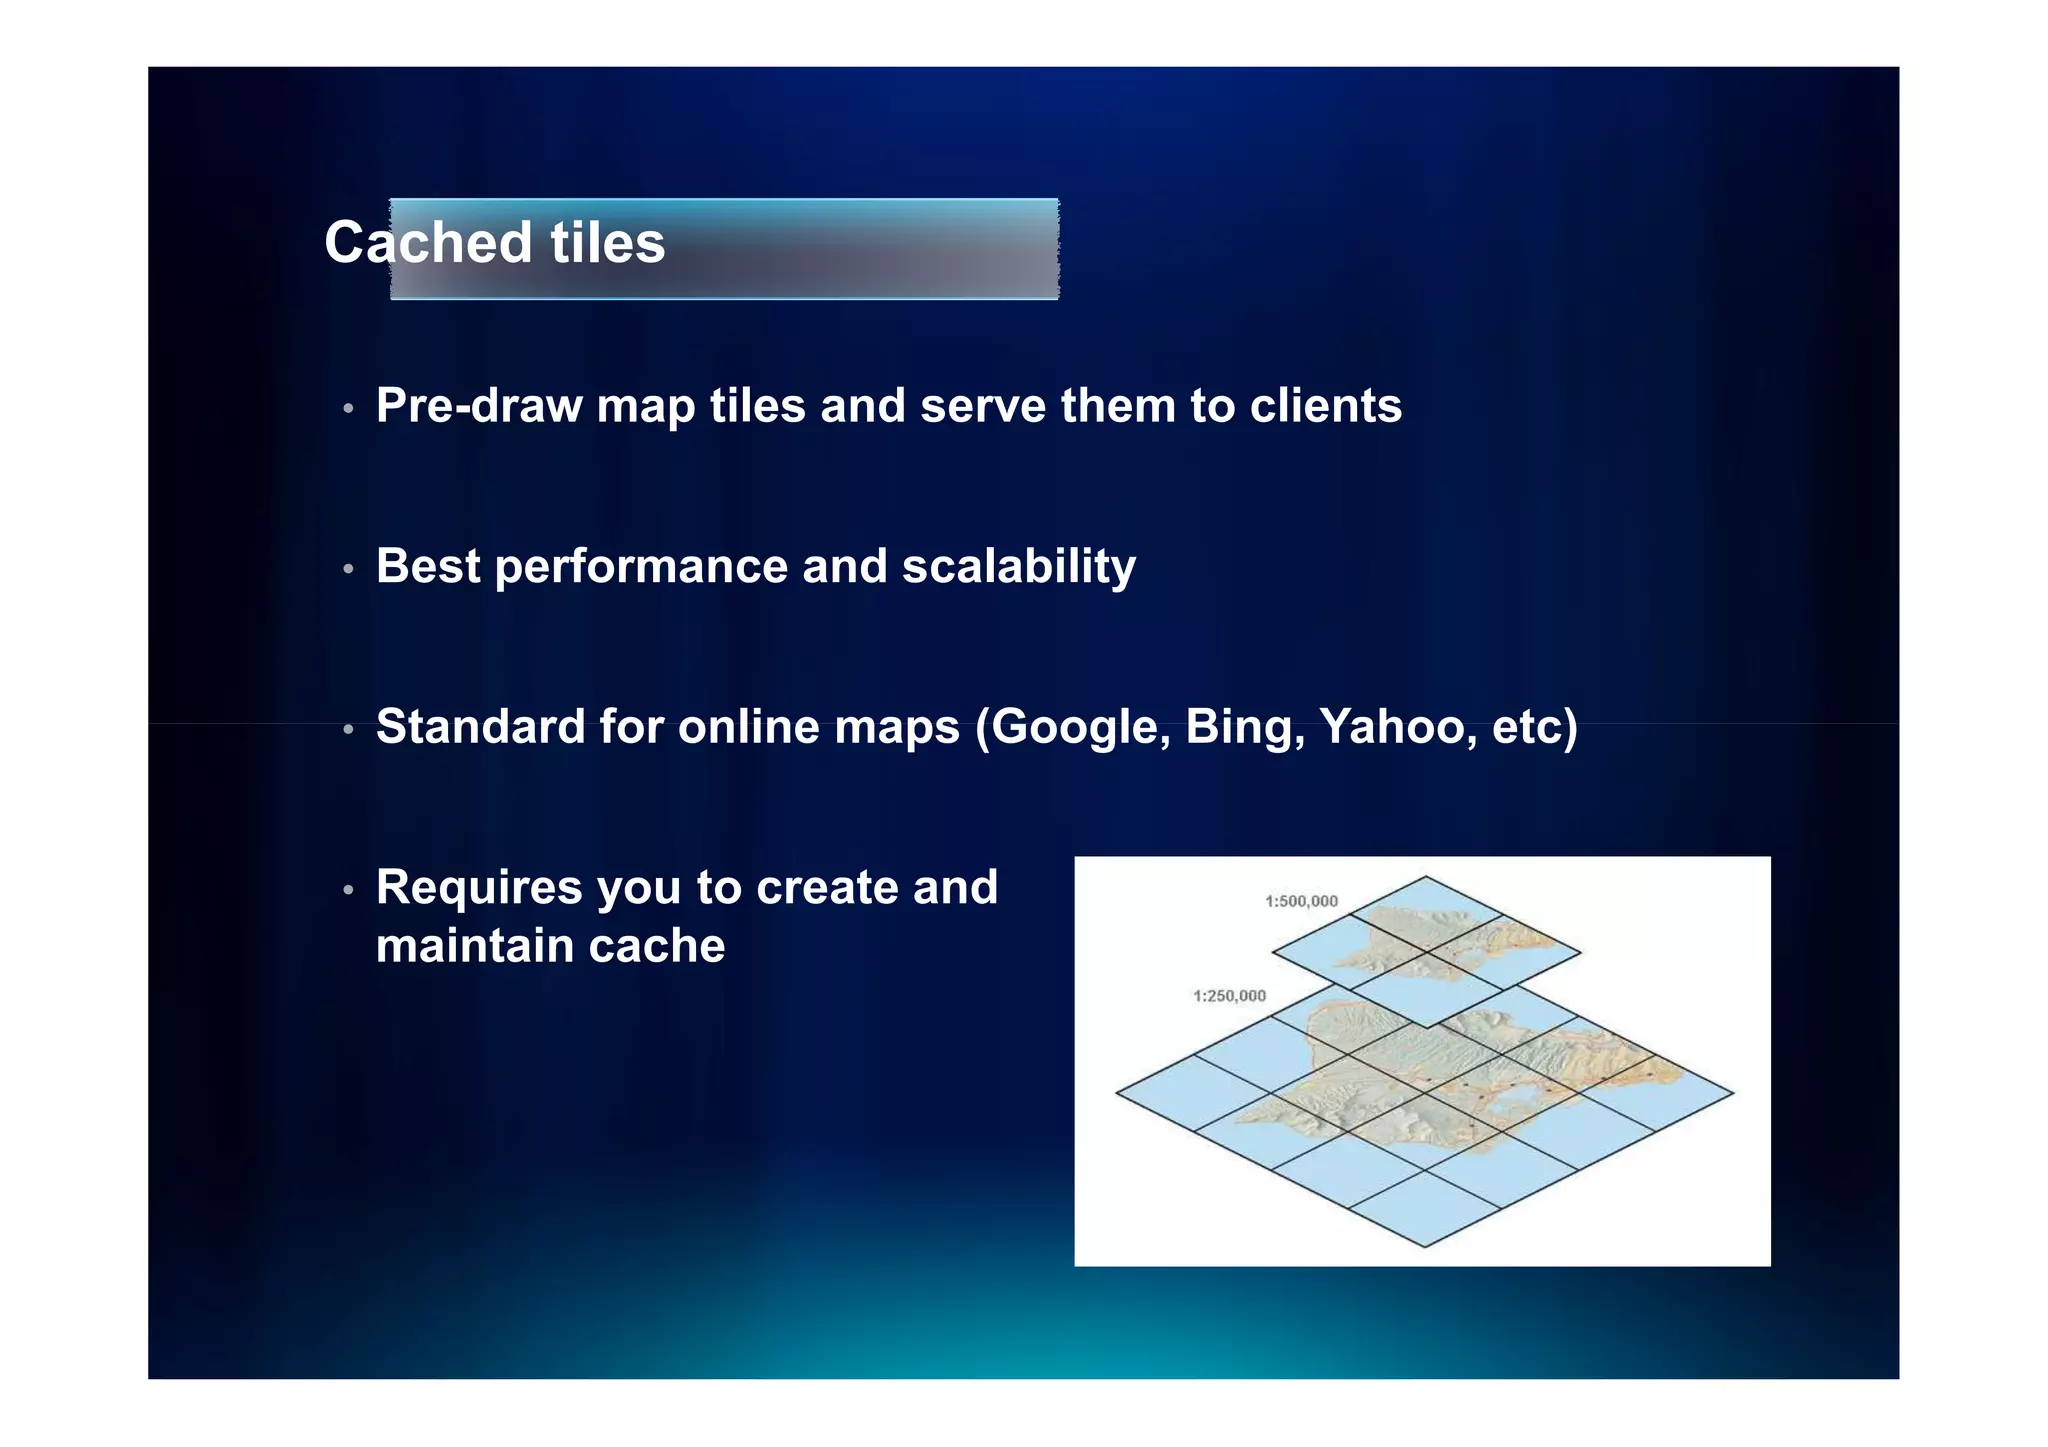
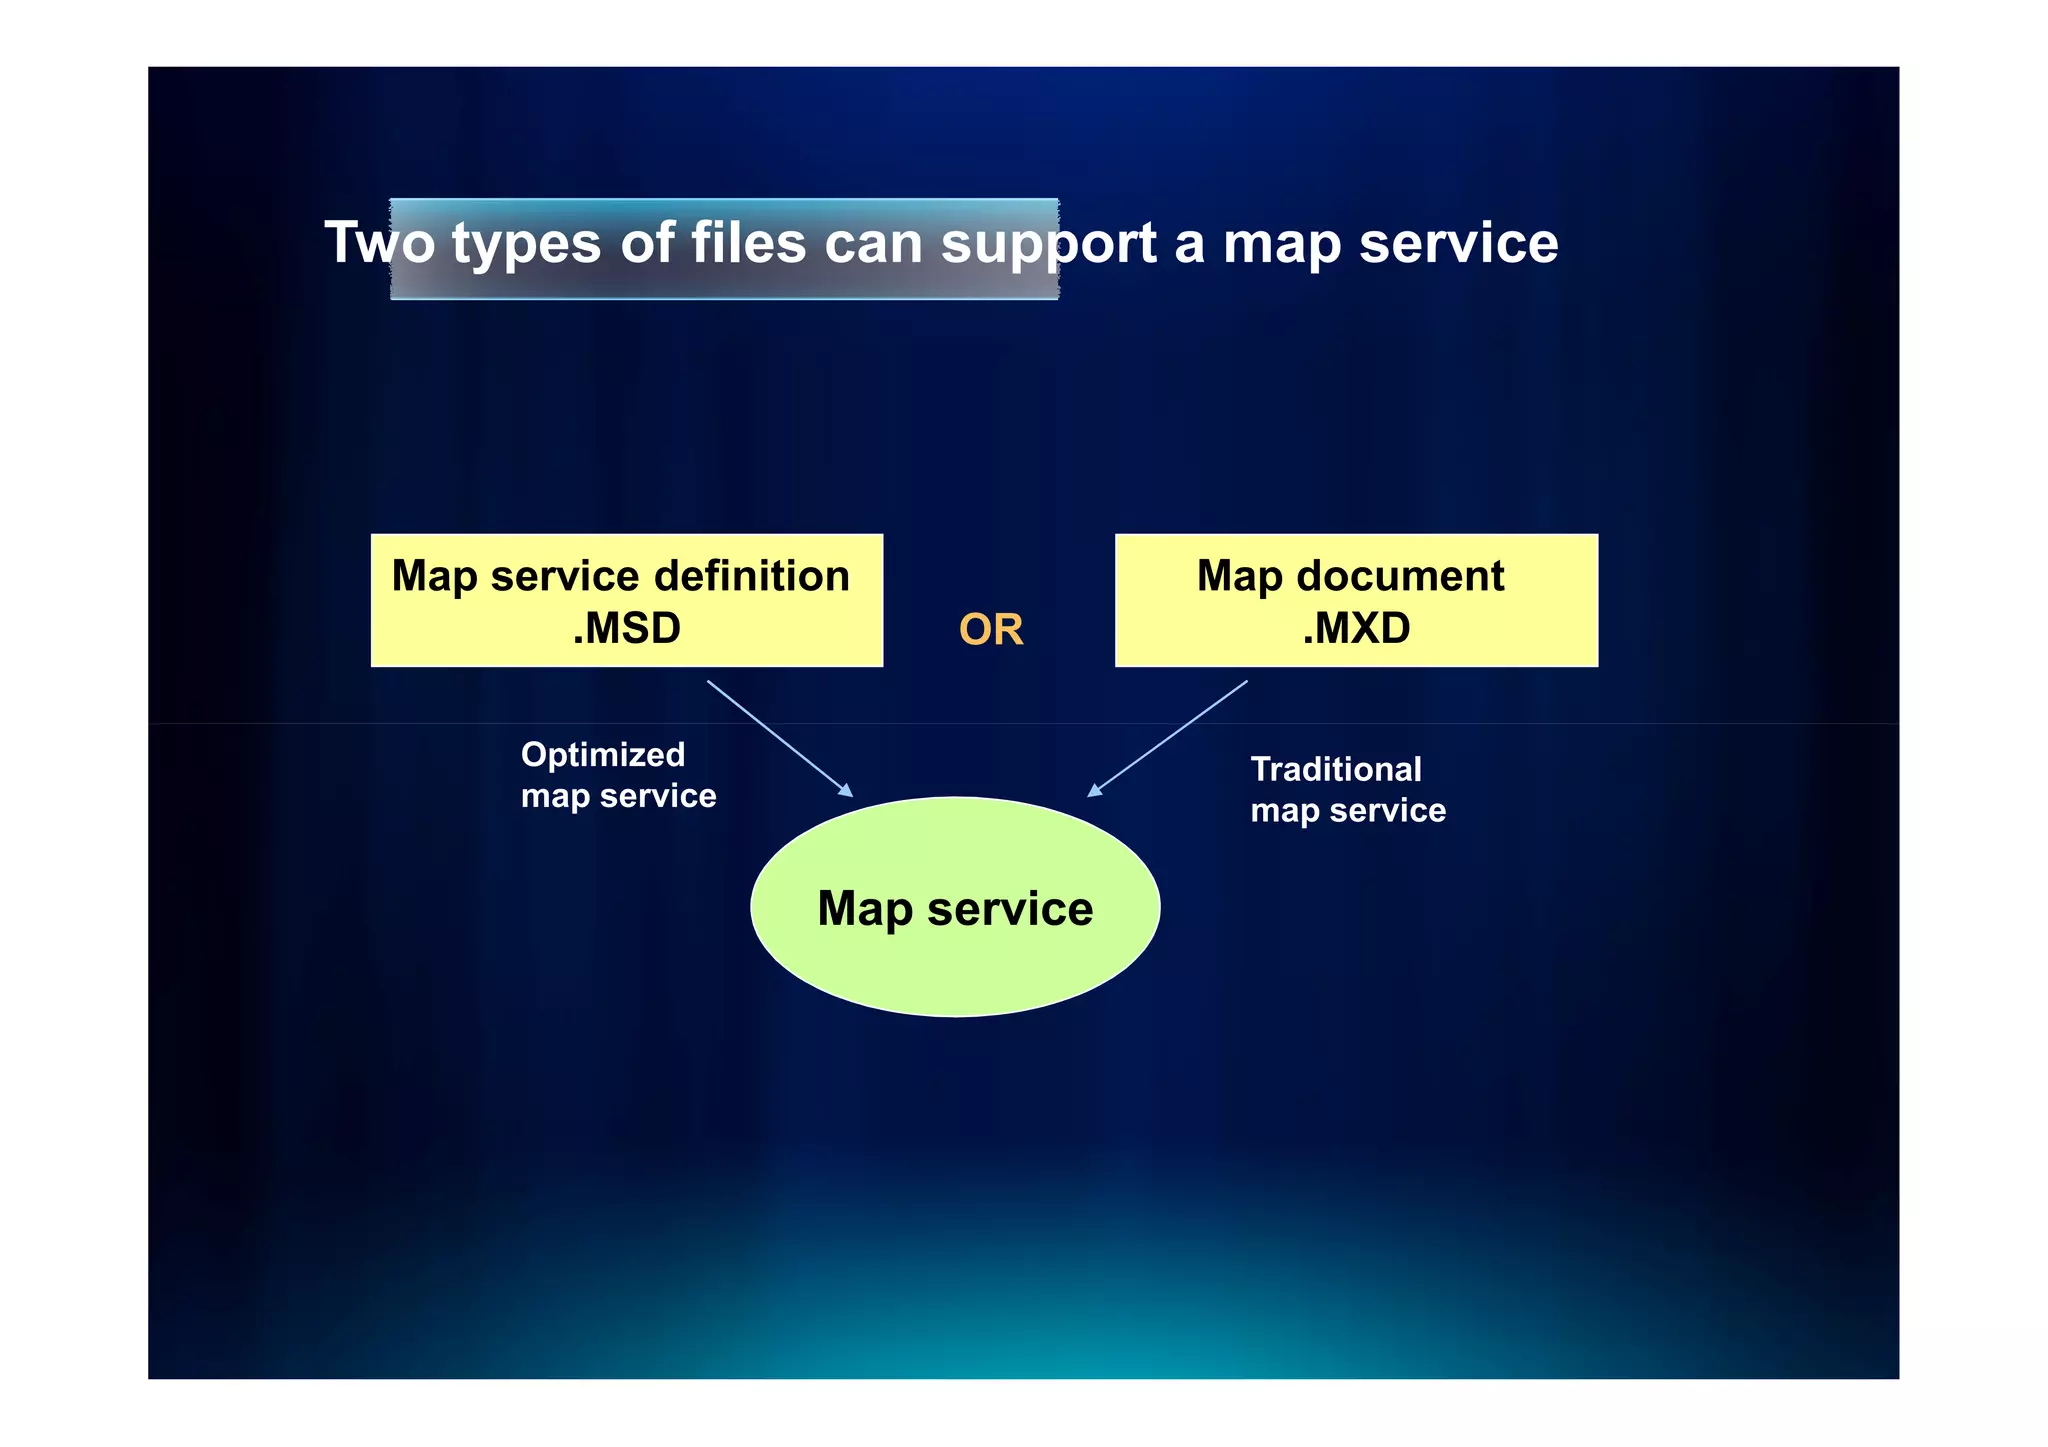
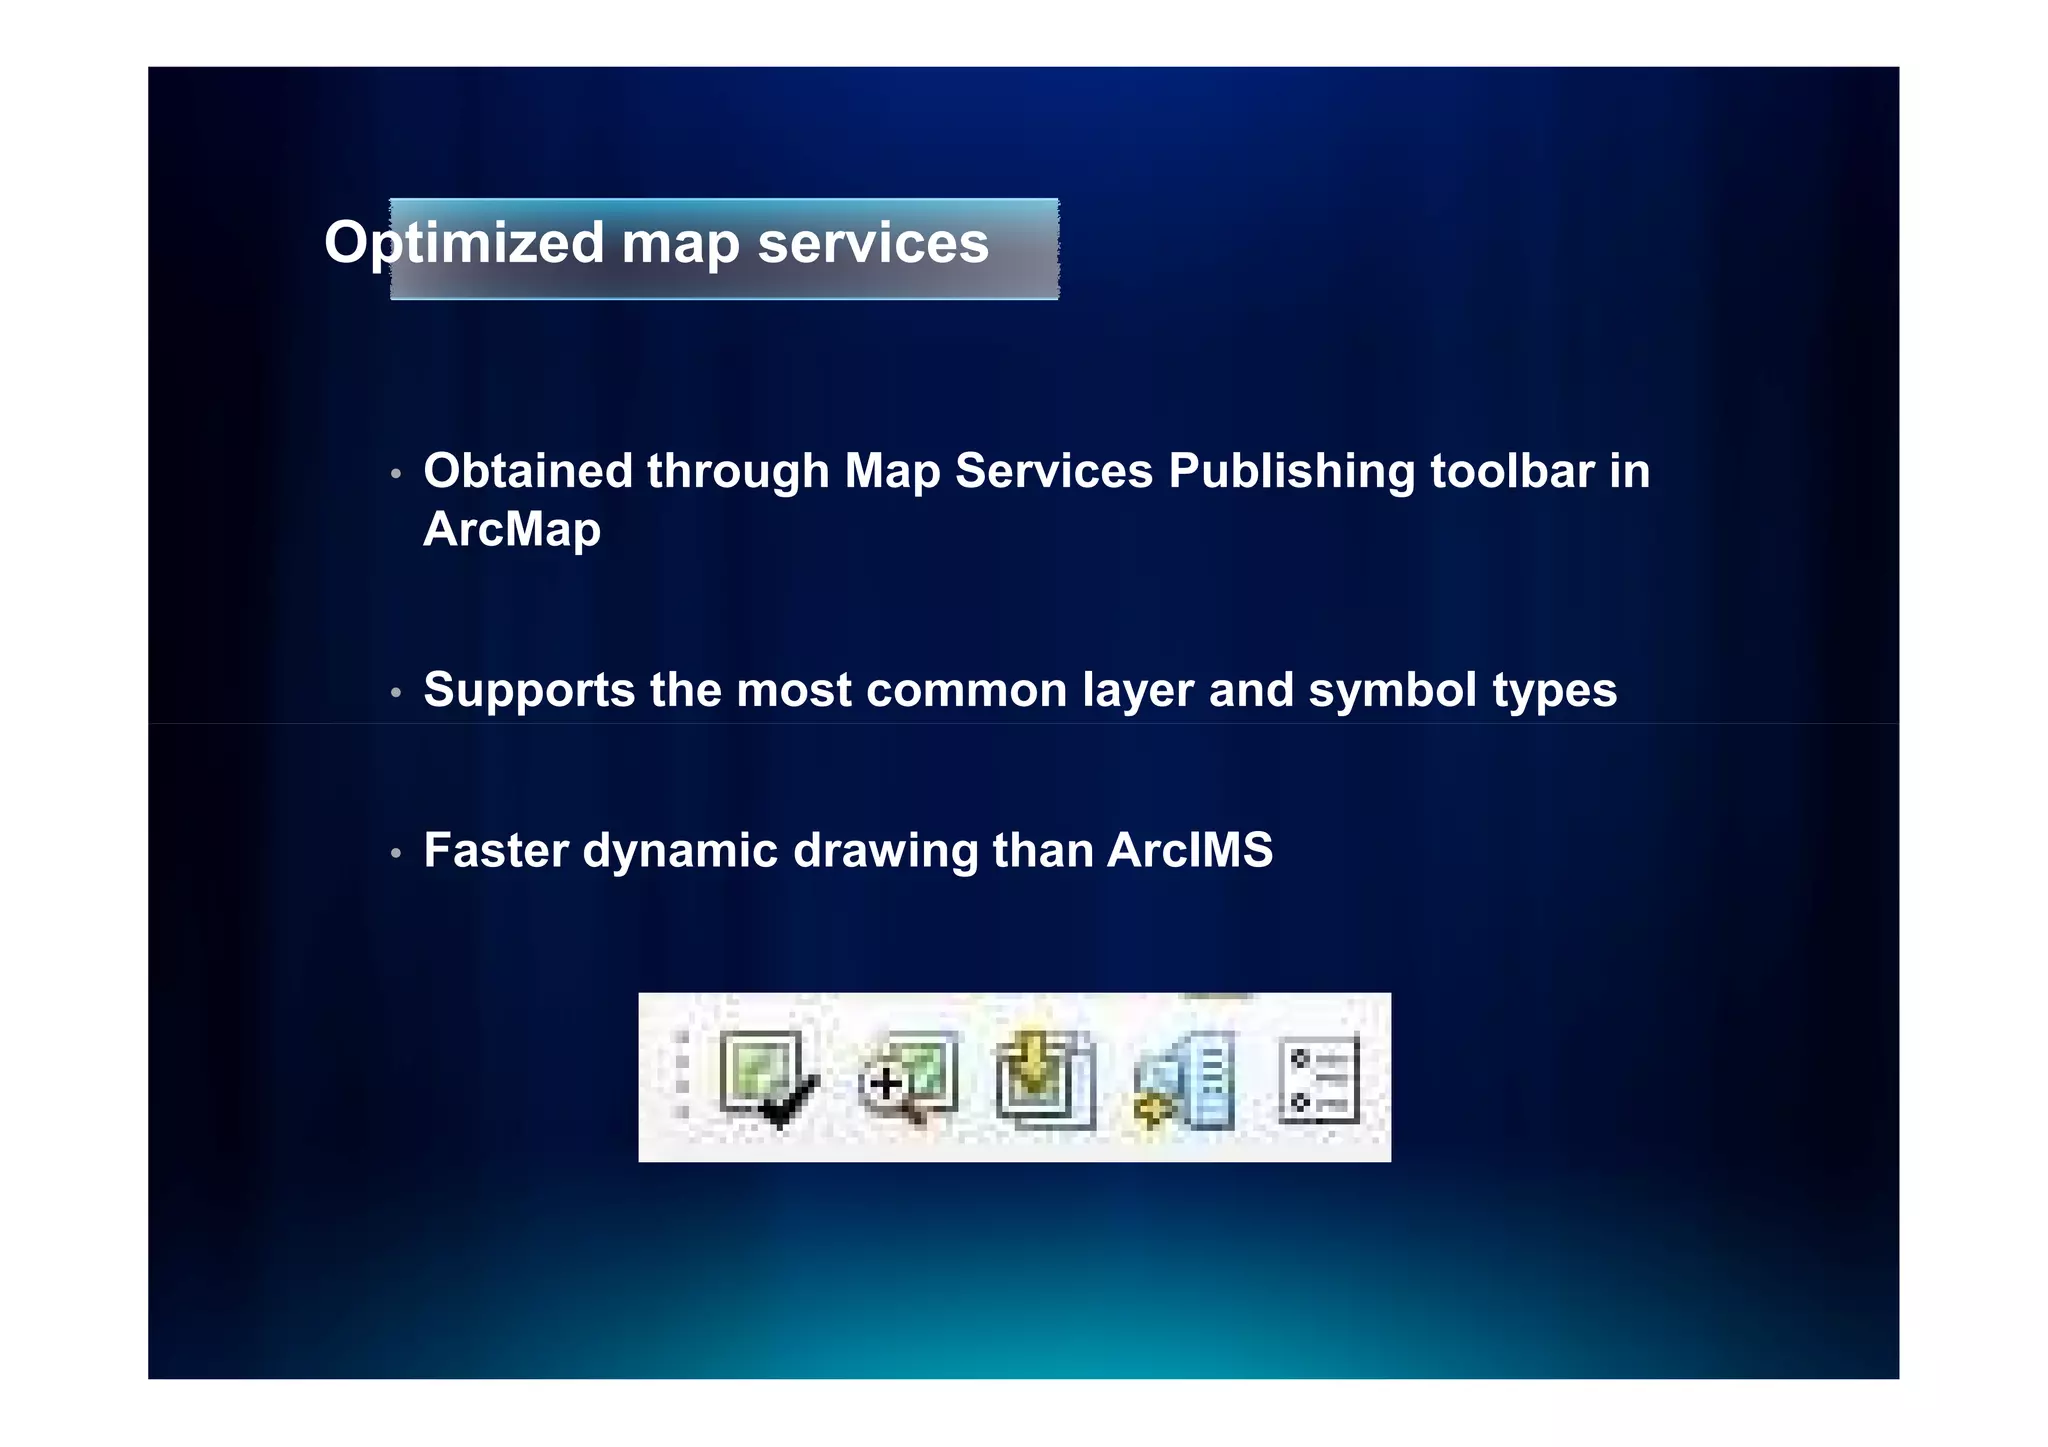
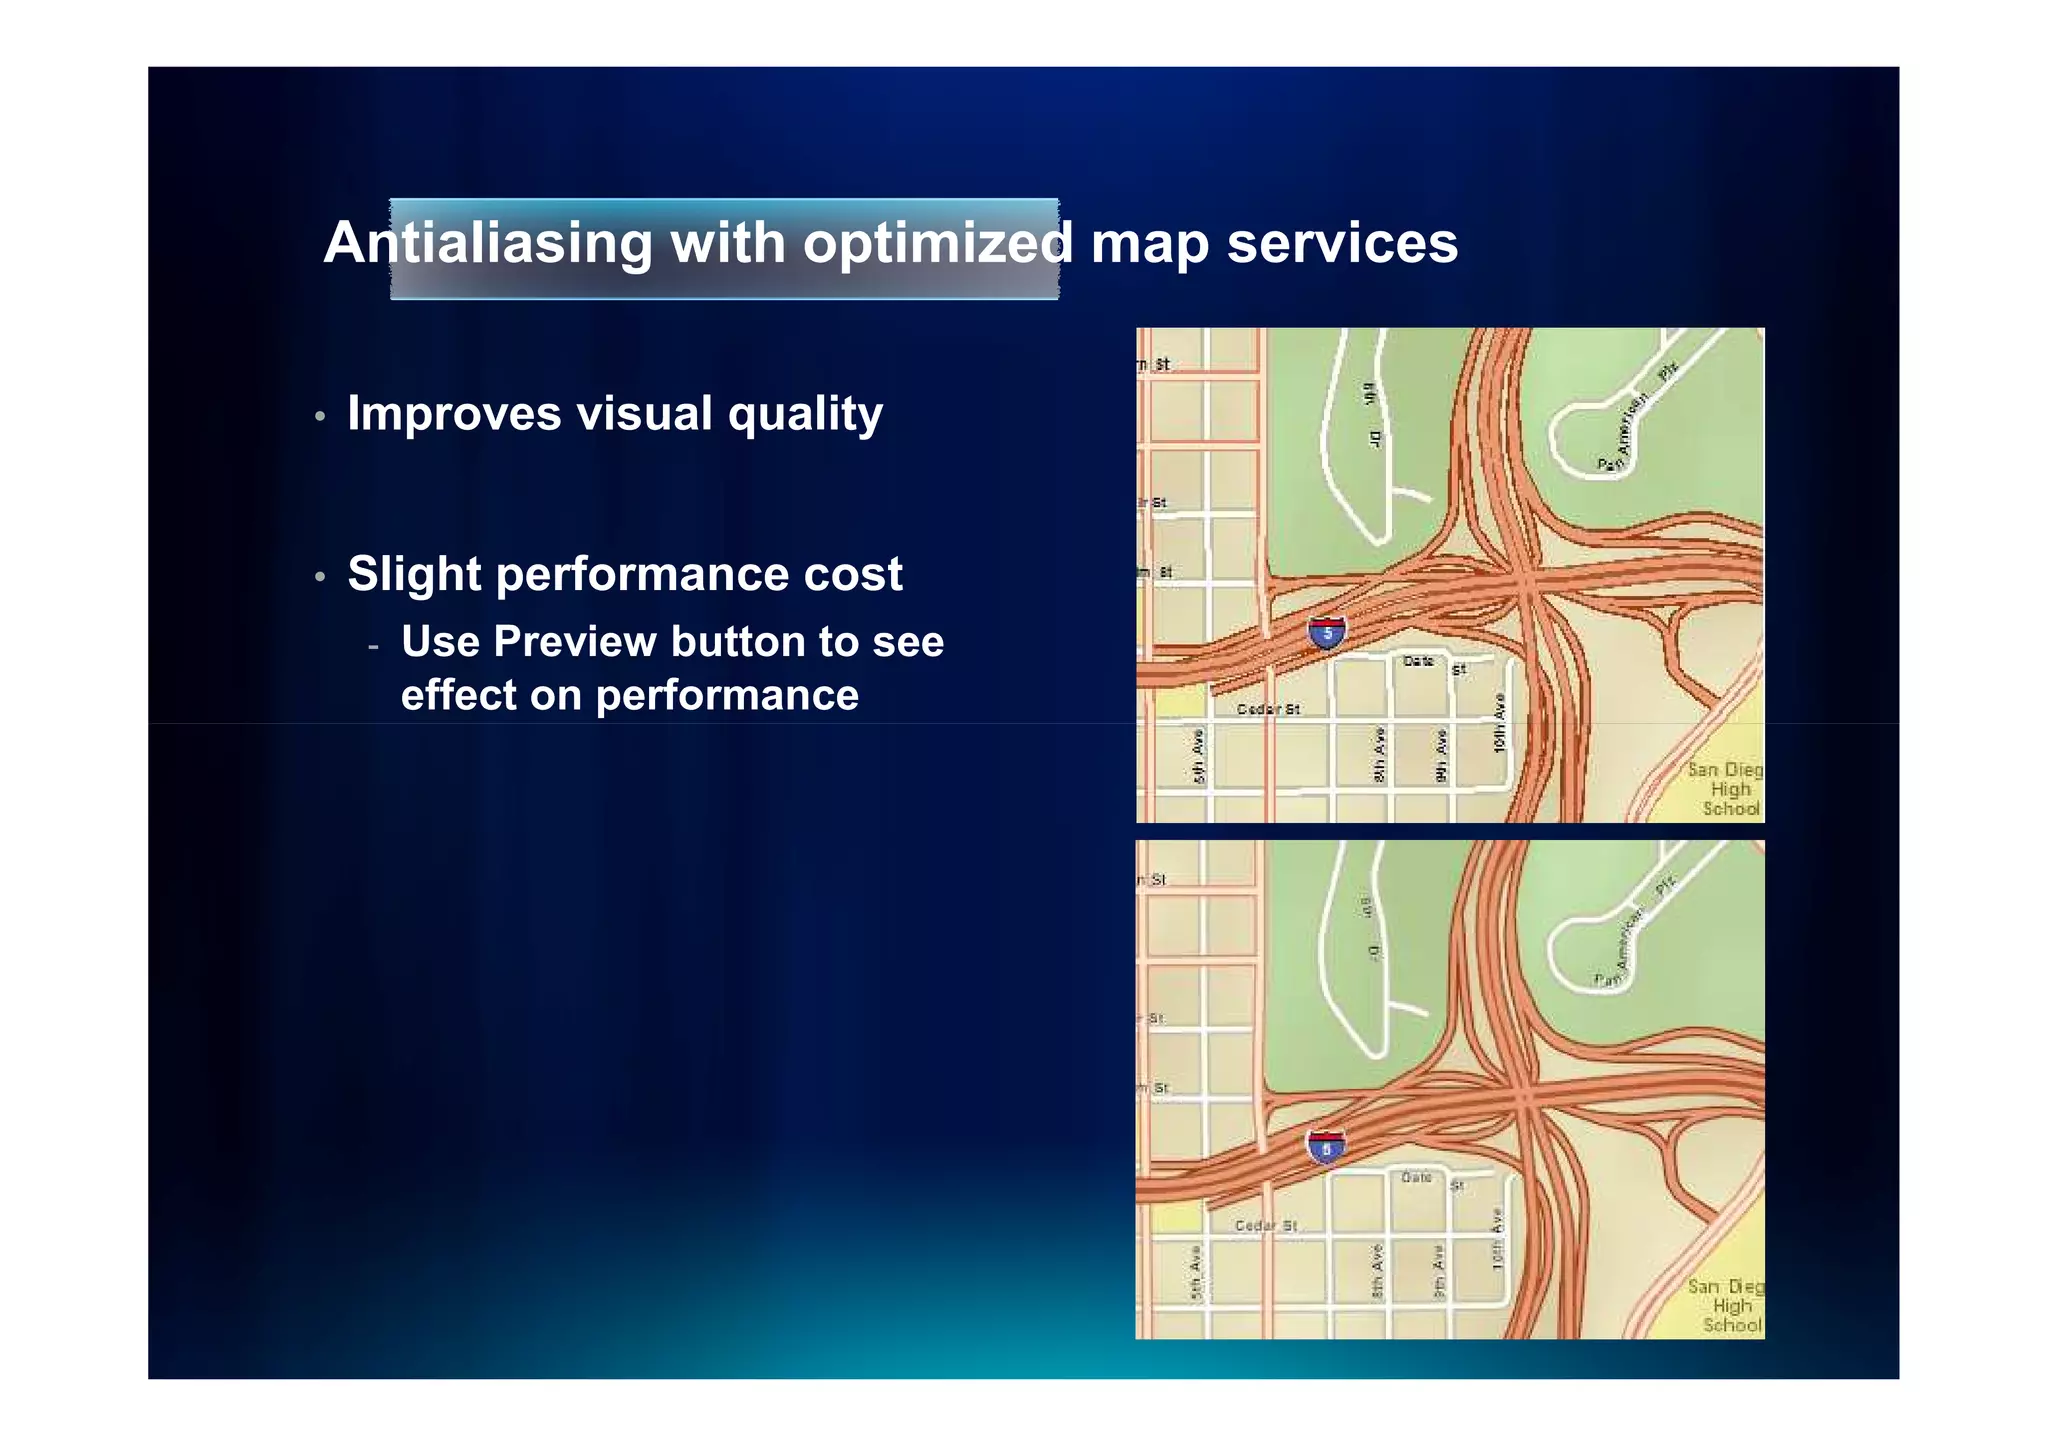
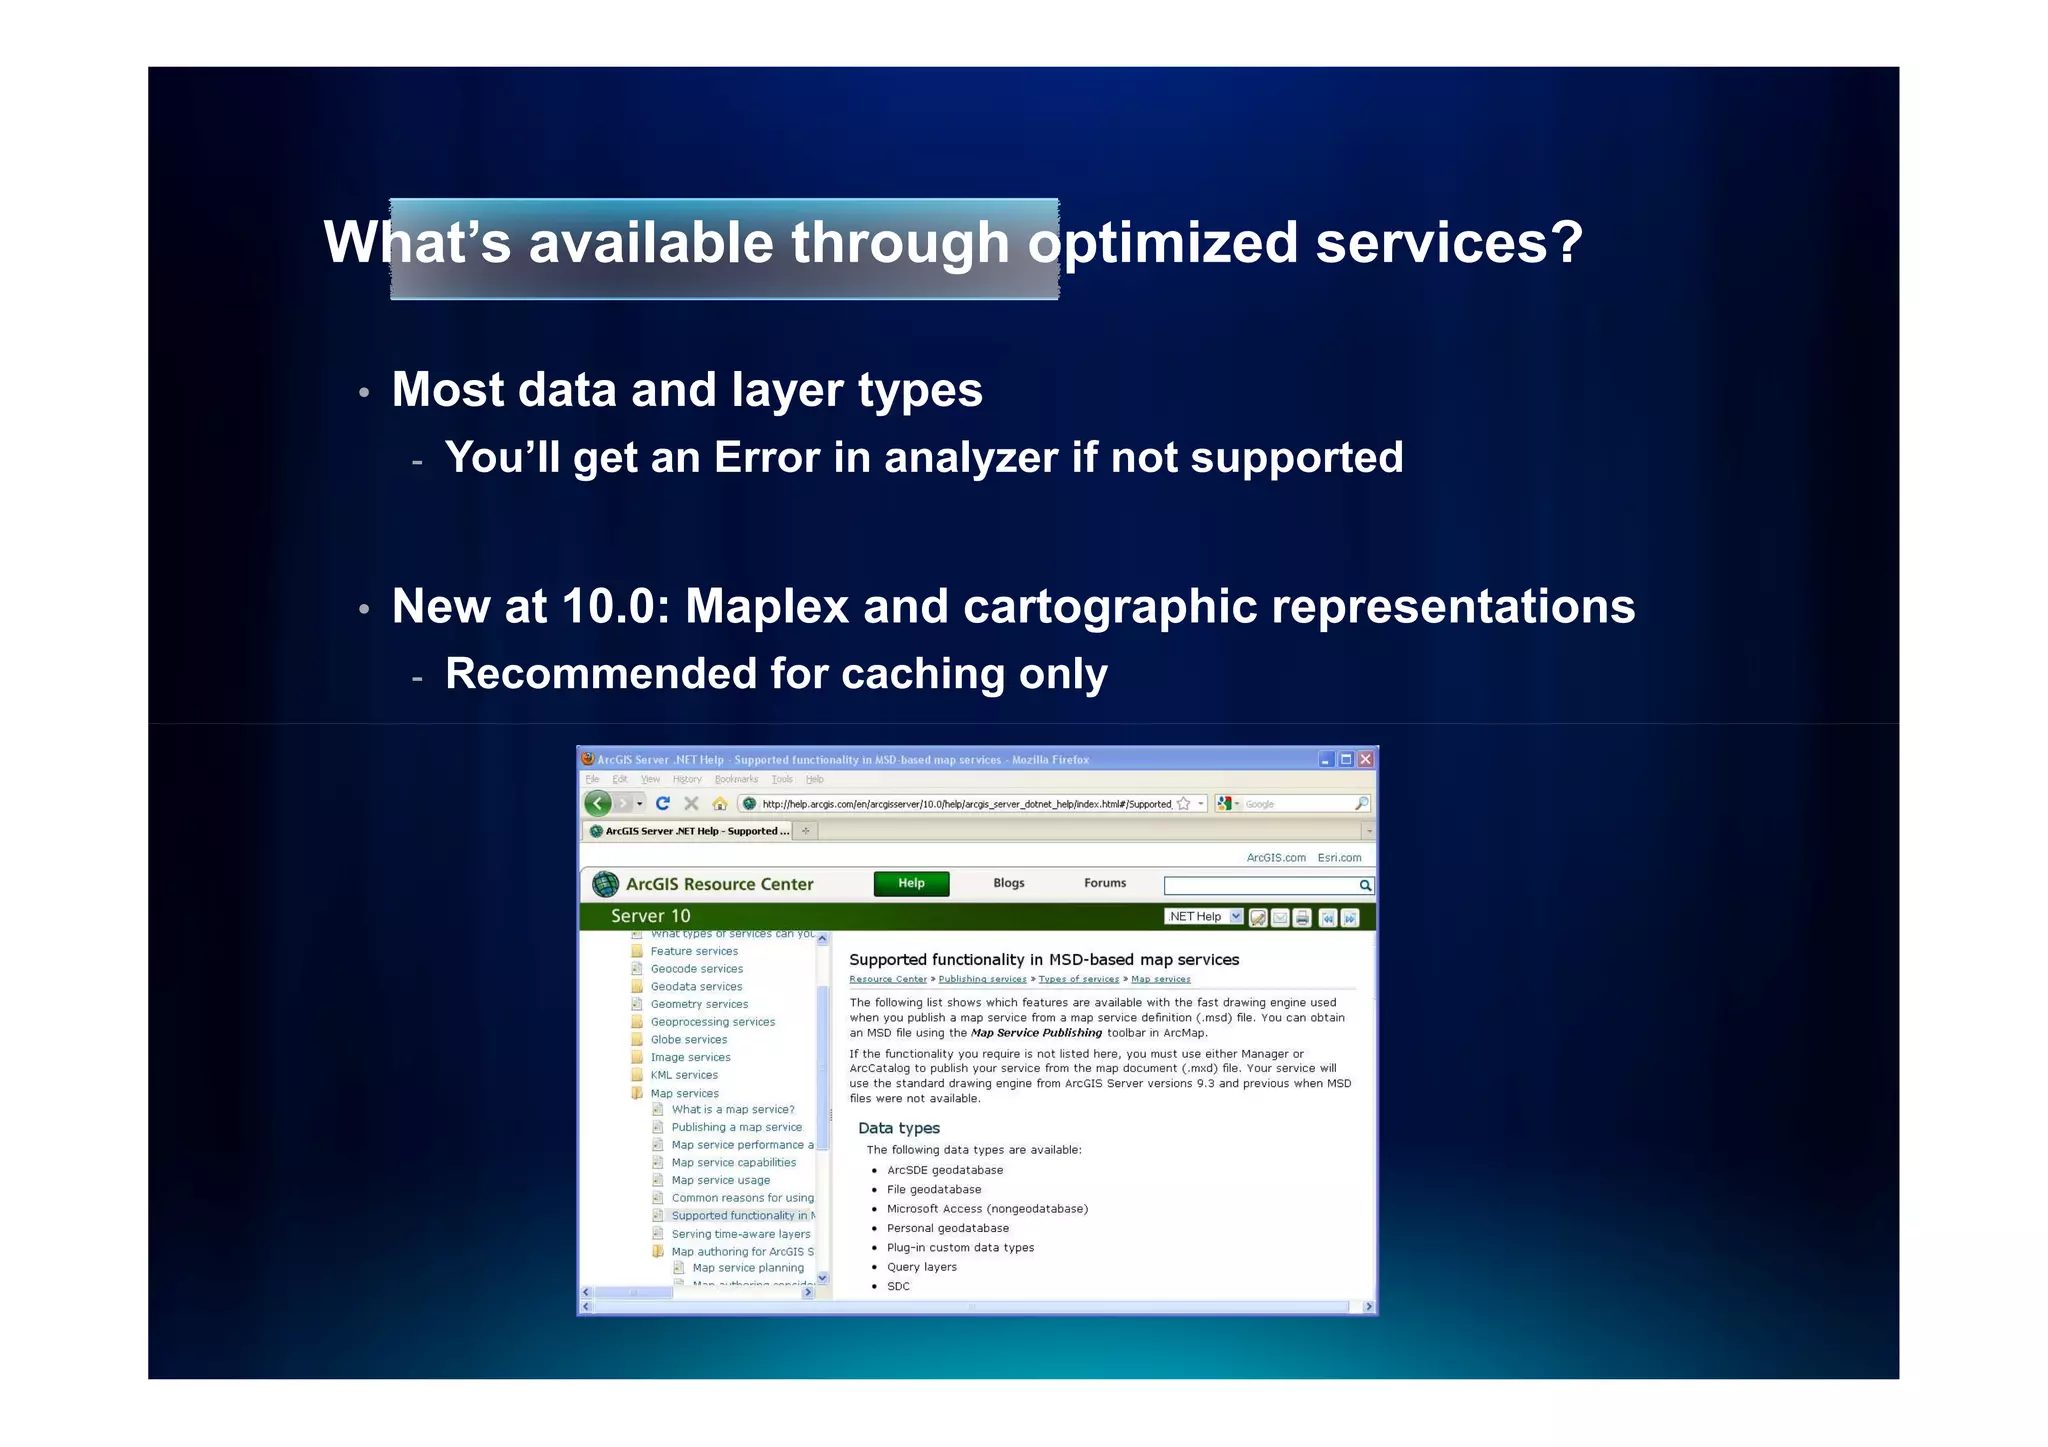
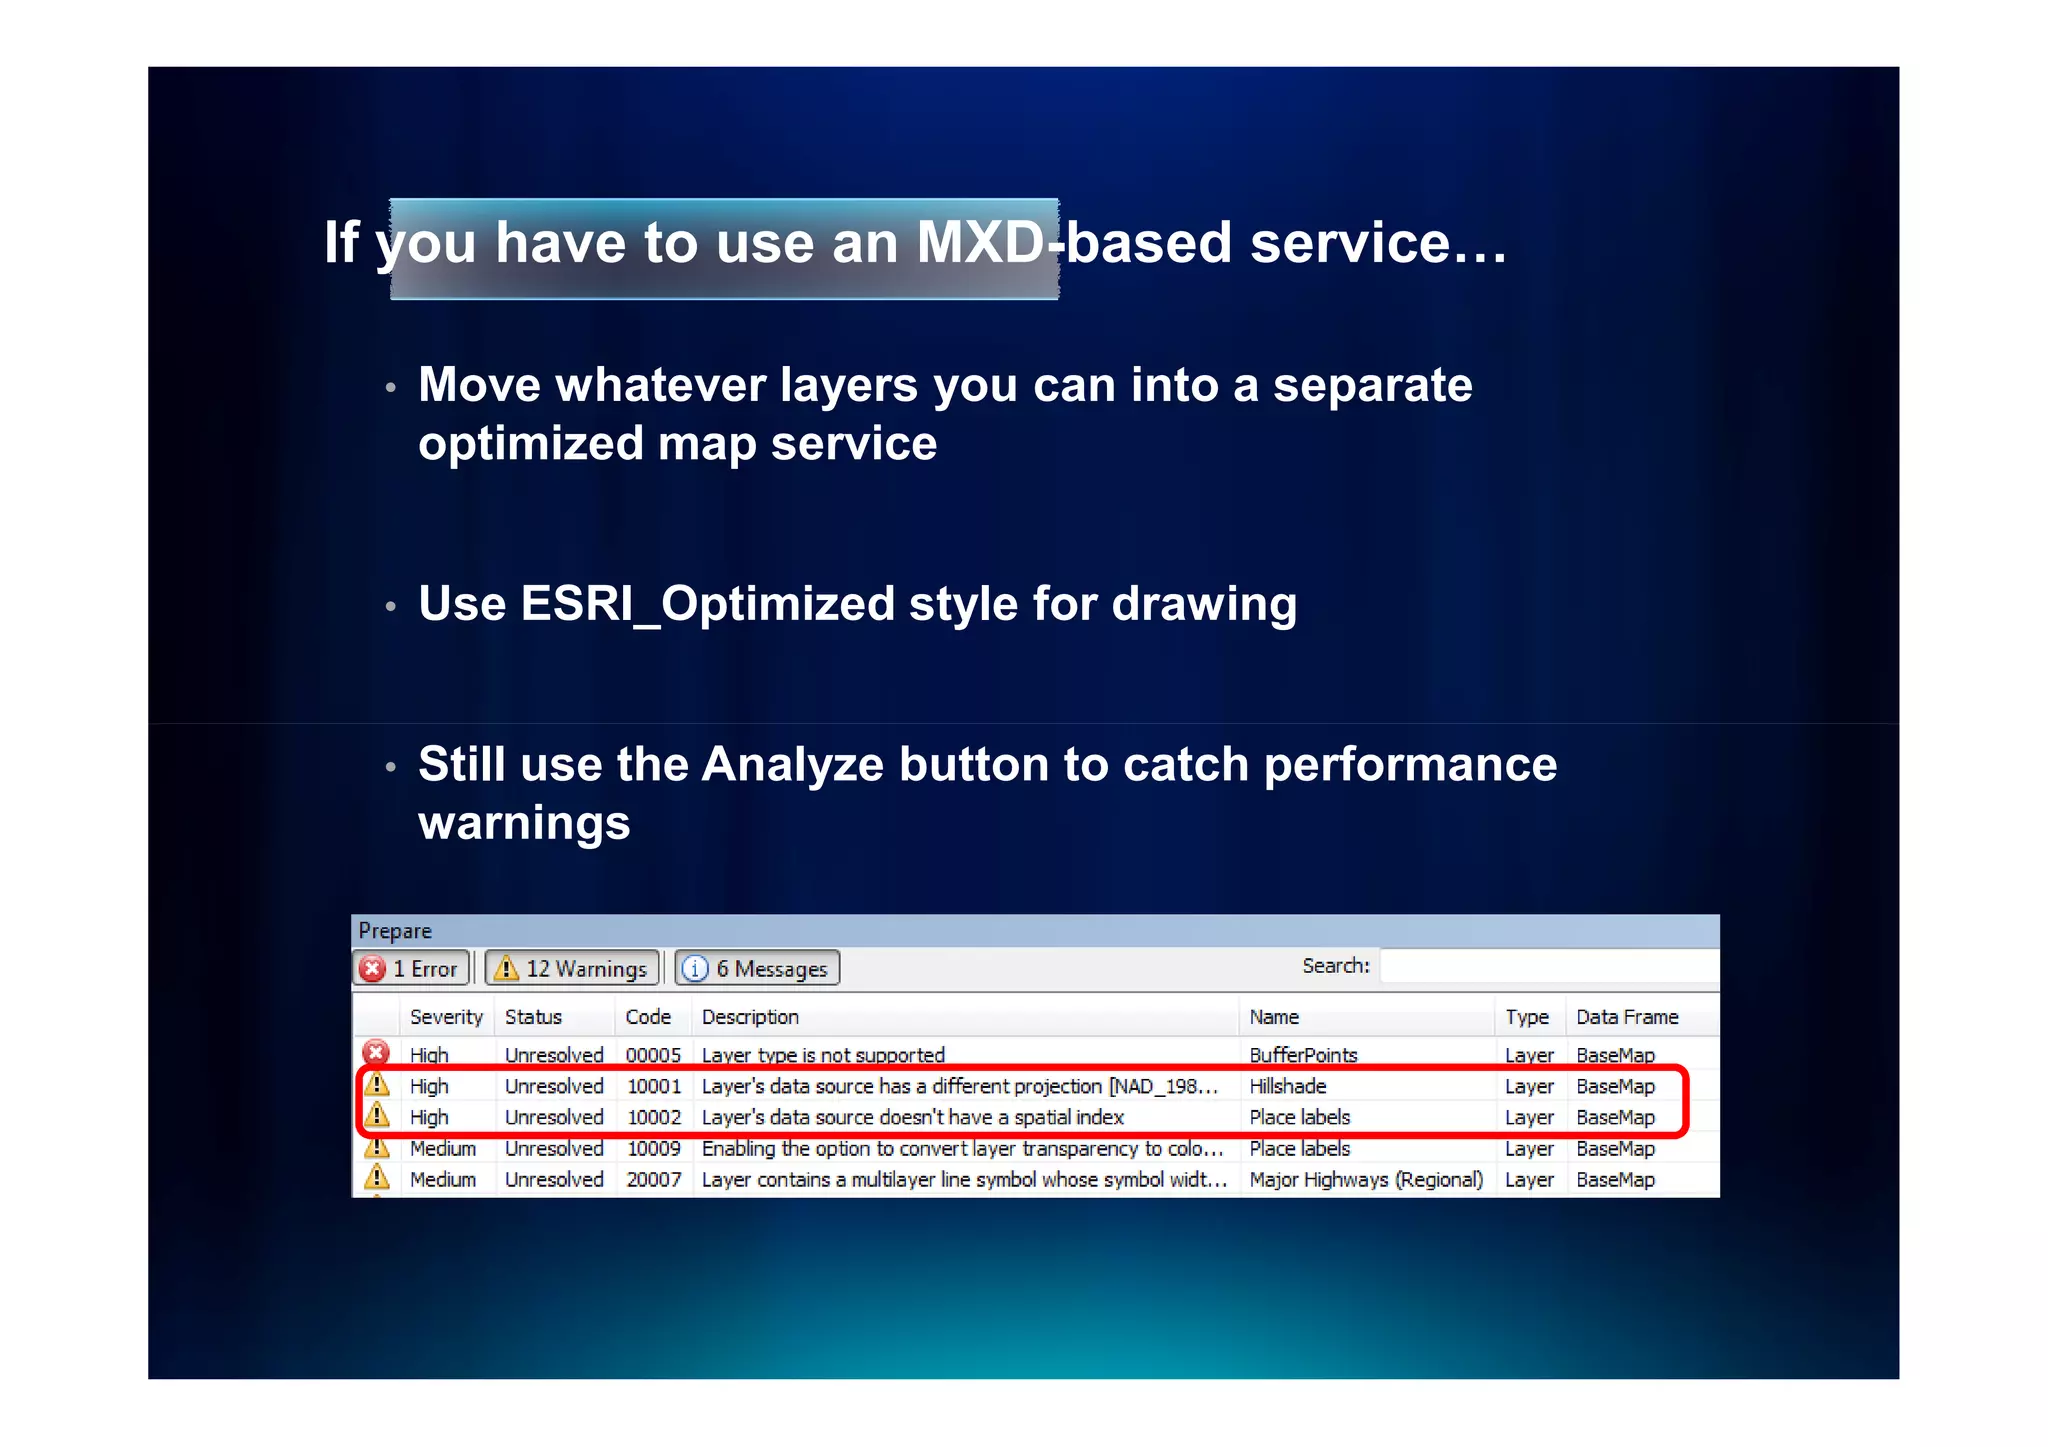
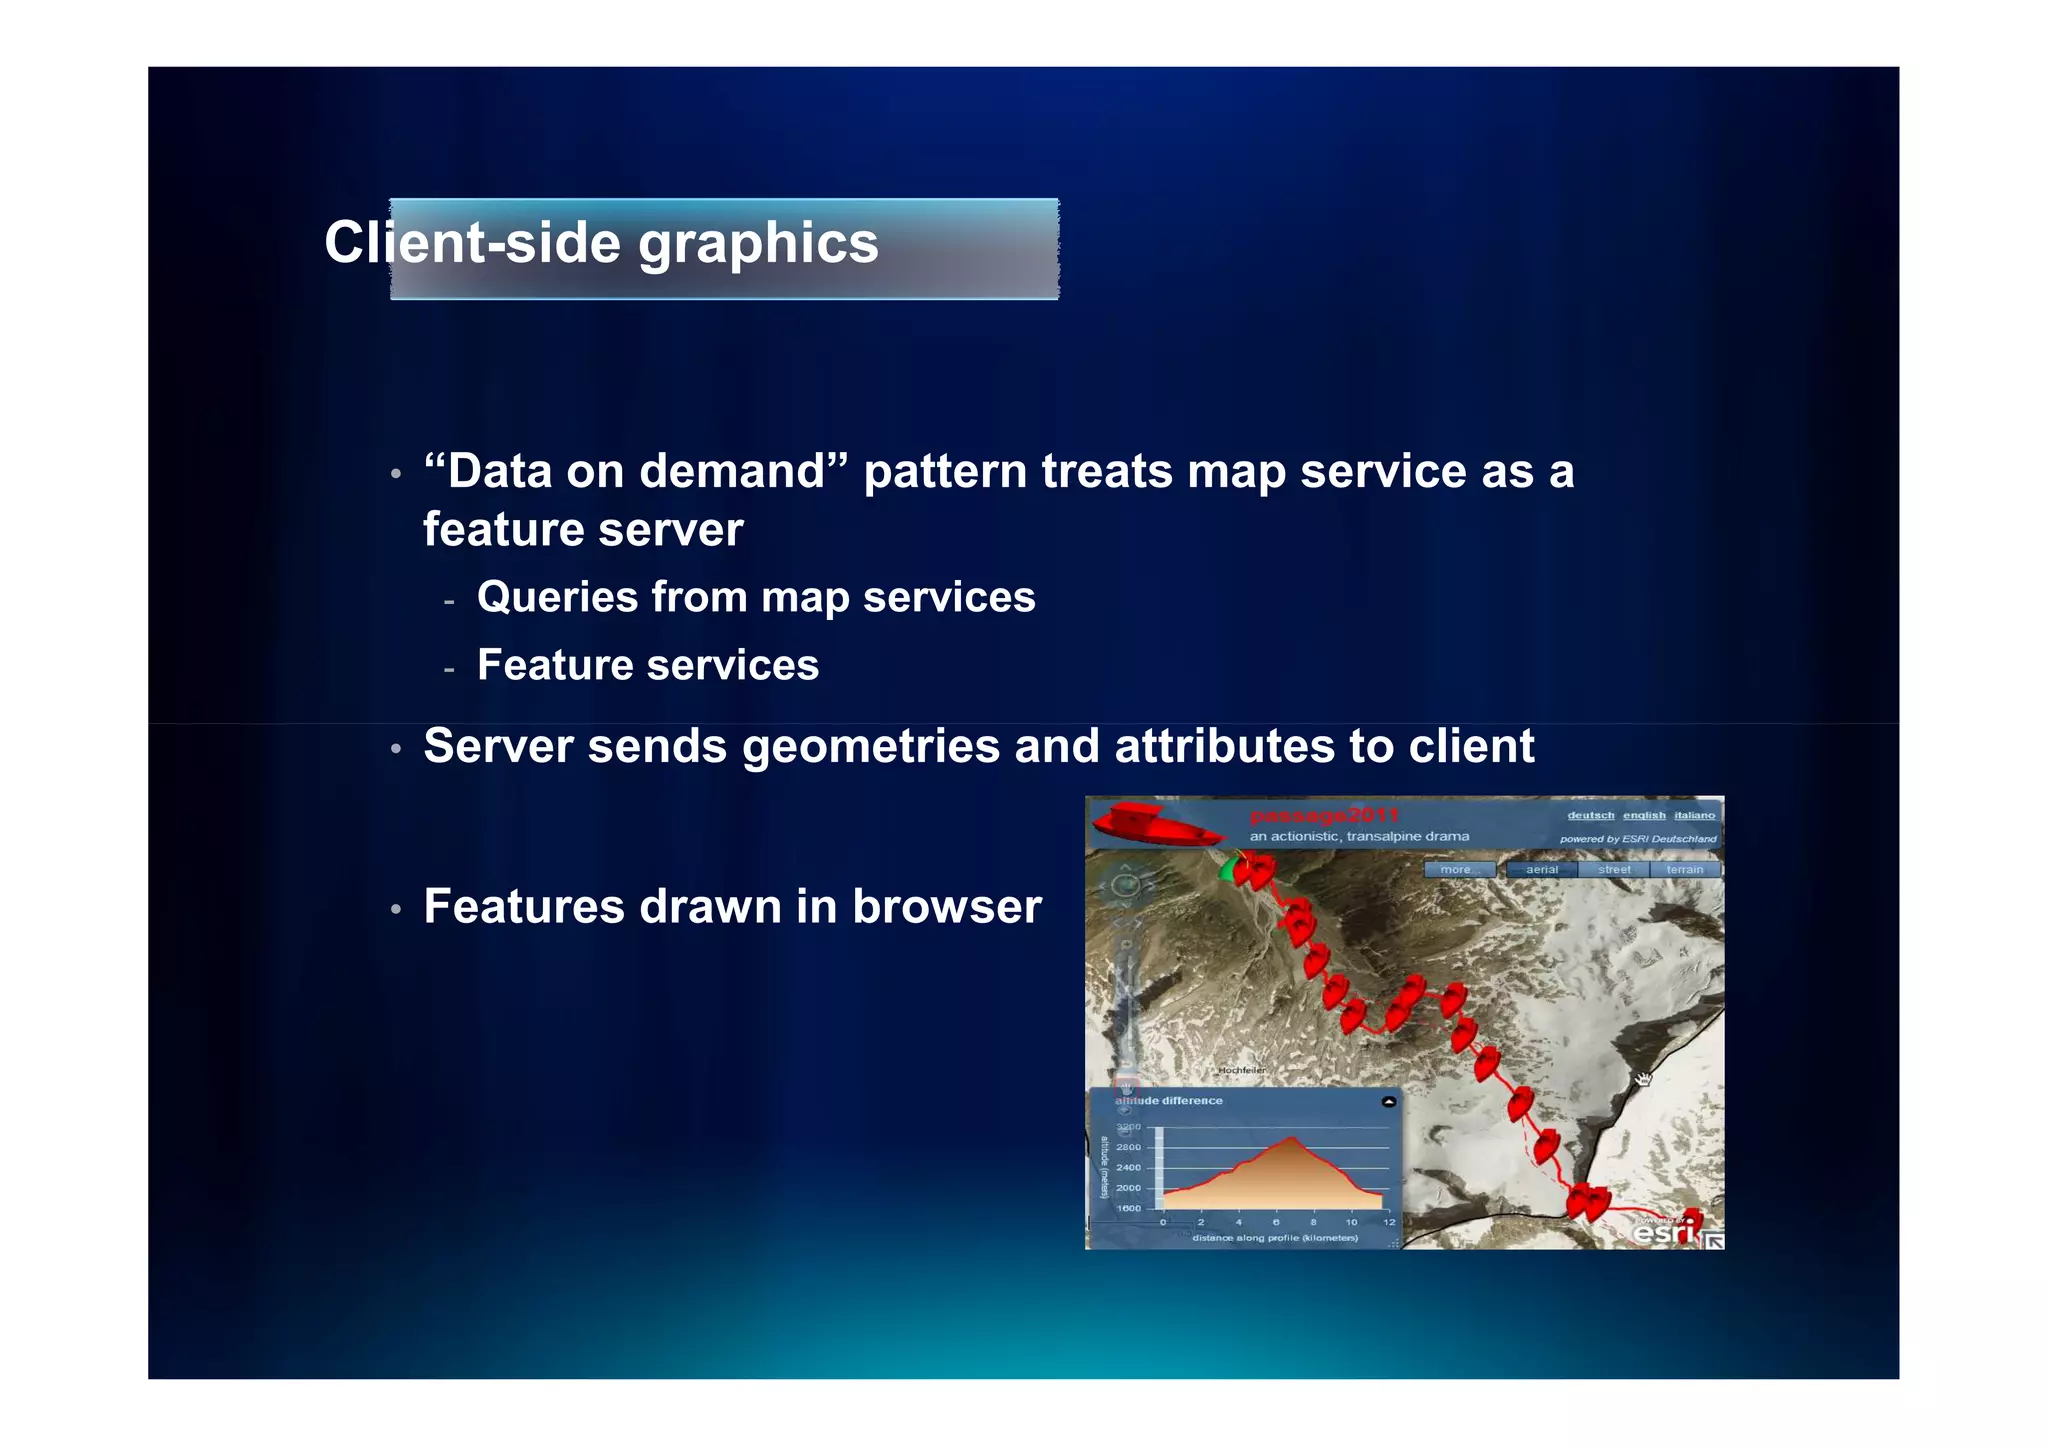
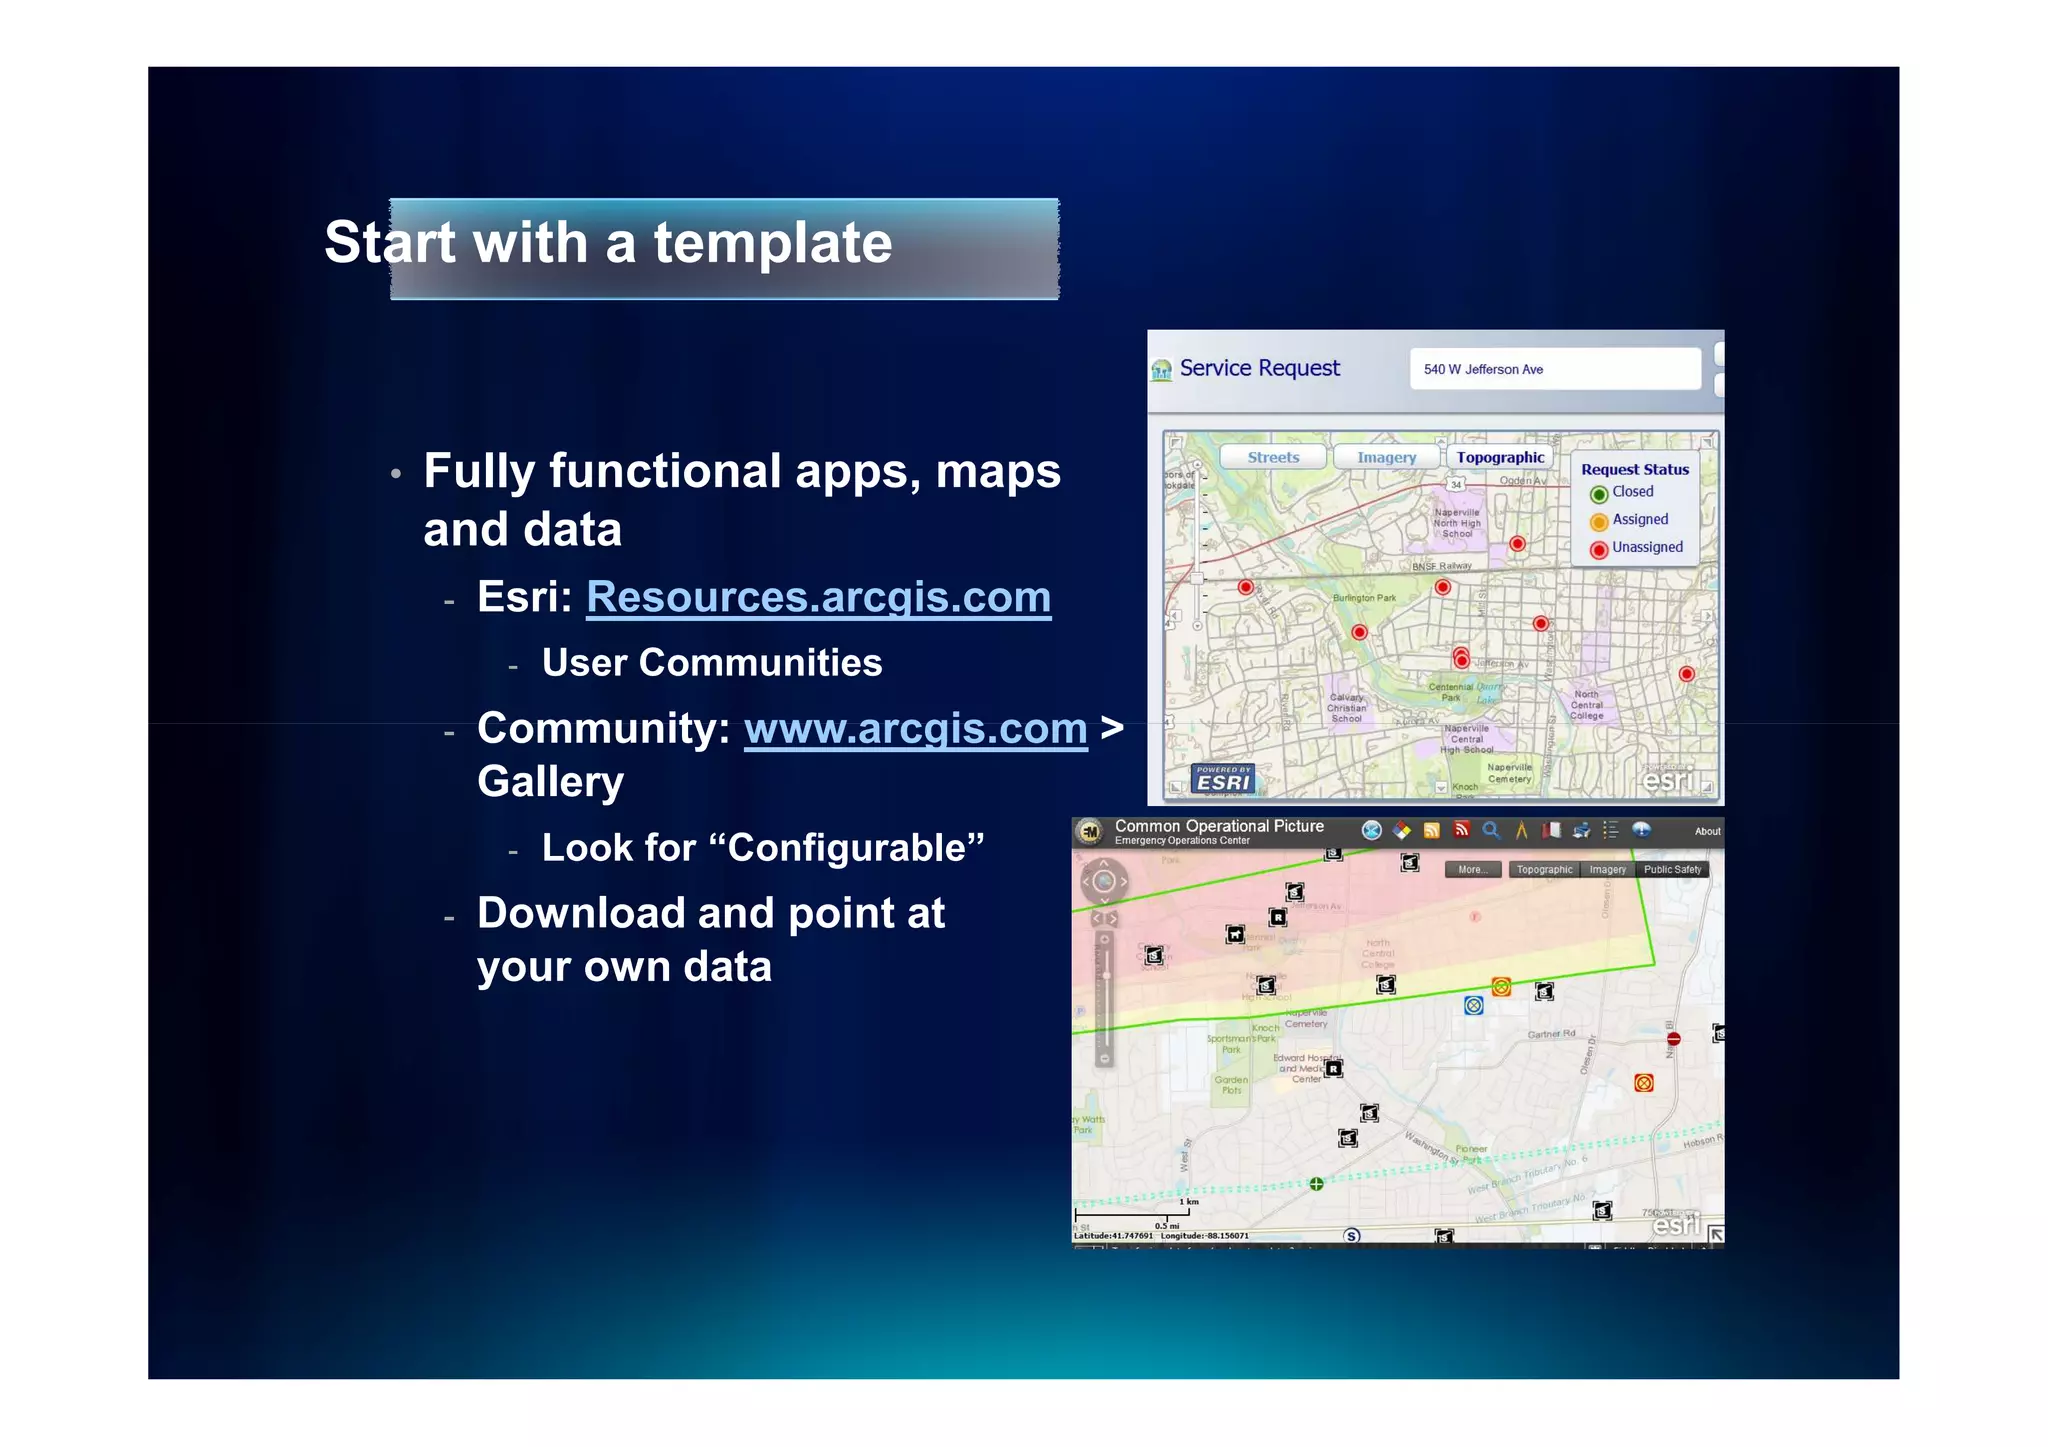
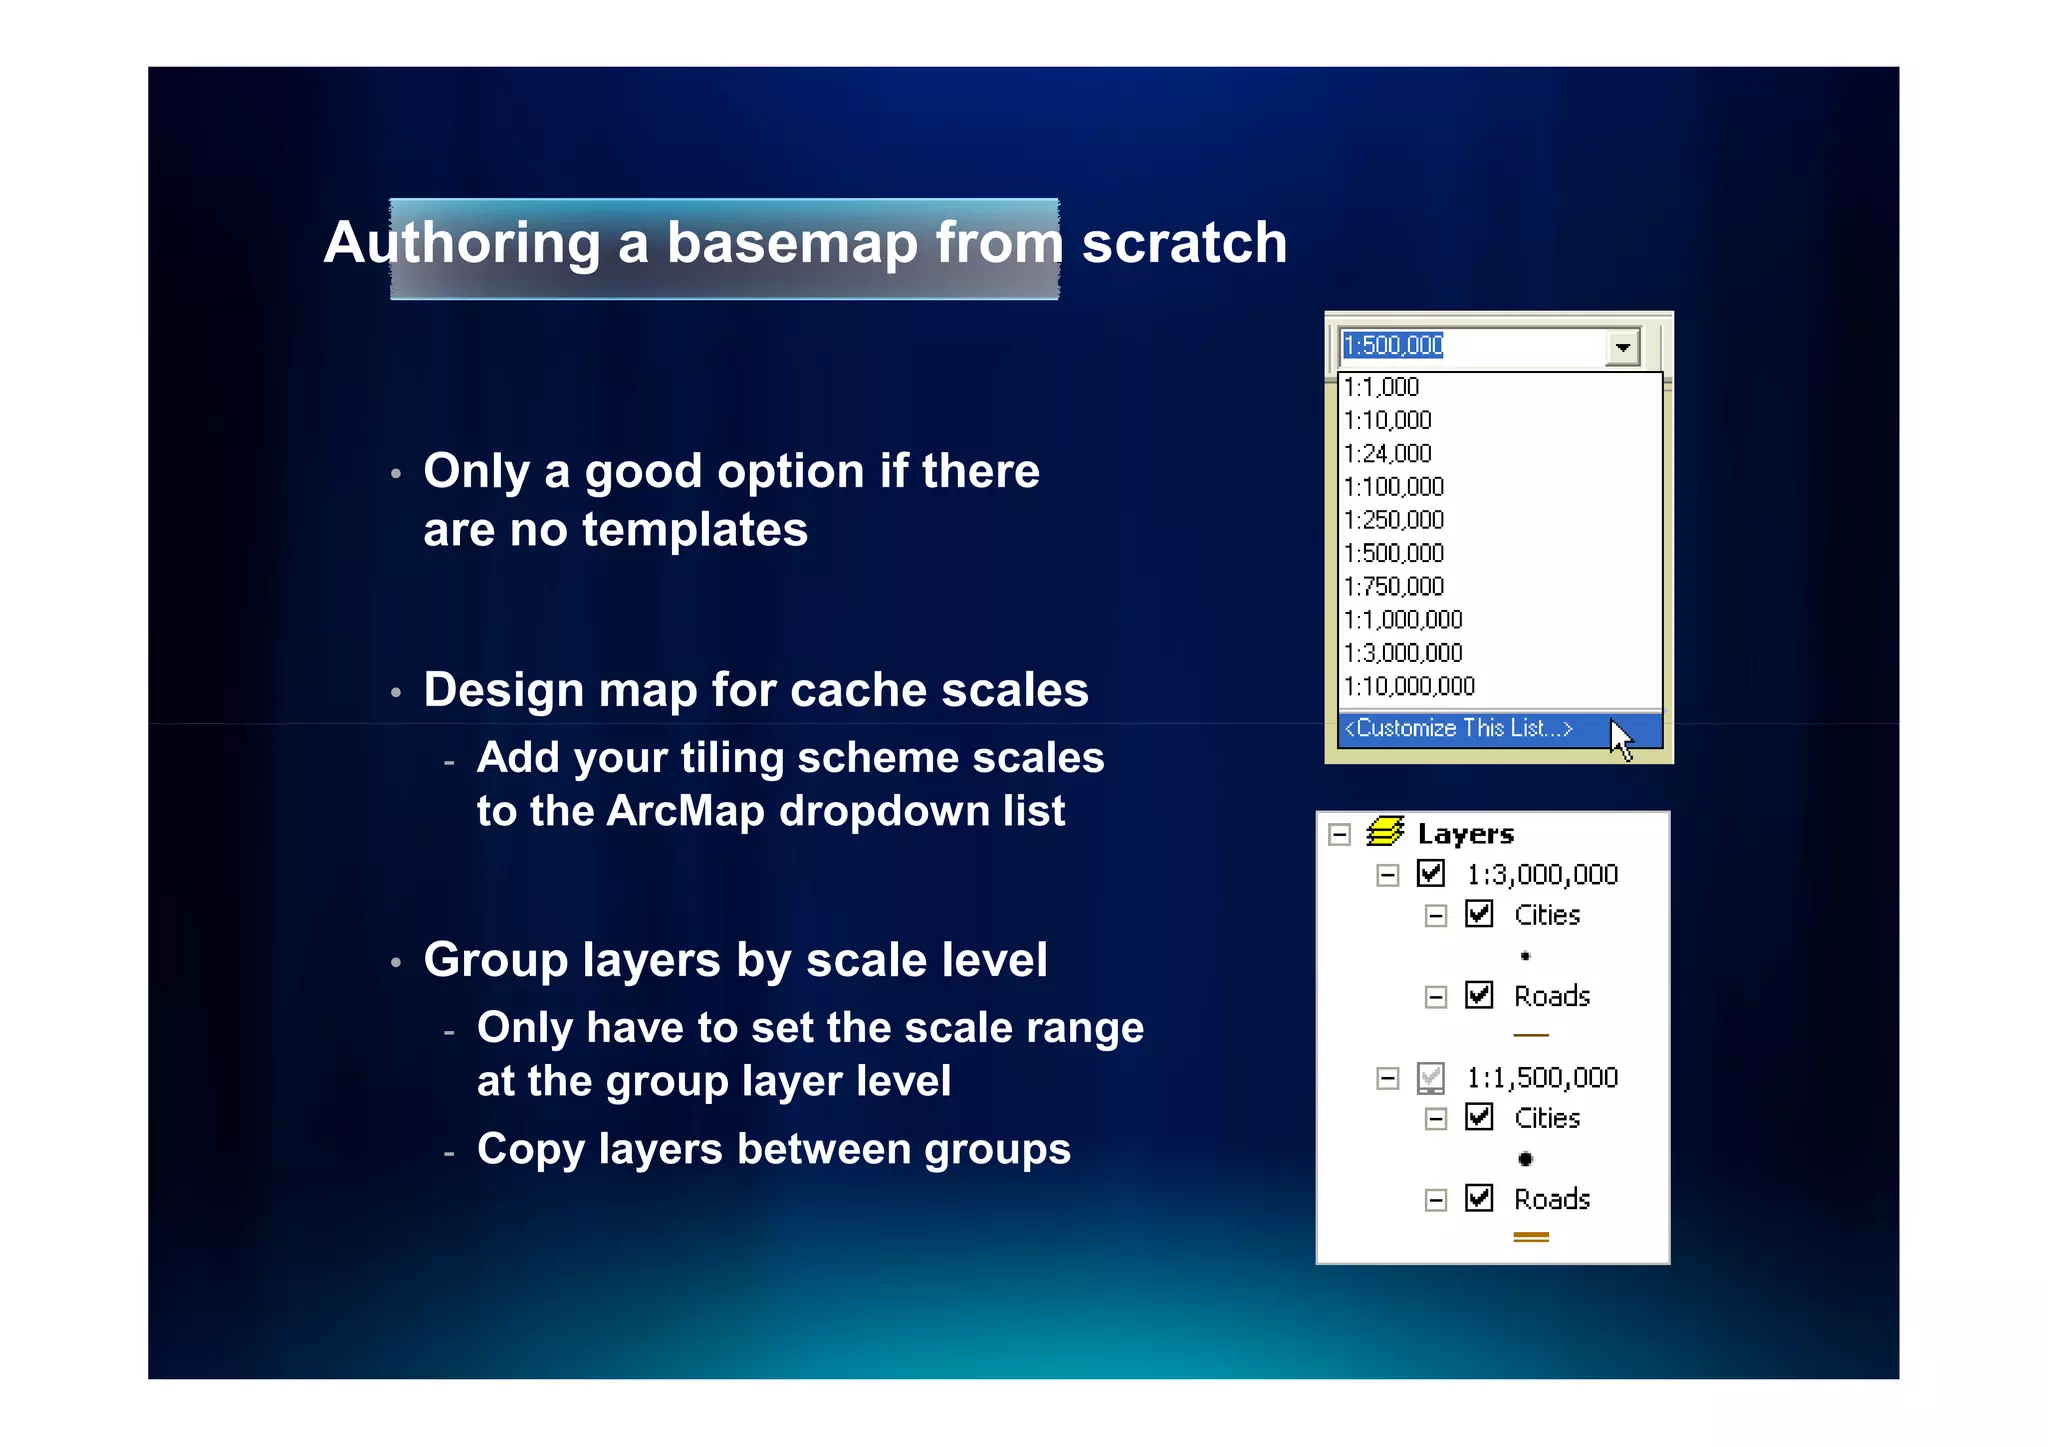
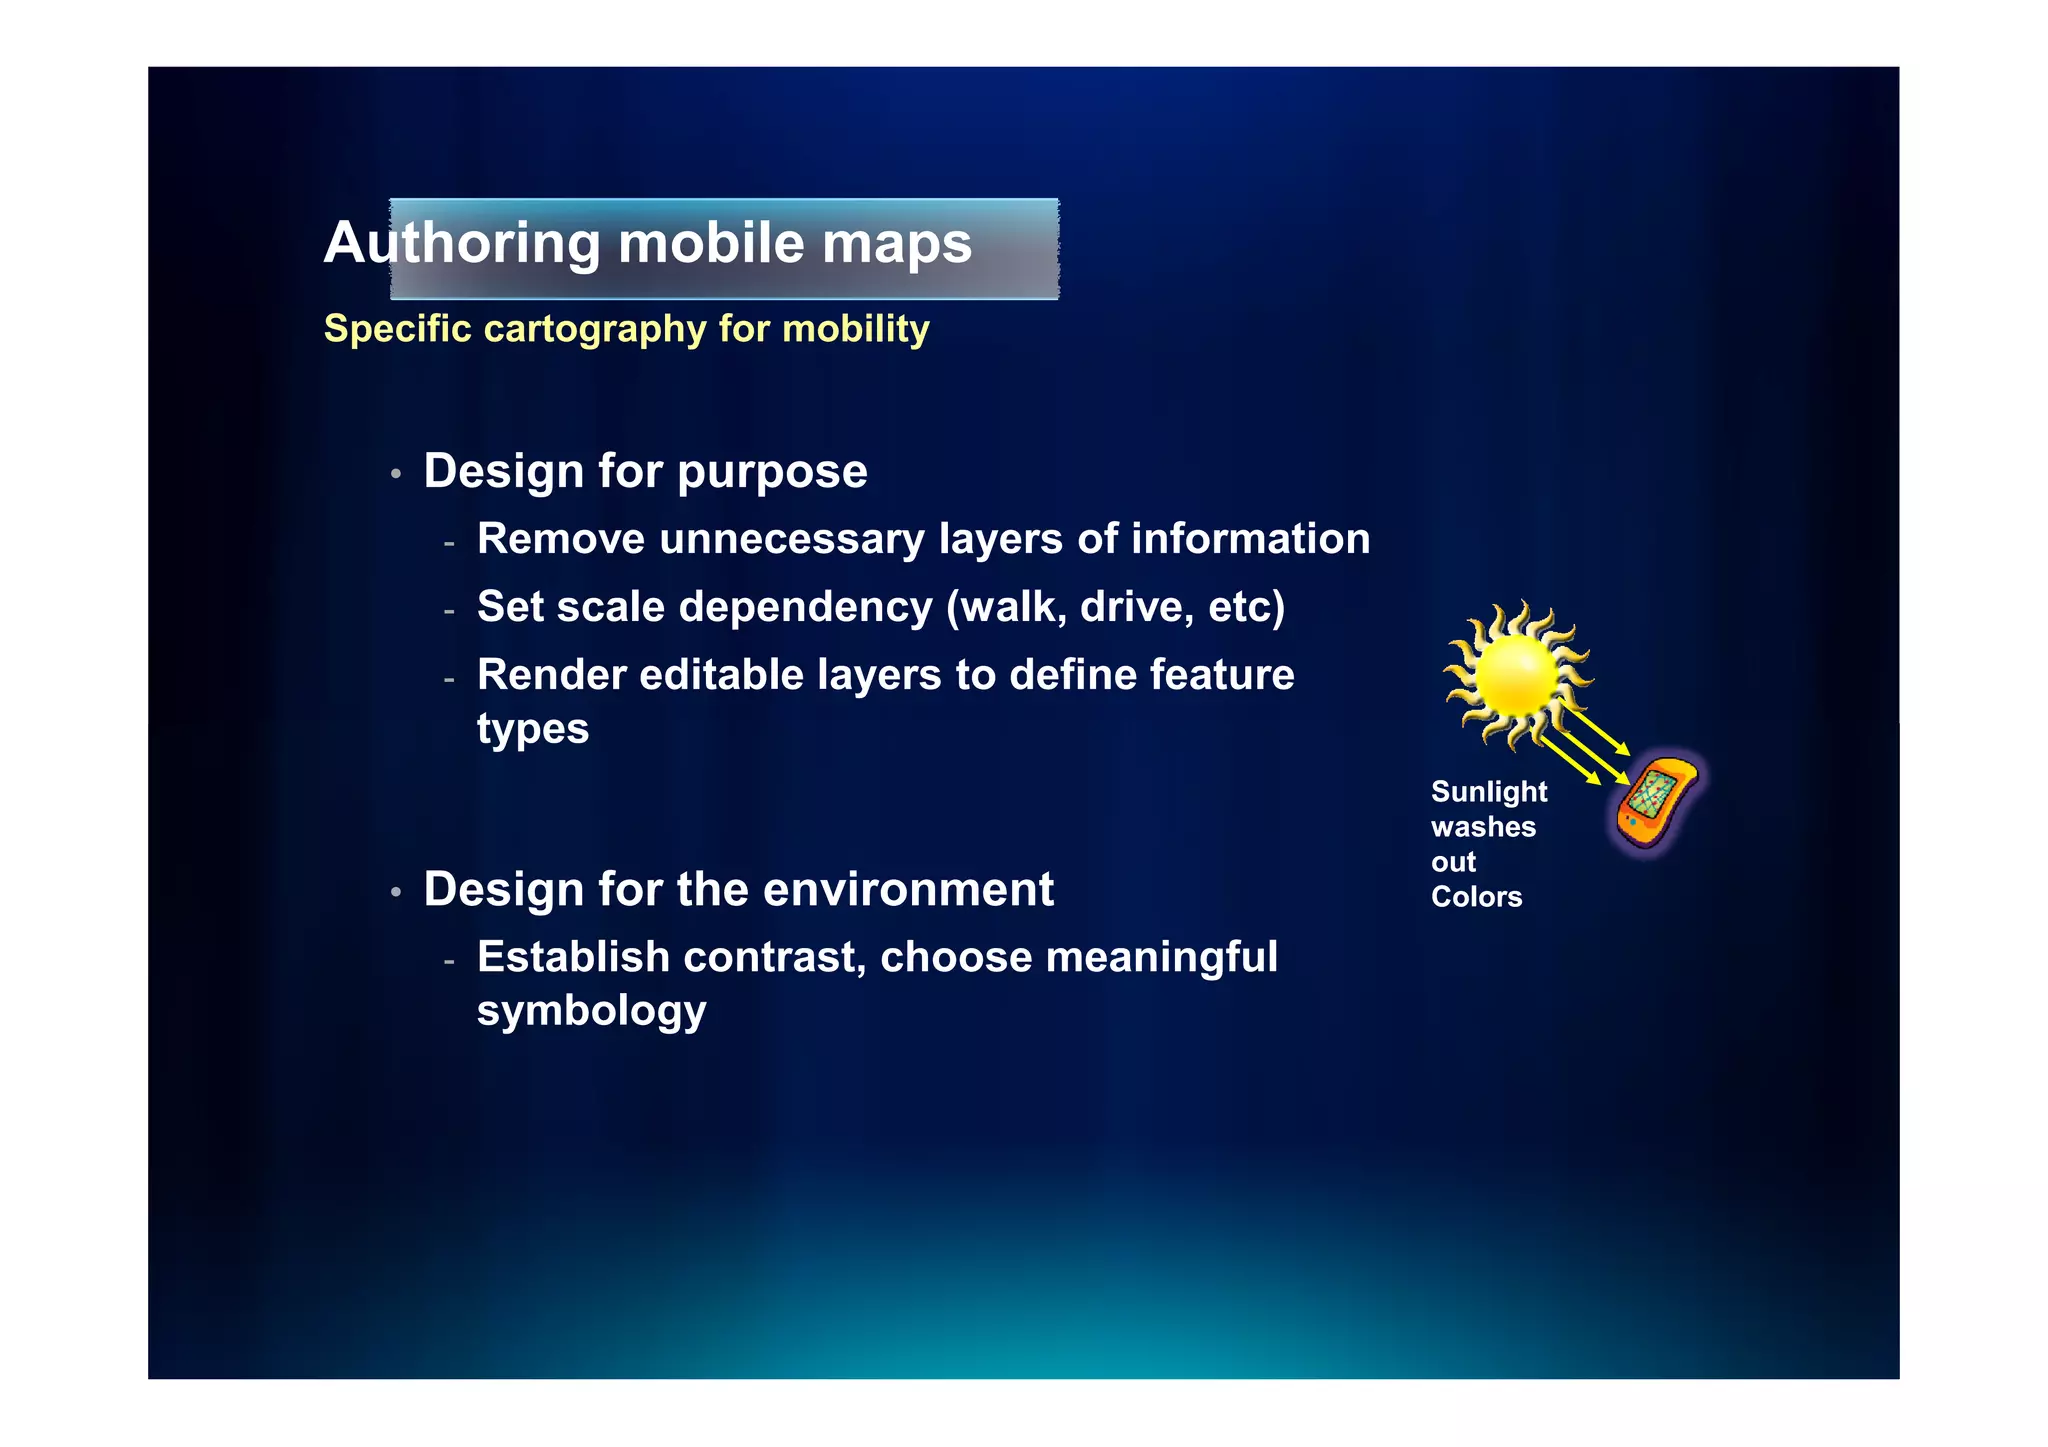
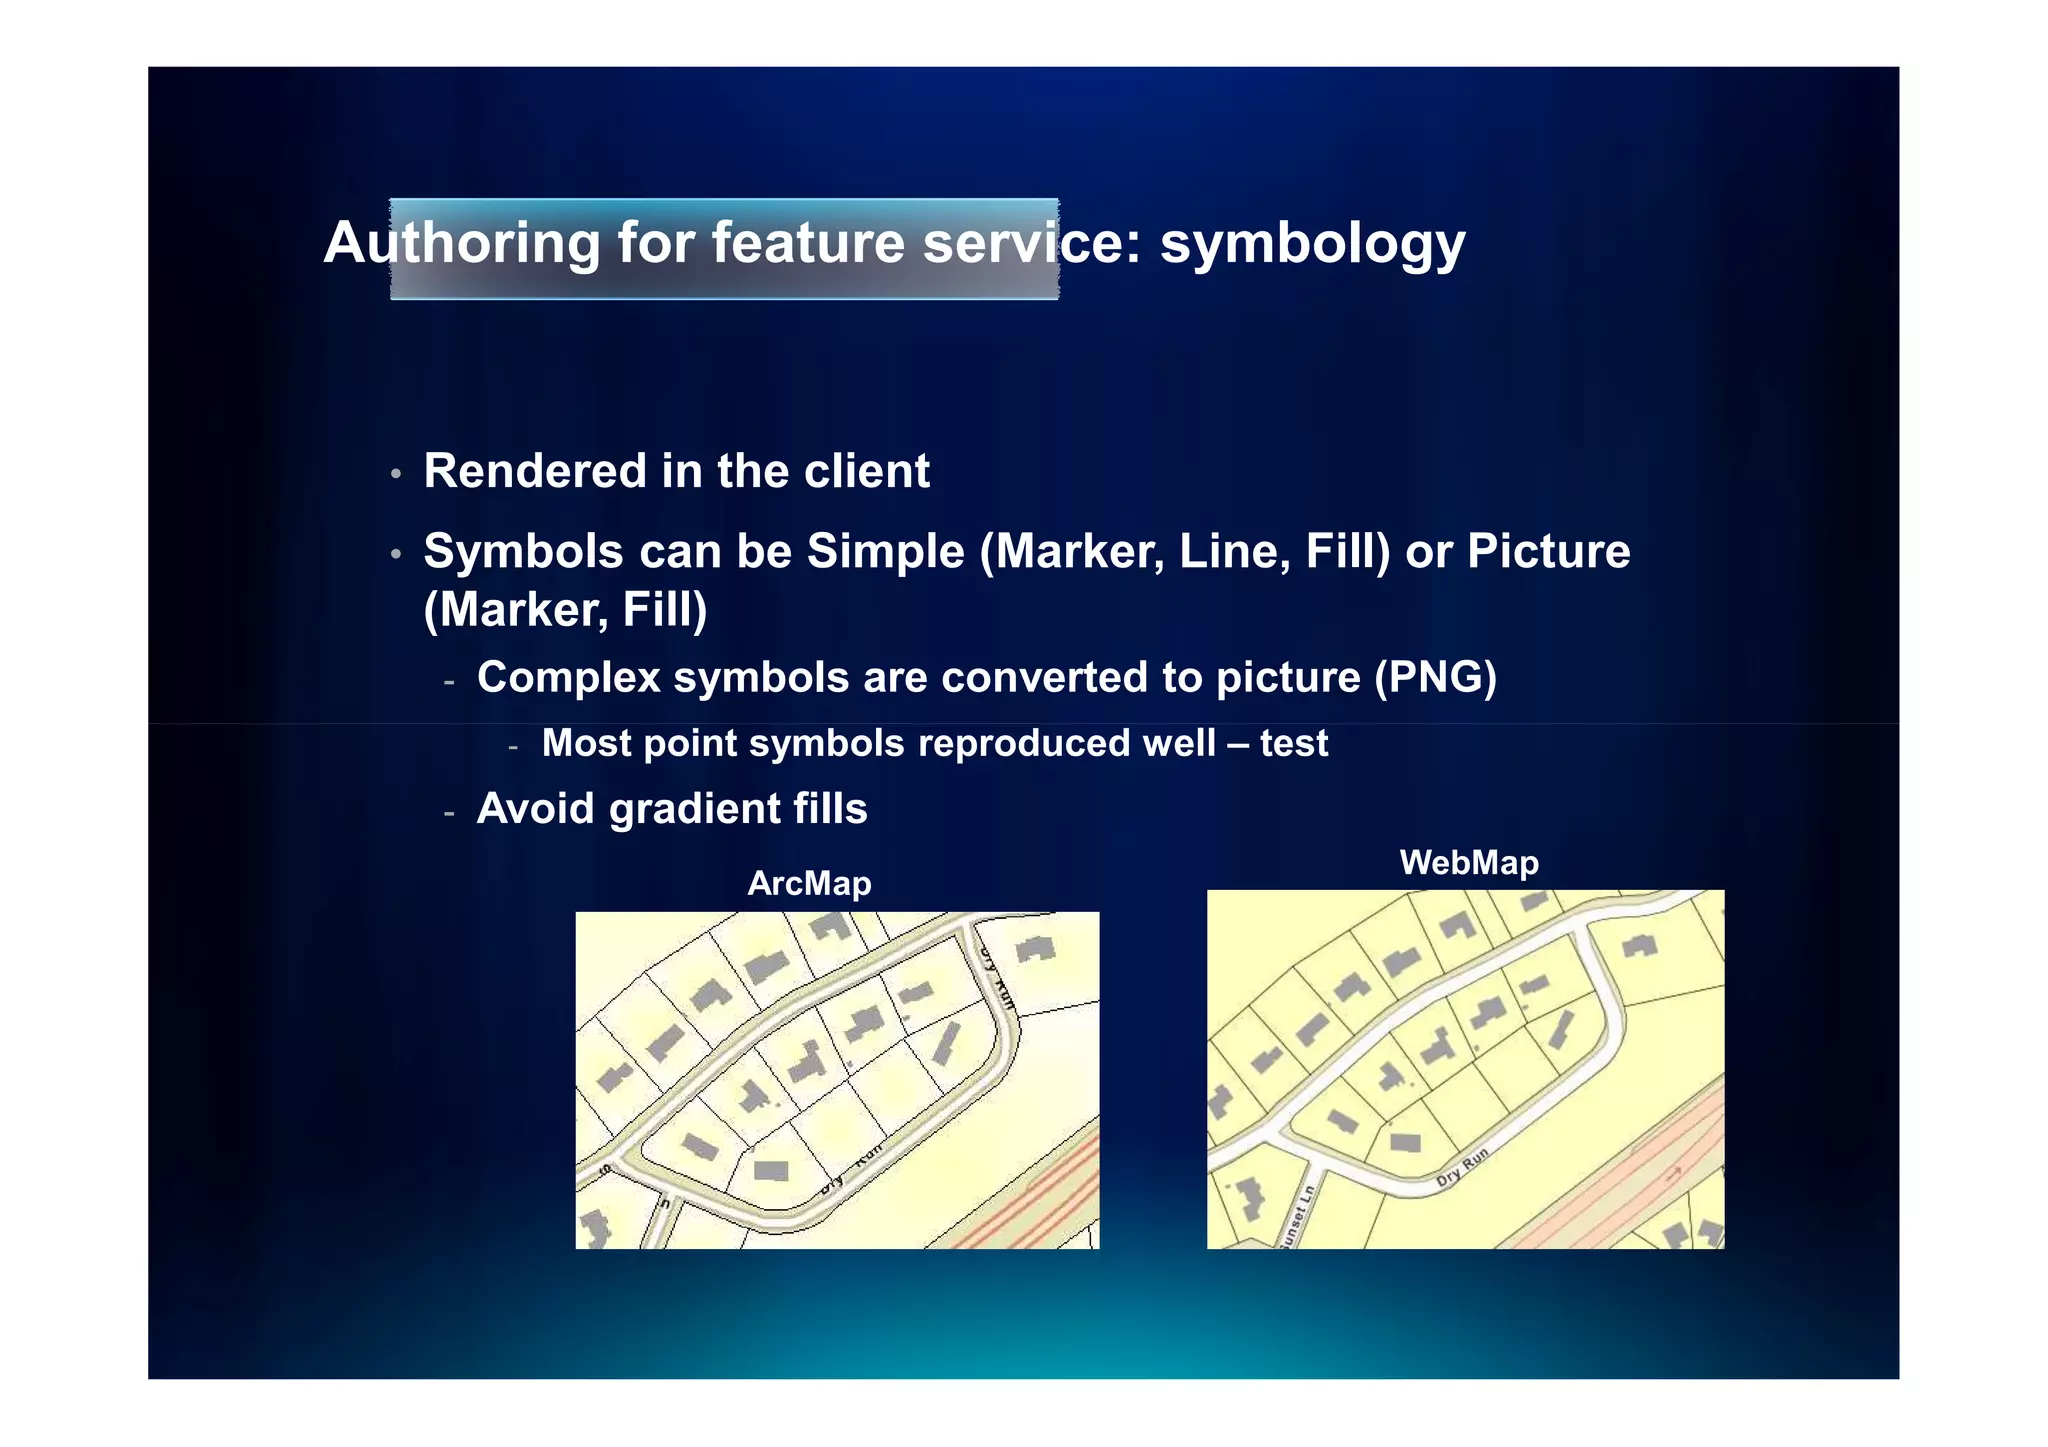
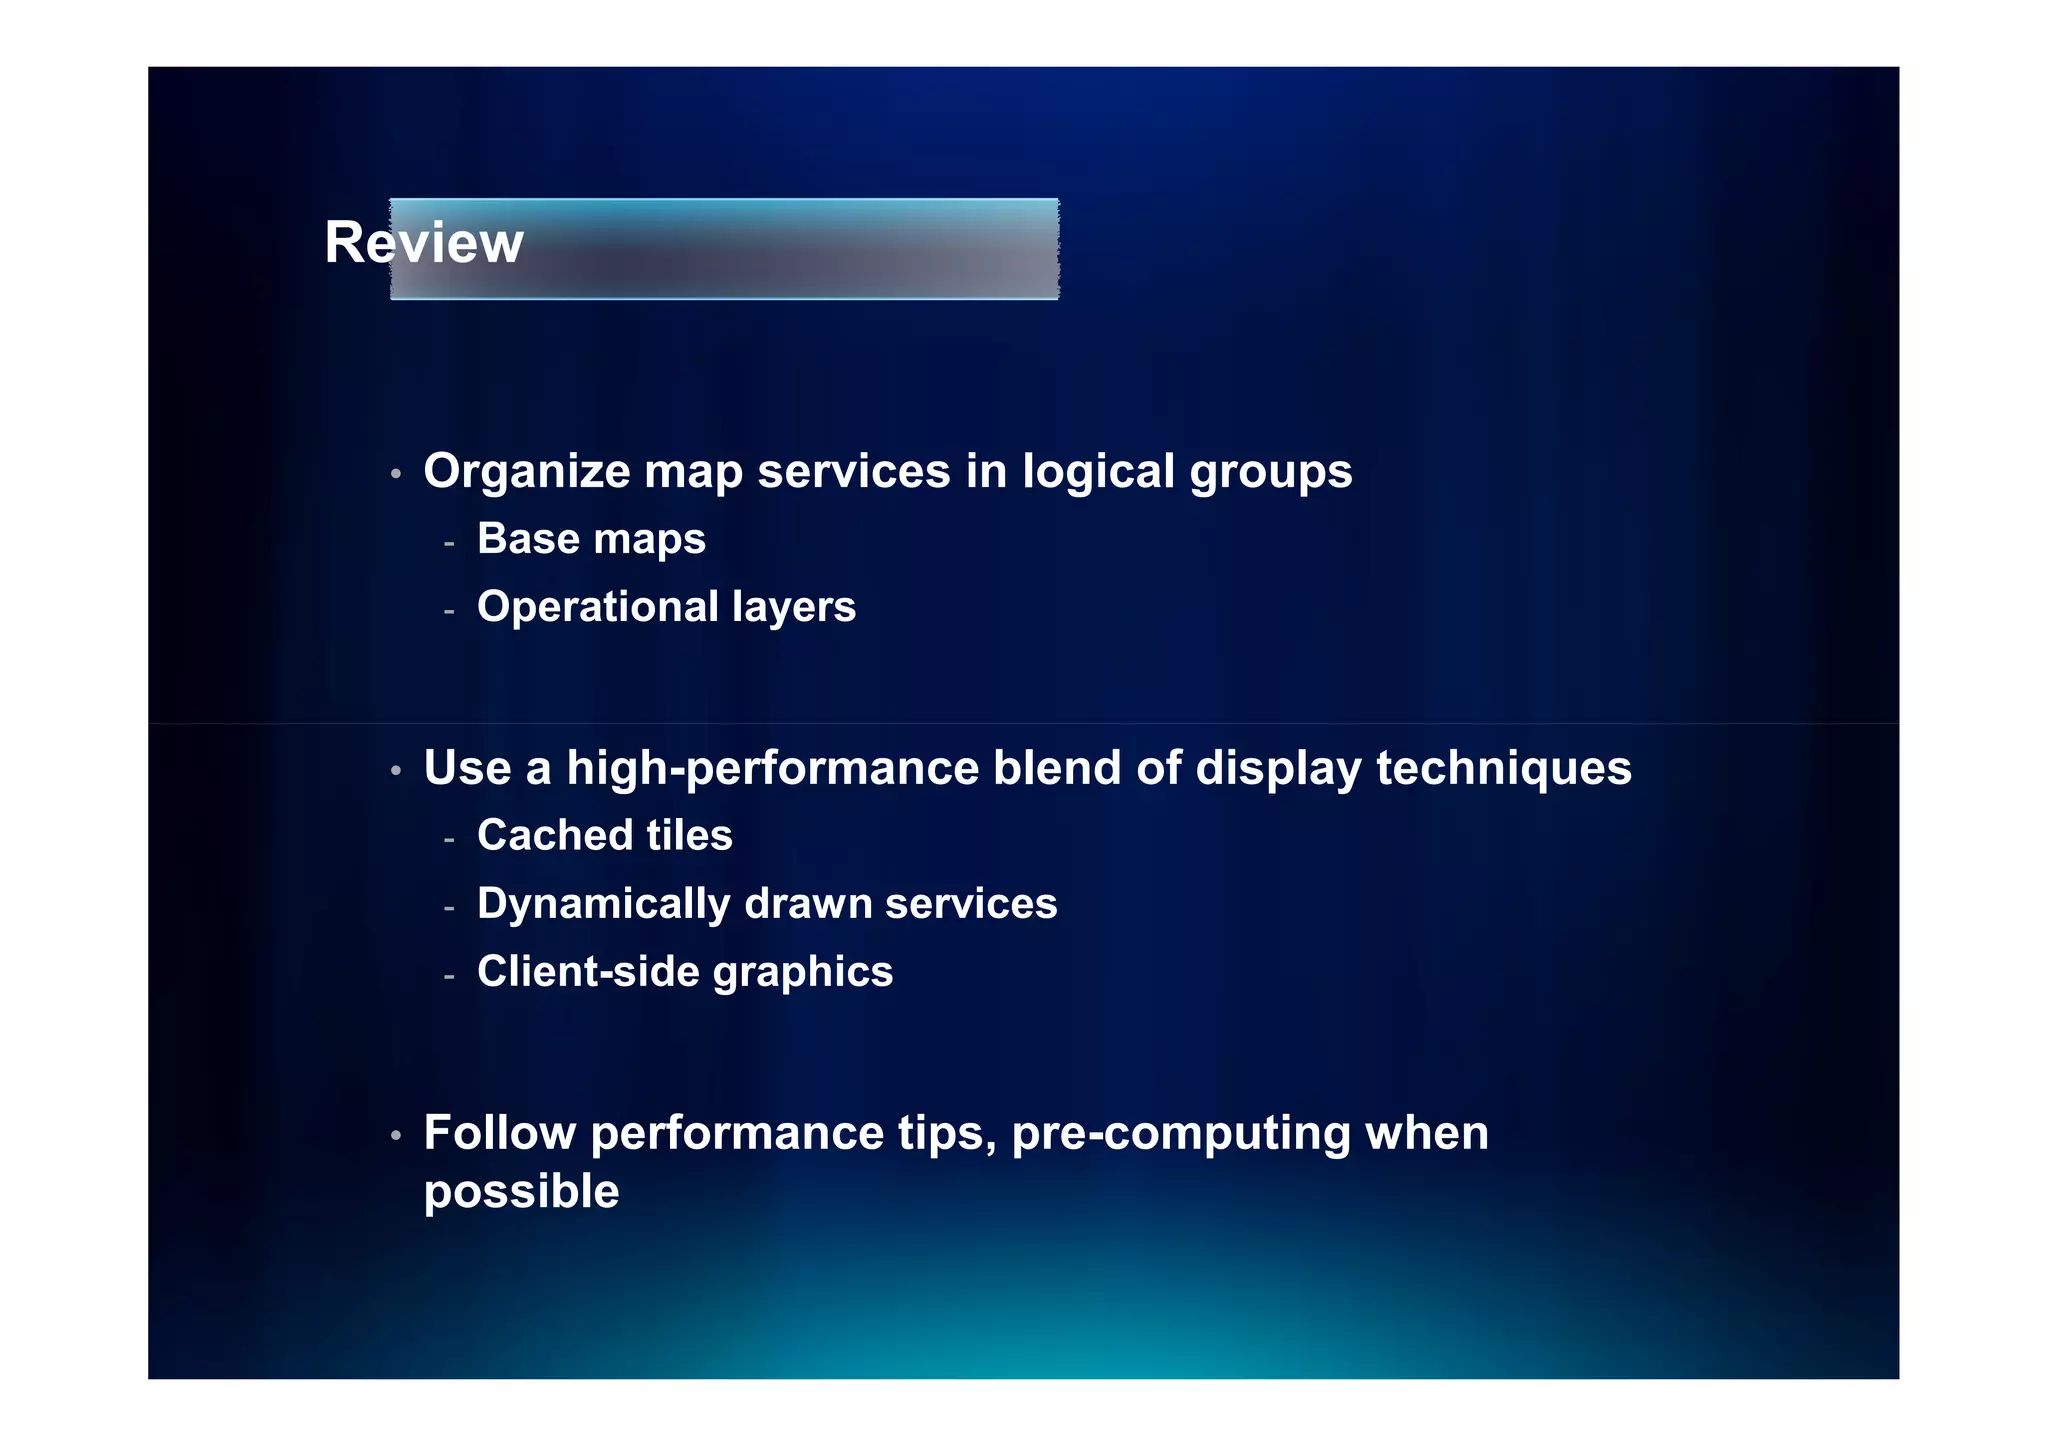
Optimizing your map services
    Optomizando tus servicios de mapas

                                  Sterling Quinn
What’s in this session


  •   Map service planning and design


  •   Ways to serve your maps
      -   Cached tiles
      -   Dynamic map service
      -   Client-side graphics


  •   Authoring a good web map


  •   Performance tips for map services
How web maps have changed!
Organize data into logical groupings


Basemaps                            Operational Layers
Geographic frame of reference       Show a focused item of interest

Contain static vector               Support functionality
 and raster data                     of the application

Reusable in multiple applications   Displayed on top of base map
Case study: Google Maps
Google Maps base maps

“Map”                       “Terrain”
                             Terrain”                   “Satellite”
•   Highways                •   Shaded relief           • Imagery
•   Streets                 •   Vegetation              • Source information
•   Ferries                 •   Highways
•   Railroads               •   Streets
•   Transit centers         •   Cities
•   Cities                  •   Parks
•   Parks                   •   Military reservations
•   Military reservations   •   Municipal boundaries
•   Municipal boundaries    •   Lakes
•   Lakes                   •   Rivers
•   Rivers                  •   Golf courses
•   Golf courses            •   Hospitals
•   Hospitals               •   Shopping centers
•   Shopping centers        •   Airports
•   Airports                •   Colleges
•   Colleges                •   Cemeteries
•   Cemeteries              •   Amusement parks
•   Amusement parks
Google Maps operational layers


  •   Street overlay for imagery
  •   Traffic
  •   Photos
  •   Videos
  •   Wikipedia
  •   StreetView coverage
  •   Web cams
  •   Bicycle routes
Some ArcGIS Server examples


  •   Orange County Property Appraiser Map


  •   City of St George


  •   North Vancouver Projects


  •   Solar Boston


  •   City of Greeley Property Information Map
Ways to serve your maps
Three options for displaying map services


  •   As cached tiles


  •   As a dynamically drawn image


  •   As client-side graphics
Cached tiles

•   Pre-draw map tiles and serve them to clients


•   Best performance and scalability


•   Standard for online maps (Google, Bing, Yahoo, etc)


•   Requires you to create and
    maintain cache
What should you cache?


  •   Base maps


  •   Operational layers that satisfy one of the following:
      -   High volumes of traffic
      -   Don’t change often
      -   Cover small scales only
Cache image formats


  •   JPEG or MIXED for most basemaps
      -   High quality (~90) for vectors
      -   Lower quality (55 – 75) for imagery


  •   PNG 32 for overlay networks (boundaries, roads)


  •   MIXED or PNG for other overlays
Dynamically drawn map services


  •   Server retrieves data, draws an image, sends image
      to client


  •   Slower than caching, but may be satisfactory using
      optimized map service
Data that’s OK to draw dynamically


  •   Real-time data


  •   Frequently-changing data with large scope


  •   Internal maps accessed by just a few people
Two types of files can support a map service


  Map service definition            Map document
          .MSD             OR           .MXD

        Optimized                     Traditional
        map service                   map service


                      Map service
Optimized map services


  •   Obtained through Map Services Publishing toolbar in
      ArcMap


  •   Supports the most common layer and symbol types


  •   Faster dynamic drawing than ArcIMS
Demo
Publishing an optimized map service
Antialiasing with optimized map services

•   Improves visual quality


•   Slight performance cost
    -   Use Preview button to see
        effect on performance
What’s available through optimized services?

 •   Most data and layer types
     -   You’ll get an Error in analyzer if not supported


 •   New at 10.0: Maplex and cartographic representations
     -   Recommended for caching only
If you have to use an MXD-based service…

  •   Move whatever layers you can into a separate
      optimized map service


  •   Use ESRI_Optimized style for drawing


  •   Still use the Analyze button to catch performance
      warnings
Client-side graphics


  •   “Data on demand” pattern treats map service as a
      feature server
      -   Queries from map services
      -   Feature services
  •   Server sends geometries and attributes to client


  •   Features drawn in browser
What should you draw with client-side graphics?


  •   Query or geoprocessing results
  •   Layers that need to be thematically symbolized on
      the fly
      -   National Center for Education Statistics
  •   Web editing: Feature Services
  •   Interactive operational layers for mashups
ArcGIS Server Blog Posts


  •   Determining Limits for Map Graphics
  •   High Performance Web Map with Large Dataset as
      FeatureLayer
  •   Out of Box Vector Tiling using FeatureLayer
  •   FeatureLayer can Generalize Geometries on the fly
maxAllowa… what?


 maxAllowableOffset:
 •   a way of reducing the number of points in a curve
 •   Suggestion: a feature’s geometry should not display
     more than one vertex per pixel
Graphics performance considerations


  •   Generalize geometries
       -   Do not generalize geometries in Editing scenario
  •   Be careful not to request too many features
       -   Scale dependencies with Feature Services
  •   Beware of server limits on number of features that
      can be returned
       -   Default 1000
  •   Beware “1=1”
      firewall filters
Where can I learn more about these techniques?


  •   Implementation differs depending on the web API
      being used


  •   Online examples at the ArcGIS Resource Center
Performance tips for map
       services
Pre-compute when possible


  •   Cache
  •   Annotation
  •   Projection
      -   Tip: You can re-project geodatabase features during
          replication
  •   Spatial indexes
      -   Keep up to date
      -   Correct size relative to map extent
  •   Query or geoprocessing results
Data access tips


  •   Tune ArcSDE (direct connect recommended)
  •   Avoid UNC paths for file-based data
  •   Avoid downloading all attributes unless you have to
  •   Attribute indexes
      -   Use for joins and common queries
  •   Precalculate query or tool results
      -   Example: Solar Boston
A u th o r in g   a   g o o d   w e b   m a p
Start with a template


  •   Fully functional apps, maps
      and data
      -   Esri: Resources.arcgis.com
           -   User Communities
      -   Community: www.arcgis.com >
          Gallery
           -   Look for “Configurable”
      -   Download and point at
          your own data
Demo
Building a basemap from a template
Authoring a basemap from scratch


  •   Only a good option if there
      are no templates


  •   Design map for cache scales
      -   Add your tiling scheme scales
          to the ArcMap dropdown list


  •   Group layers by scale level
      -   Only have to set the scale range
          at the group layer level
      -   Copy layers between groups
Authoring mobile maps
Specific cartography for mobility


   •   Design for purpose
       -   Remove unnecessary layers of information
       -   Set scale dependency (walk, drive, etc)
       -   Render editable layers to define feature
           types
                                                      Sunlight
                                                      washes
                                                      out
   •   Design for the environment                     Colors

       -   Establish contrast, choose meaningful
           symbology
Authoring for feature service: symbology


  •   Rendered in the client
  •   Symbols can be Simple (Marker, Line, Fill) or Picture
      (Marker, Fill)
      -   Complex symbols are converted to picture (PNG)
           -   Most point symbols reproduced well – test
      -   Avoid gradient fills
                                                           WebMap
                         ArcMap
Sneak peek: Changing symbology on the fly at 10.1


  •   Modify symbols without downloading geometries on
      the client side
      -   Useful when there are a lot of features
  •   Maps are drawn at the server side
      -   Only image is returned to the client
  •   Helper function on the server side to compute class
      breaks
Demo
Server side thematic mapping at 10.1
Review


 •   Organize map services in logical groups
     -   Base maps
     -   Operational layers


 •   Use a high-performance blend of display techniques
     -   Cached tiles
     -   Dynamically drawn services
     -   Client-side graphics


 •   Follow performance tips, pre-computing when
     possible
Q u e s tio n s
Optimizing your Map Services

Optimizing your Map Services

  • 1.
    Optimizing your mapservices Optomizando tus servicios de mapas Sterling Quinn
  • 2.
    What’s in thissession • Map service planning and design • Ways to serve your maps - Cached tiles - Dynamic map service - Client-side graphics • Authoring a good web map • Performance tips for map services
  • 3.
    How web mapshave changed!
  • 4.
    Organize data intological groupings Basemaps Operational Layers Geographic frame of reference Show a focused item of interest Contain static vector Support functionality and raster data of the application Reusable in multiple applications Displayed on top of base map
  • 5.
  • 6.
    Google Maps basemaps “Map” “Terrain” Terrain” “Satellite” • Highways • Shaded relief • Imagery • Streets • Vegetation • Source information • Ferries • Highways • Railroads • Streets • Transit centers • Cities • Cities • Parks • Parks • Military reservations • Military reservations • Municipal boundaries • Municipal boundaries • Lakes • Lakes • Rivers • Rivers • Golf courses • Golf courses • Hospitals • Hospitals • Shopping centers • Shopping centers • Airports • Airports • Colleges • Colleges • Cemeteries • Cemeteries • Amusement parks • Amusement parks
  • 7.
    Google Maps operationallayers • Street overlay for imagery • Traffic • Photos • Videos • Wikipedia • StreetView coverage • Web cams • Bicycle routes
  • 8.
    Some ArcGIS Serverexamples • Orange County Property Appraiser Map • City of St George • North Vancouver Projects • Solar Boston • City of Greeley Property Information Map
  • 9.
    Ways to serveyour maps
  • 10.
    Three options fordisplaying map services • As cached tiles • As a dynamically drawn image • As client-side graphics
  • 11.
    Cached tiles • Pre-draw map tiles and serve them to clients • Best performance and scalability • Standard for online maps (Google, Bing, Yahoo, etc) • Requires you to create and maintain cache
  • 12.
    What should youcache? • Base maps • Operational layers that satisfy one of the following: - High volumes of traffic - Don’t change often - Cover small scales only
  • 13.
    Cache image formats • JPEG or MIXED for most basemaps - High quality (~90) for vectors - Lower quality (55 – 75) for imagery • PNG 32 for overlay networks (boundaries, roads) • MIXED or PNG for other overlays
  • 14.
    Dynamically drawn mapservices • Server retrieves data, draws an image, sends image to client • Slower than caching, but may be satisfactory using optimized map service
  • 15.
    Data that’s OKto draw dynamically • Real-time data • Frequently-changing data with large scope • Internal maps accessed by just a few people
  • 16.
    Two types offiles can support a map service Map service definition Map document .MSD OR .MXD Optimized Traditional map service map service Map service
  • 17.
    Optimized map services • Obtained through Map Services Publishing toolbar in ArcMap • Supports the most common layer and symbol types • Faster dynamic drawing than ArcIMS
  • 18.
  • 19.
    Antialiasing with optimizedmap services • Improves visual quality • Slight performance cost - Use Preview button to see effect on performance
  • 20.
    What’s available throughoptimized services? • Most data and layer types - You’ll get an Error in analyzer if not supported • New at 10.0: Maplex and cartographic representations - Recommended for caching only
  • 21.
    If you haveto use an MXD-based service… • Move whatever layers you can into a separate optimized map service • Use ESRI_Optimized style for drawing • Still use the Analyze button to catch performance warnings
  • 22.
    Client-side graphics • “Data on demand” pattern treats map service as a feature server - Queries from map services - Feature services • Server sends geometries and attributes to client • Features drawn in browser
  • 23.
    What should youdraw with client-side graphics? • Query or geoprocessing results • Layers that need to be thematically symbolized on the fly - National Center for Education Statistics • Web editing: Feature Services • Interactive operational layers for mashups
  • 24.
    ArcGIS Server BlogPosts • Determining Limits for Map Graphics • High Performance Web Map with Large Dataset as FeatureLayer • Out of Box Vector Tiling using FeatureLayer • FeatureLayer can Generalize Geometries on the fly
  • 25.
    maxAllowa… what? maxAllowableOffset: • a way of reducing the number of points in a curve • Suggestion: a feature’s geometry should not display more than one vertex per pixel
  • 26.
    Graphics performance considerations • Generalize geometries - Do not generalize geometries in Editing scenario • Be careful not to request too many features - Scale dependencies with Feature Services • Beware of server limits on number of features that can be returned - Default 1000 • Beware “1=1” firewall filters
  • 27.
    Where can Ilearn more about these techniques? • Implementation differs depending on the web API being used • Online examples at the ArcGIS Resource Center
  • 28.
  • 29.
    Pre-compute when possible • Cache • Annotation • Projection - Tip: You can re-project geodatabase features during replication • Spatial indexes - Keep up to date - Correct size relative to map extent • Query or geoprocessing results
  • 30.
    Data access tips • Tune ArcSDE (direct connect recommended) • Avoid UNC paths for file-based data • Avoid downloading all attributes unless you have to • Attribute indexes - Use for joins and common queries • Precalculate query or tool results - Example: Solar Boston
  • 31.
    A u tho r in g a g o o d w e b m a p
  • 32.
    Start with atemplate • Fully functional apps, maps and data - Esri: Resources.arcgis.com - User Communities - Community: www.arcgis.com > Gallery - Look for “Configurable” - Download and point at your own data
  • 33.
    Demo Building a basemapfrom a template
  • 34.
    Authoring a basemapfrom scratch • Only a good option if there are no templates • Design map for cache scales - Add your tiling scheme scales to the ArcMap dropdown list • Group layers by scale level - Only have to set the scale range at the group layer level - Copy layers between groups
  • 35.
    Authoring mobile maps Specificcartography for mobility • Design for purpose - Remove unnecessary layers of information - Set scale dependency (walk, drive, etc) - Render editable layers to define feature types Sunlight washes out • Design for the environment Colors - Establish contrast, choose meaningful symbology
  • 36.
    Authoring for featureservice: symbology • Rendered in the client • Symbols can be Simple (Marker, Line, Fill) or Picture (Marker, Fill) - Complex symbols are converted to picture (PNG) - Most point symbols reproduced well – test - Avoid gradient fills WebMap ArcMap
  • 37.
    Sneak peek: Changingsymbology on the fly at 10.1 • Modify symbols without downloading geometries on the client side - Useful when there are a lot of features • Maps are drawn at the server side - Only image is returned to the client • Helper function on the server side to compute class breaks
  • 38.
  • 39.
    Review • Organize map services in logical groups - Base maps - Operational layers • Use a high-performance blend of display techniques - Cached tiles - Dynamically drawn services - Client-side graphics • Follow performance tips, pre-computing when possible
  • 40.
    Q u es tio n s