Downloaded 67 times


![1 | P a g e
1. Introduction
Water is a compound of paramount importance. The demand for water is growing
as the world’s population is increasing and rapid urbanization is taking place
worldwide. On the other hand, water resources are limited. Increasing demand for
various uses along with decreasing access to good quality water as nearby good-
quality sources have already been overexploited, just aggravates the condition.
Urban sprawling and population growth in countries like India, leads to an
increase in the stress on existing water resources, because of growing demands
for drinking, irrigation and industrial needs [Singh et al. 2011]. Such an increase
in the usage of water has affected both surface and groundwater supplies,
resulting in an acute water crisis [Thakur et al. 2011]. In addition, low-intensity
and erratic monsoons create further shortages of surface-water supply. As a result,
the demand for groundwater resources has increased tremendously year by year,
causing a drastic decline in its levels. Overexploitation of groundwater has led to
the drying up of the aquifer zones in several parts of the country. Around 70% of
the country’s population is directly or indirectly dependent upon agriculture
based economy, and adequate availability of good-quality water is a prerequisite
for it [Usha Chirala, 2012]. Hence, it is imperative that optimal utilization of water
resources is a key to the sustenance of future economy [Usha Chirala, 2012].
1.1 What is Morphometry?
Rivers and their tributaries are the key features of a drainage basin. Morphometry
in principle is the measurement and mathematical analysis of the configurations
of the Earth’s surface and the shape and dimensions of its landforms [Clarke,
1966]. It is a modern analytical-cartographic approach to represent bare earth](https://image.slidesharecdn.com/rsandgisbaseddrainagemorphometry-170718194657/85/Remote-Sensing-GIS-based-drainage-morphometry-8-320.jpg)
![2 | P a g e
topography by the computer manipulation of terrain height. The form and
structure of the drainage basin along with their associated drainage networks are
described by their morphometric parameters. Quantitative morphometric
measurement is performed using defined mathematical equations, under three
aspects: (1) Linear (2) Areal and (3) Relief.
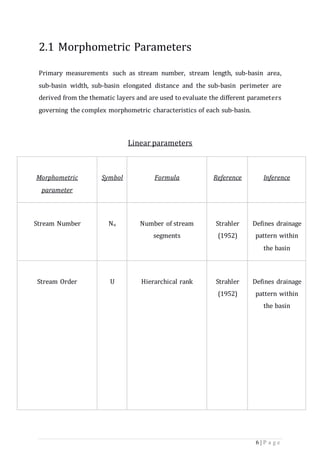
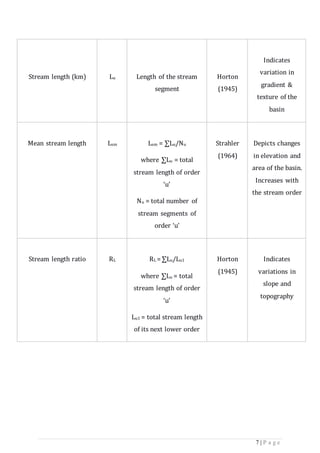
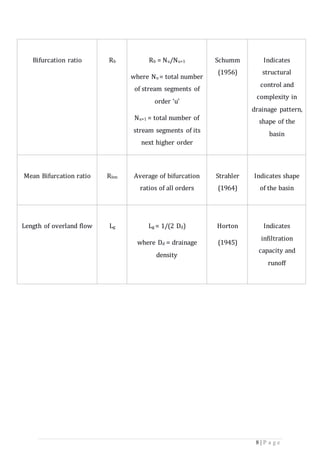
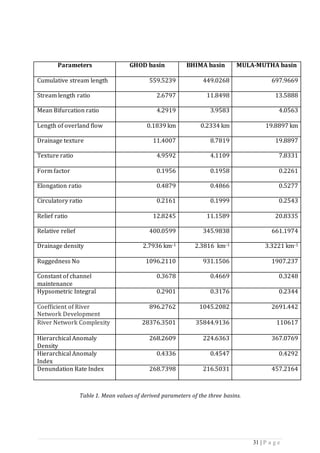
In the linear aspect of analysis, the linear structures such as length of the main
channel, stream hierarchical orders, bifurcation ratio, length of overland flow,
stream length ratio and mean length of streams are measured to evaluate the
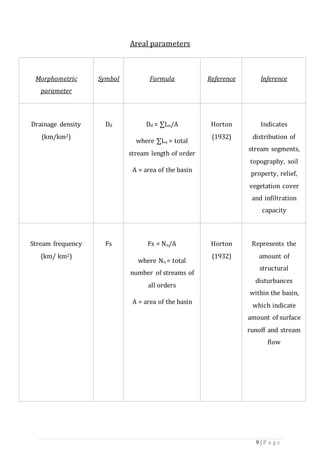
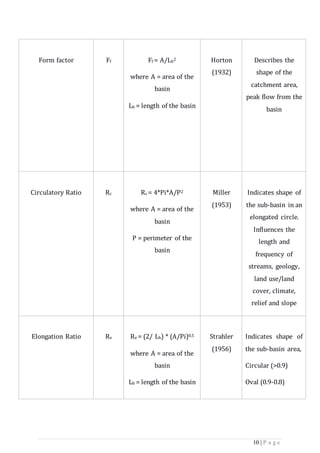
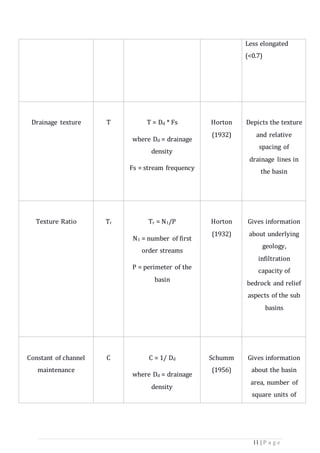
linear morphometric characteristics of the sub-basins. In the areal aspect, sub-
basin area, drainage density, stream frequency, circulatory ratio, elongation ratio,
form factor, drainage texture, texture ratio and constant of channel maintenance
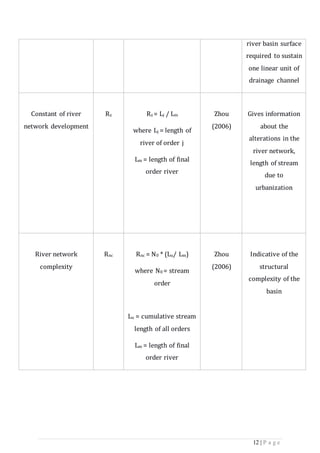
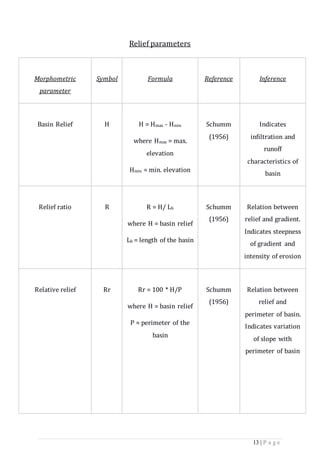
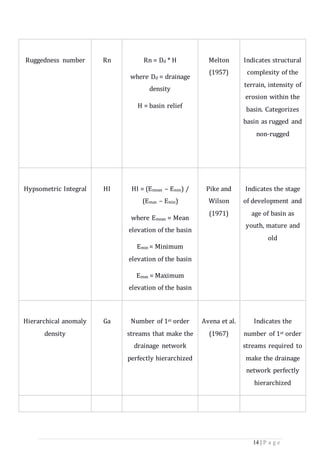
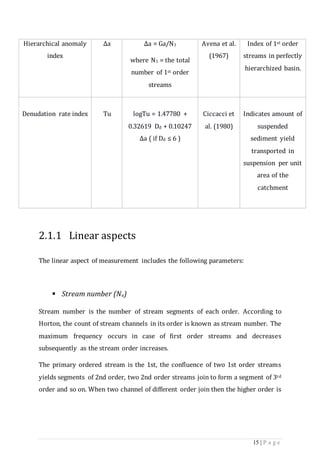
are measured. Relief ratio, relative relief, ruggedness number, hypsometric
integral, hierarchical anomaly density, hierarchical anomaly index, denudation
rate index, coefficient of river network development and river network complexity
are estimated under the relief aspect. Information on the hydrological nature of
the rocks getting exposed within the drainage basin can be obtained by assessing
the characteristics of the drainage basin using quantitative morphometric
analysis.
Geometry of the drainage basin is the result of numerous factors which reshape
the topography of the region over a period of time. All these factors influence the
surface run-off, water discharge and also the nature of the drainage pattern of
stream channels in the basin. The factors include climate, topography, bedrock
type, soil type, and vegetation cover. A proper understanding of these elements
gives insights into the characteristics of sediment discharge and water resource
availability. While it is essential to assess, record and measure these elements
qualitatively and quantitatively, it may not be easy to do that directly all the times
[Usha Chirala, 2012].
In such scenario, a quantitative analysis of drainage basin morphometry provides
a bottom-up approach to unravel the influence and magnitude of the factors](https://image.slidesharecdn.com/rsandgisbaseddrainagemorphometry-170718194657/85/Remote-Sensing-GIS-based-drainage-morphometry-9-320.jpg)
![3 | P a g e
responsible for the outcomes. On the other hand, such a study of the drainage
morphometry also plays an important role in understanding the landform
processes, physical properties of the soil and erosion characteristics pertaining
within the basin area.
1.2 RS and GIS in morphometry
Remote sensing and Geographical Information Systems (GIS) techniques are
increasingly being used for morphometric analysis of drainage basins throughout
the world. Remotely sensed images provide a synoptic view of the terrain, and
facilitates the monitoring and analysis of spatial information, obtained using
remote sensing. Integrating GIS and RS provides an efficient mechanism not only
to upgrade and monitor morphometric parameters but also to permit spatial
analysis of other associated thematic database [Jain et al. 1995]. Satellite image
and aerial photographs provide a very good input source for the preparation of
thematic layers.](https://image.slidesharecdn.com/rsandgisbaseddrainagemorphometry-170718194657/85/Remote-Sensing-GIS-based-drainage-morphometry-10-320.jpg)


This seminar report examines GIS-based drainage morphometric analysis, focusing on the use of remote sensing and GIS techniques to analyze drainage basins. It discusses the importance of morphometry and its parameters, such as linear, areal, and relief aspects, to understand landforms, water resources, and soil properties. The integration of these technologies allows for better assessment and management of water resources, especially in the context of increasing demand due to population growth and urbanization.


