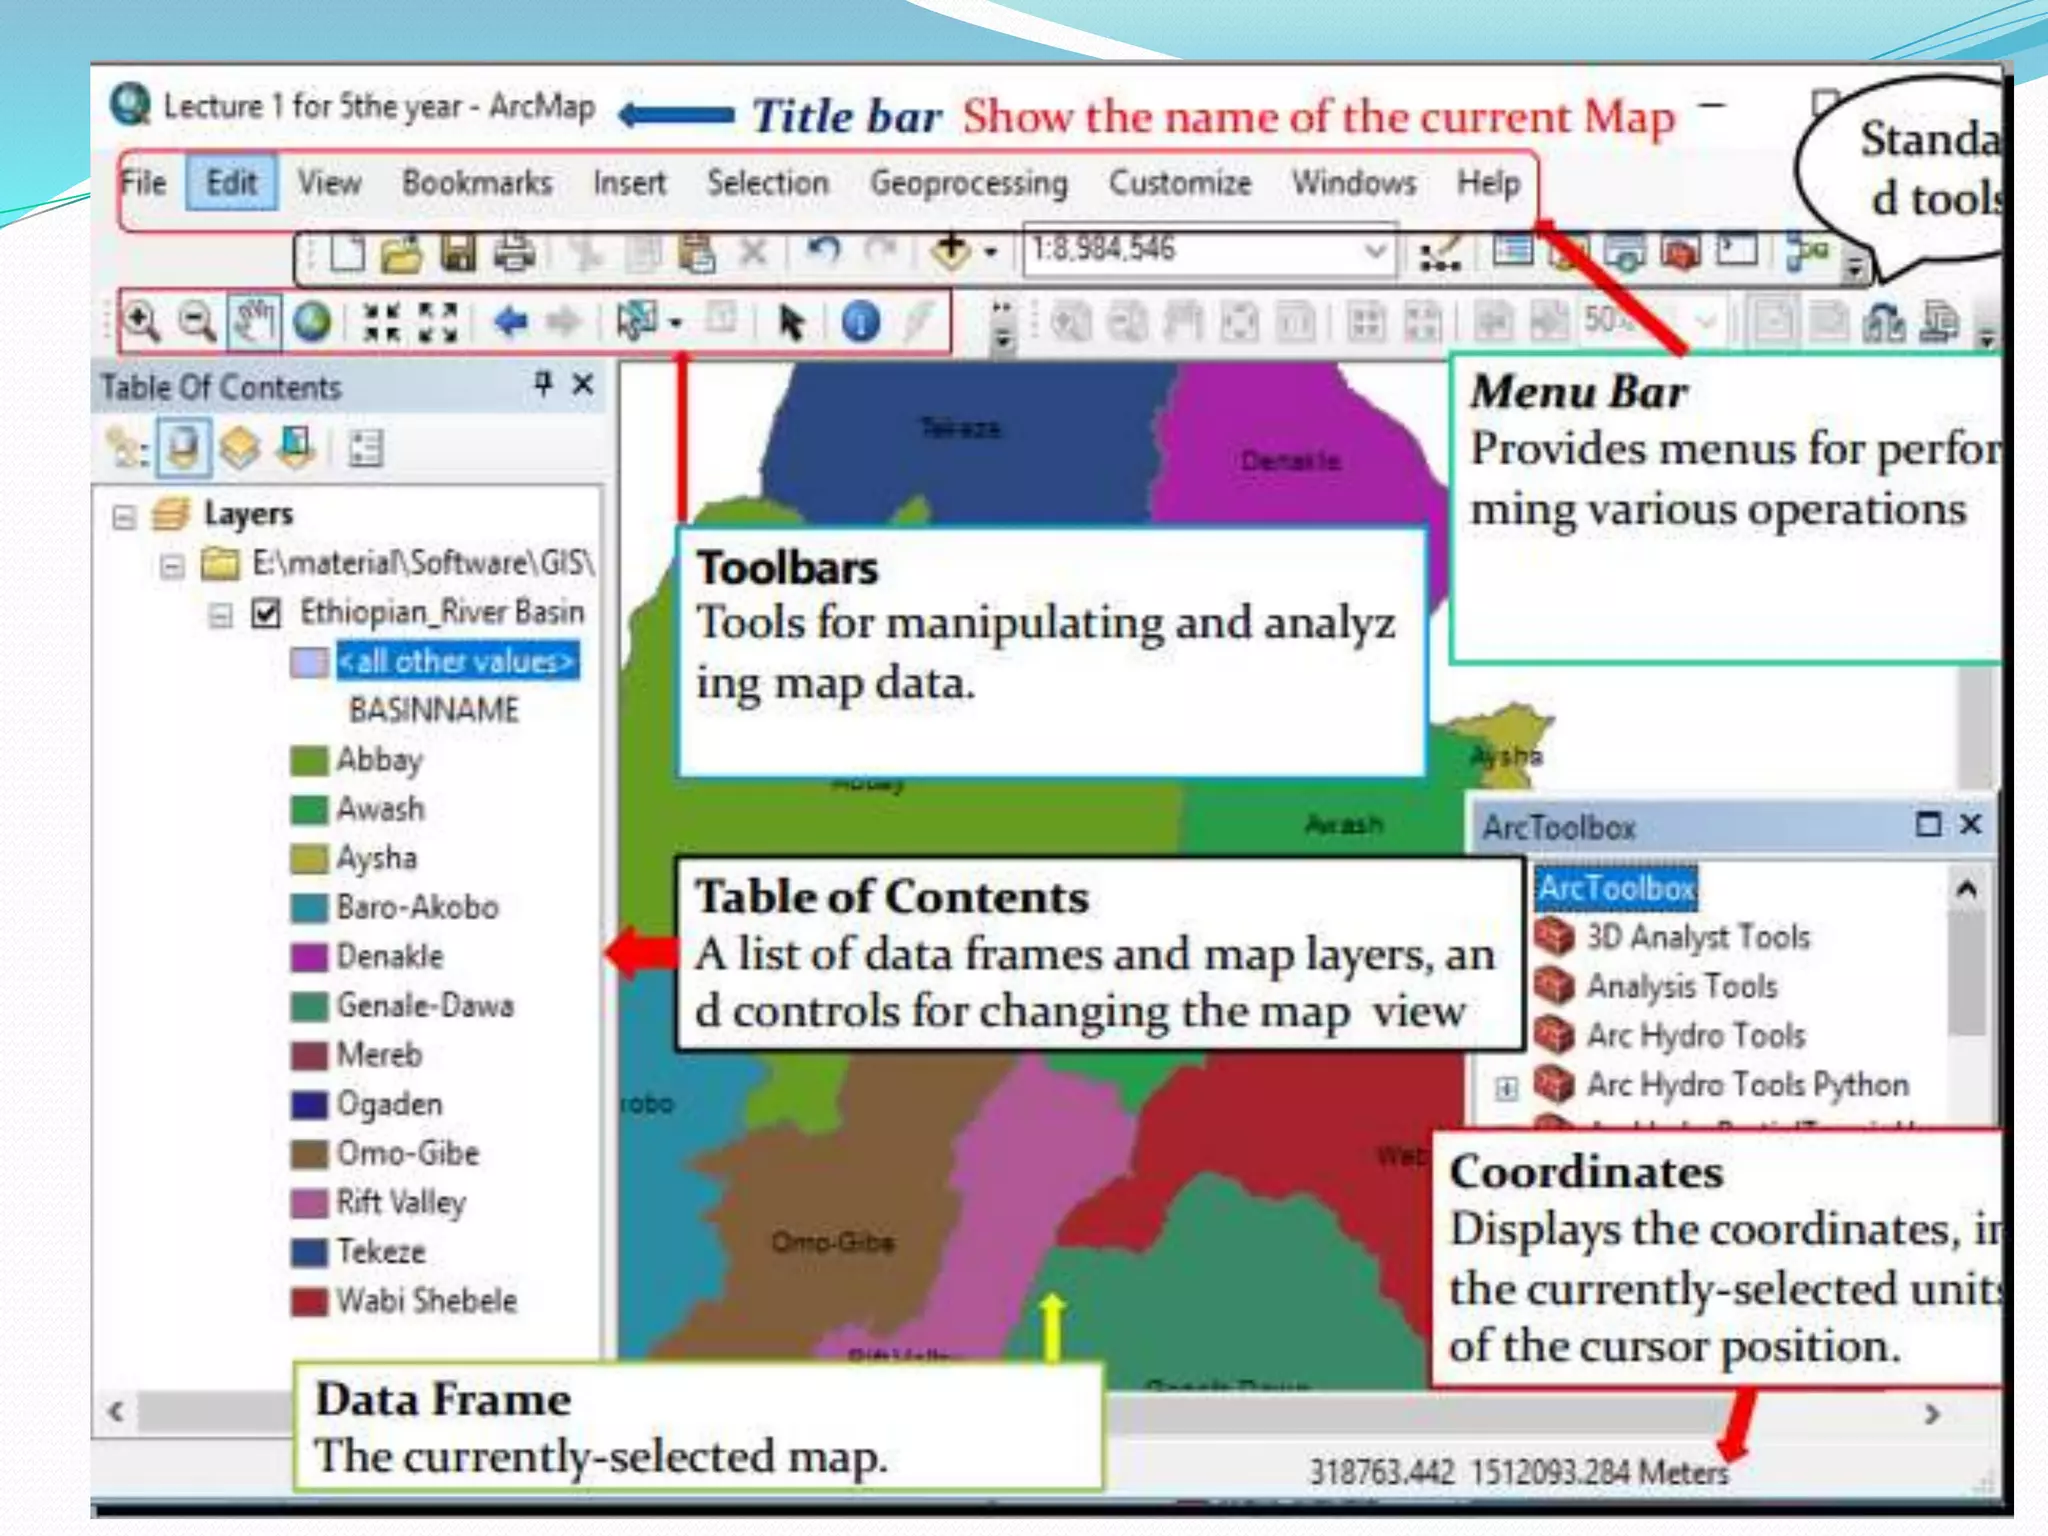
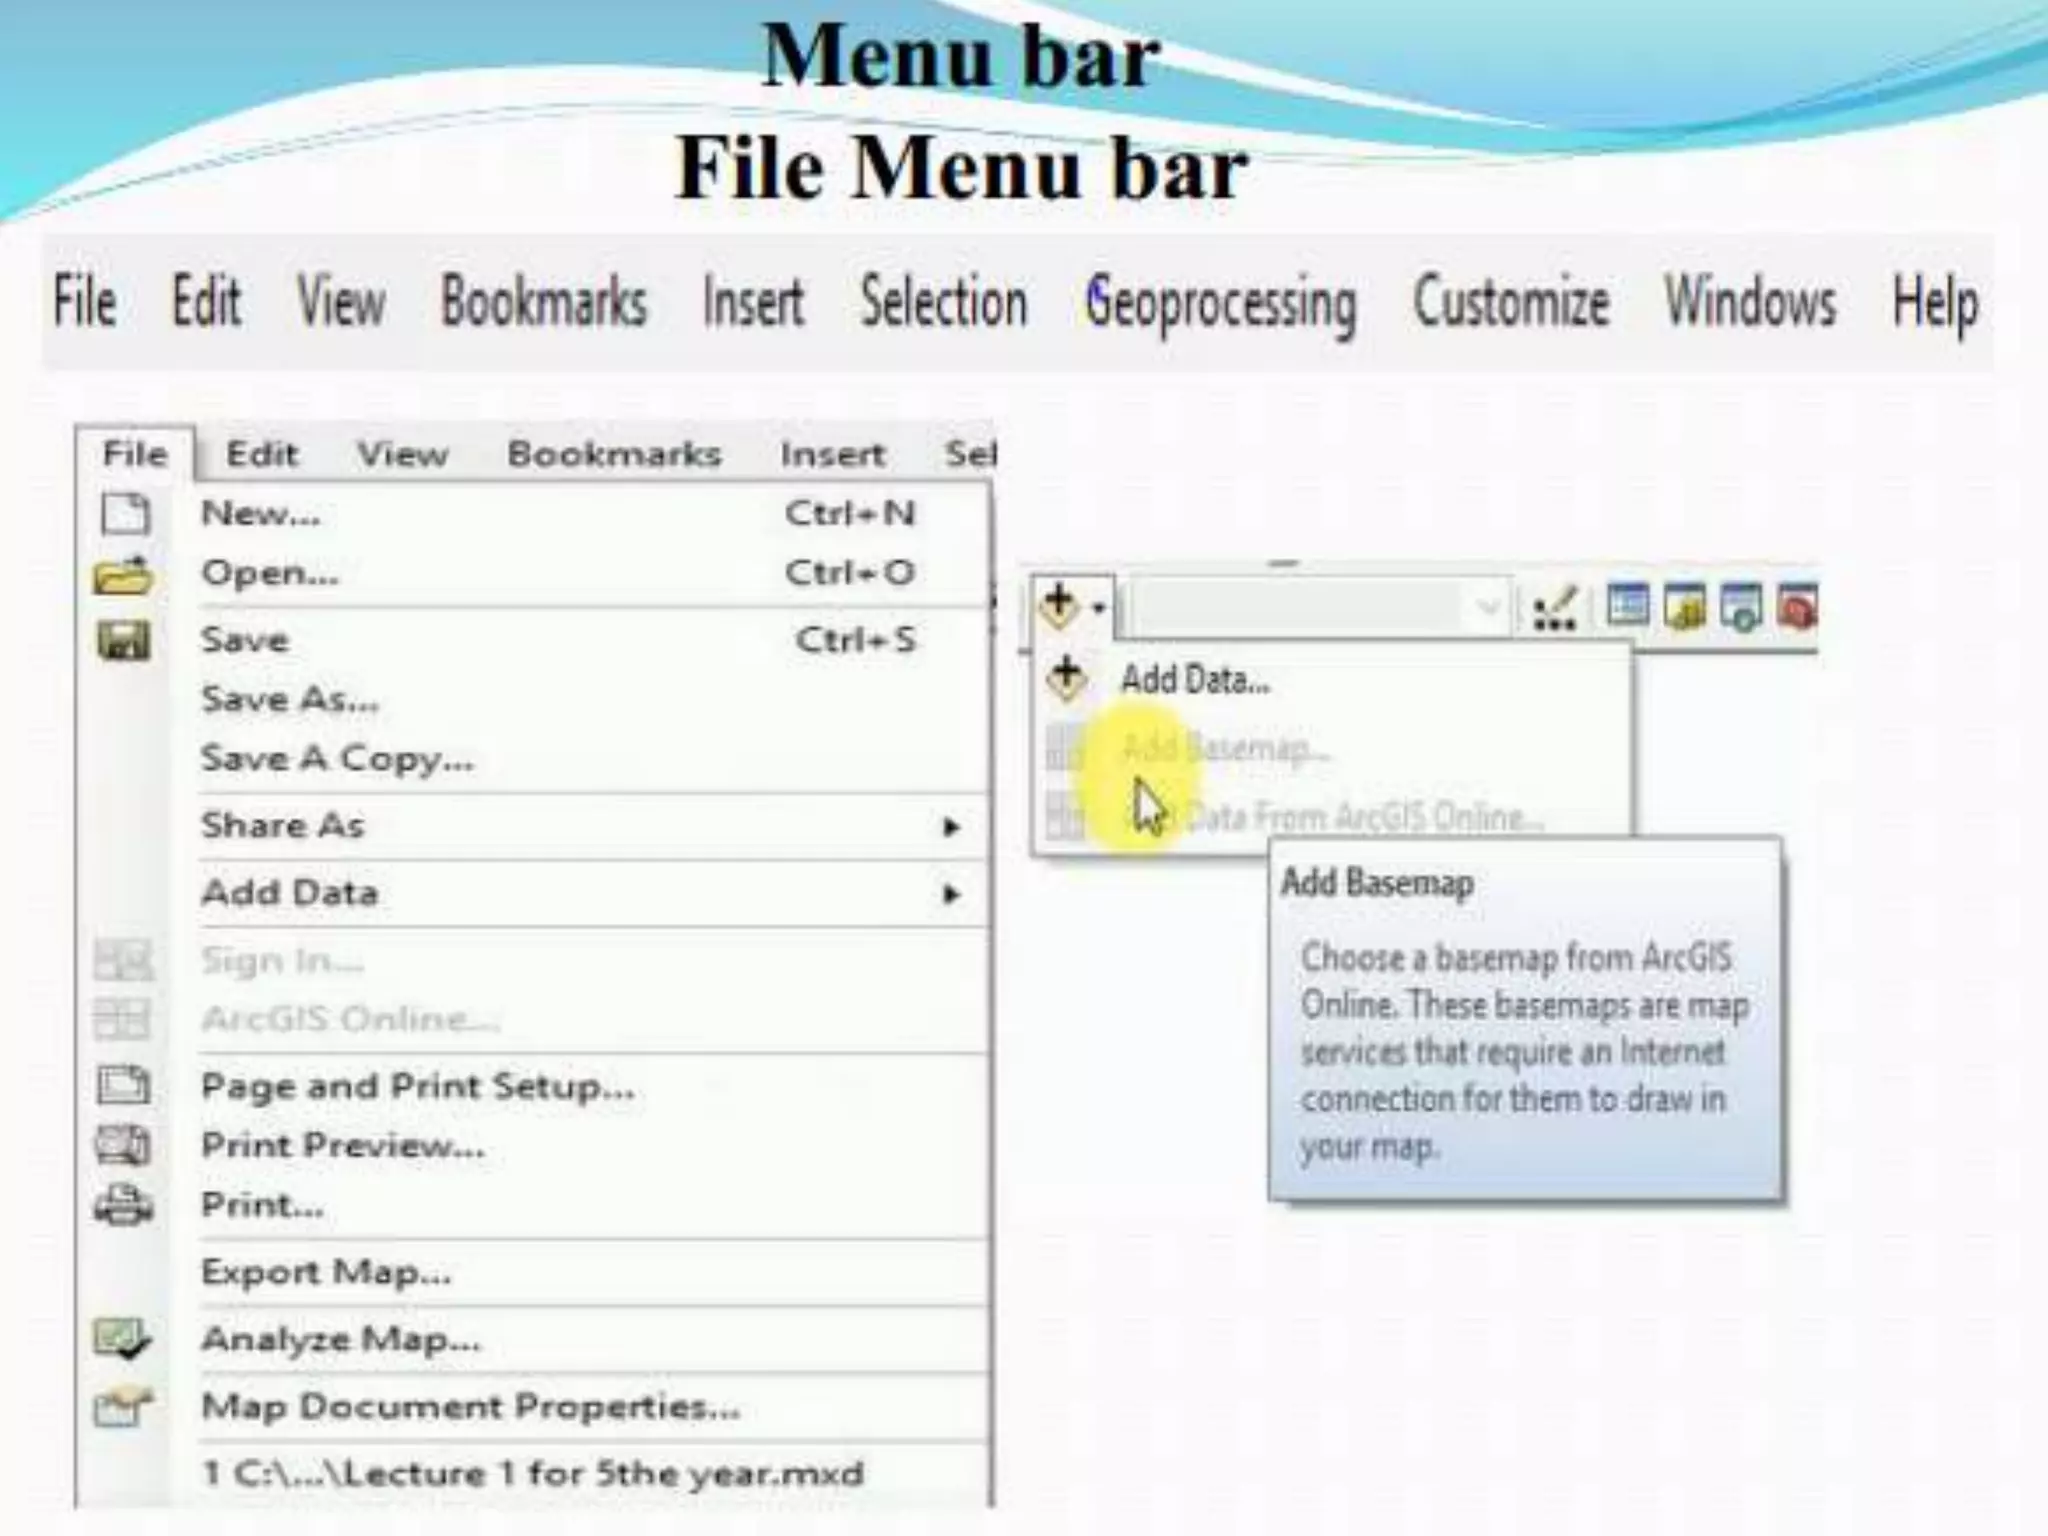
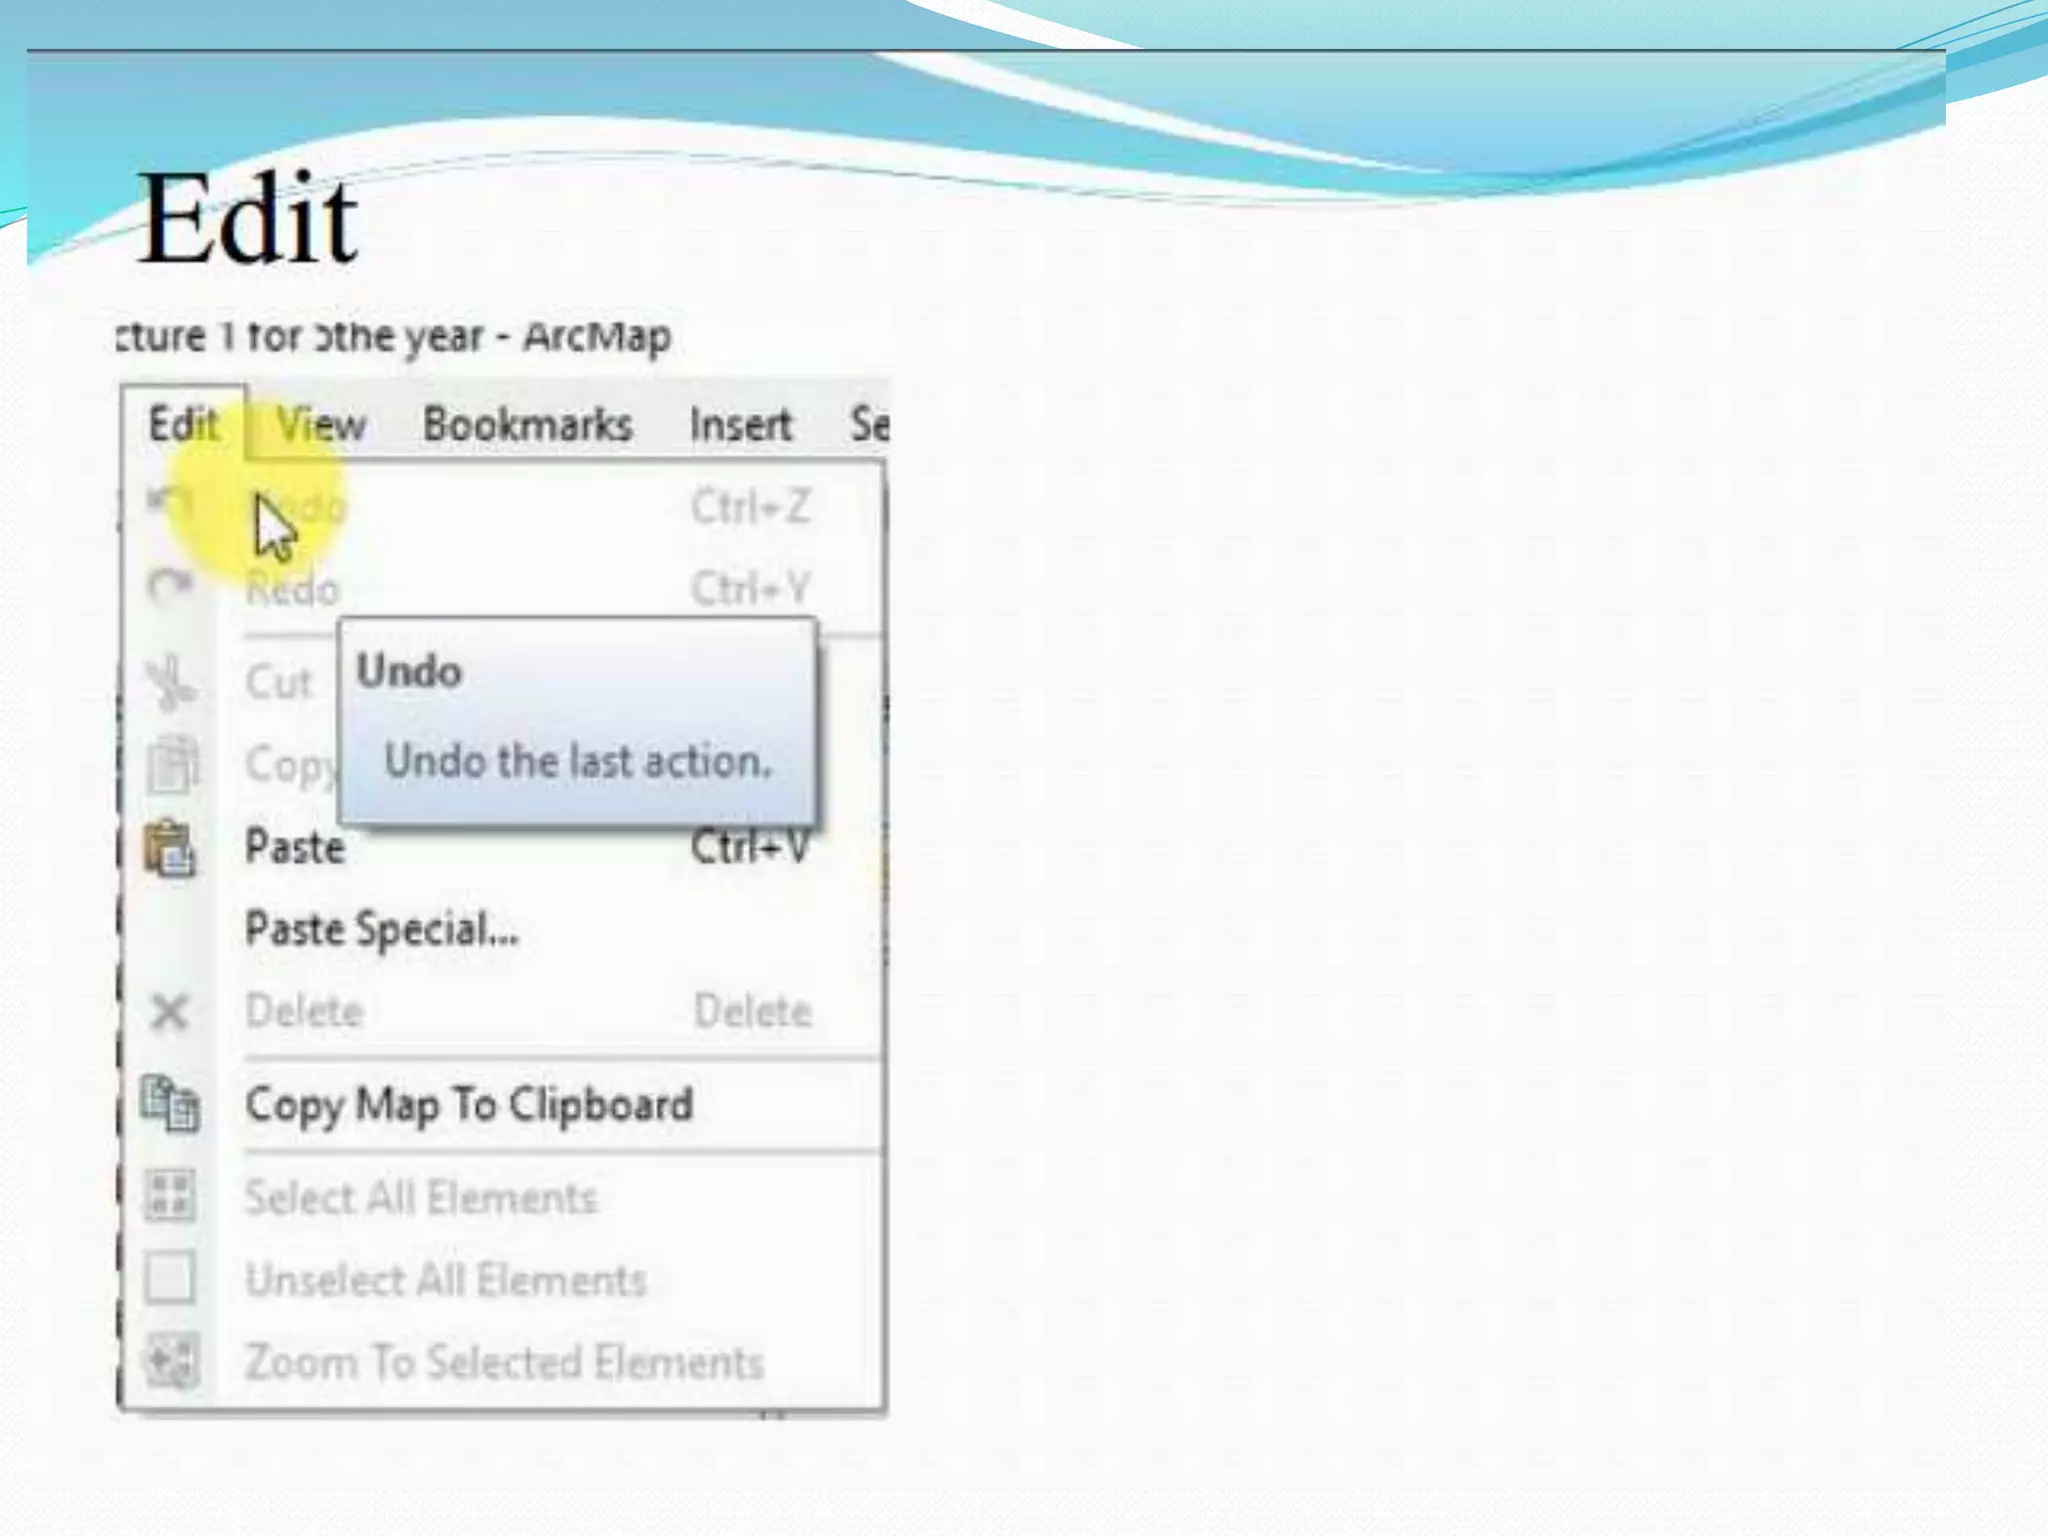
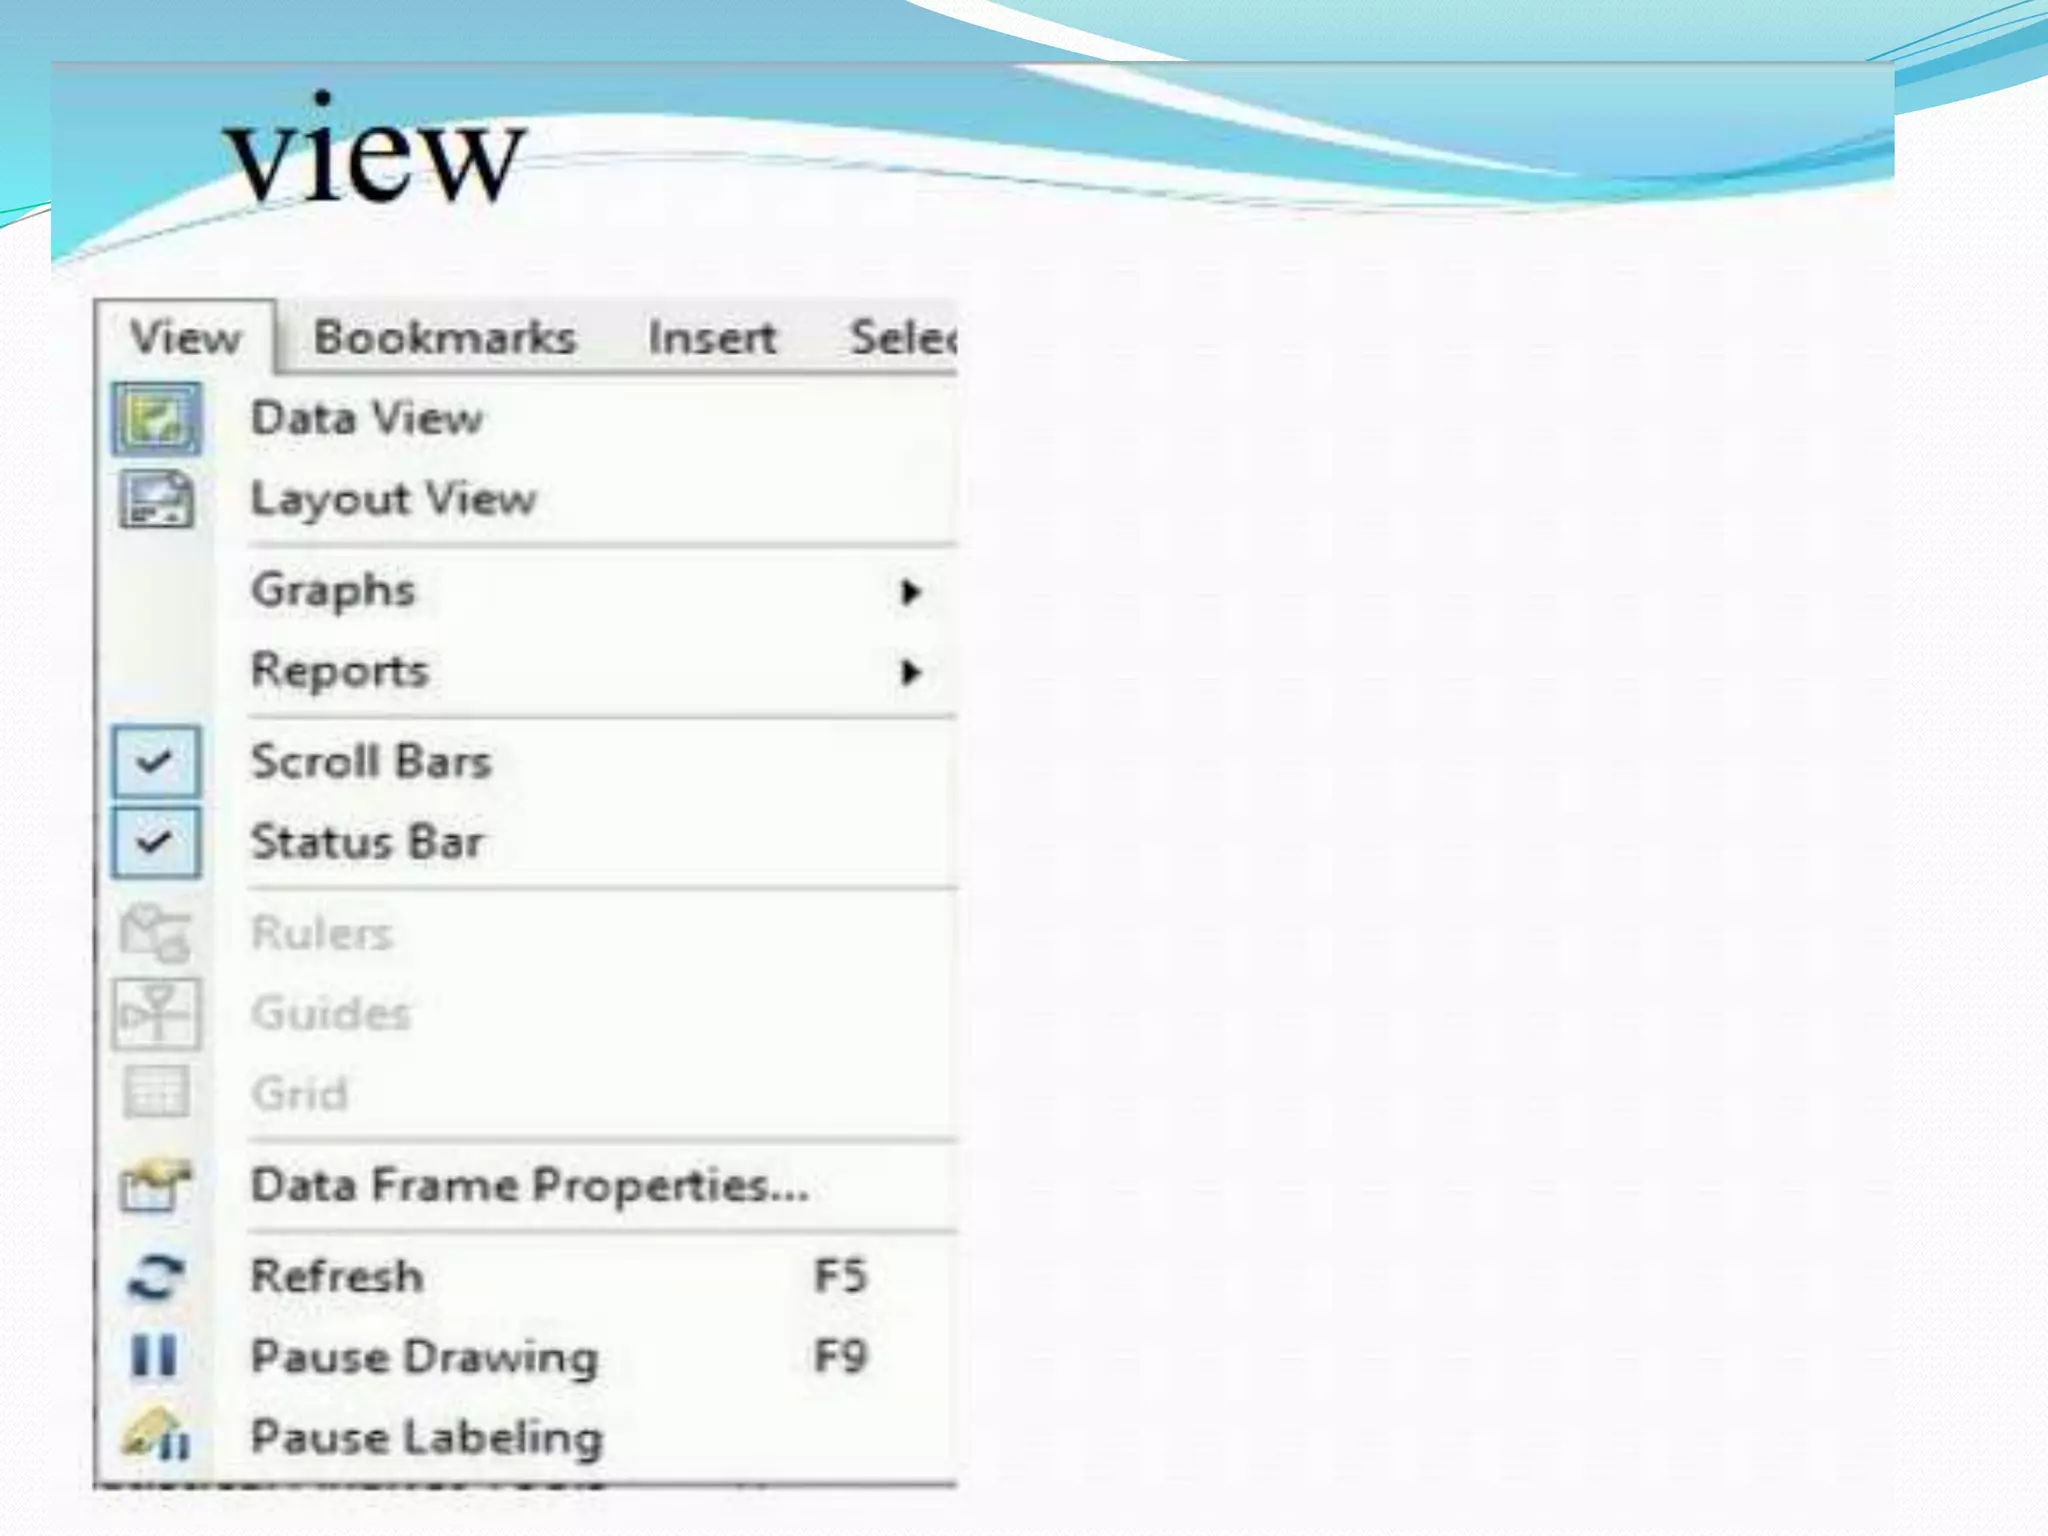
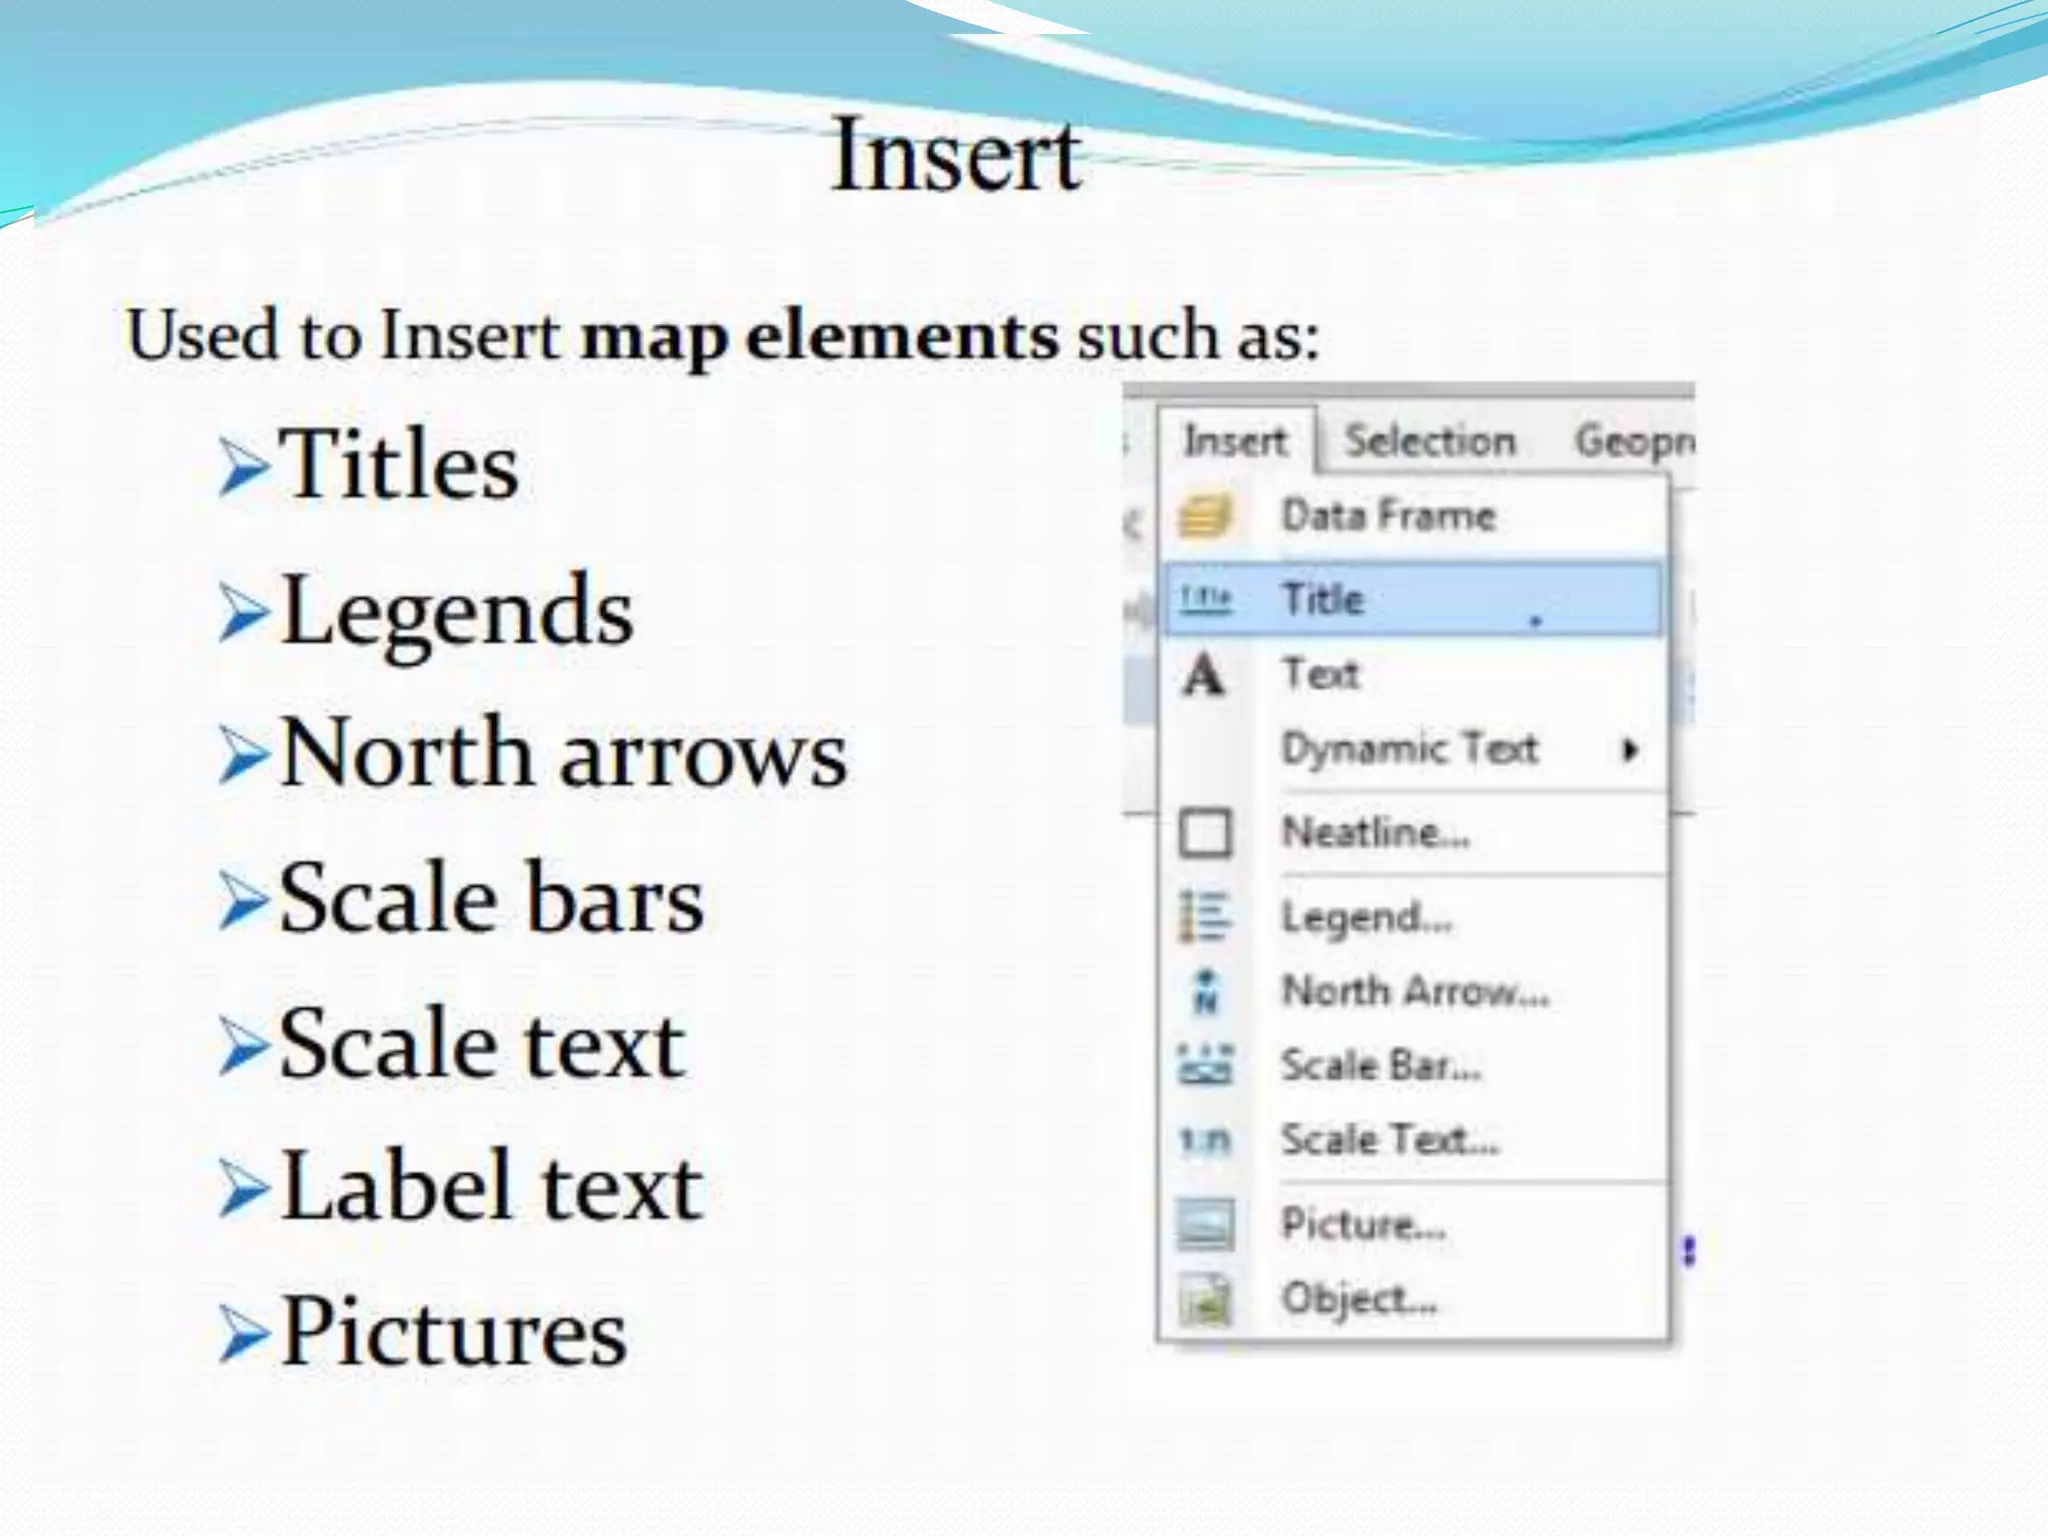
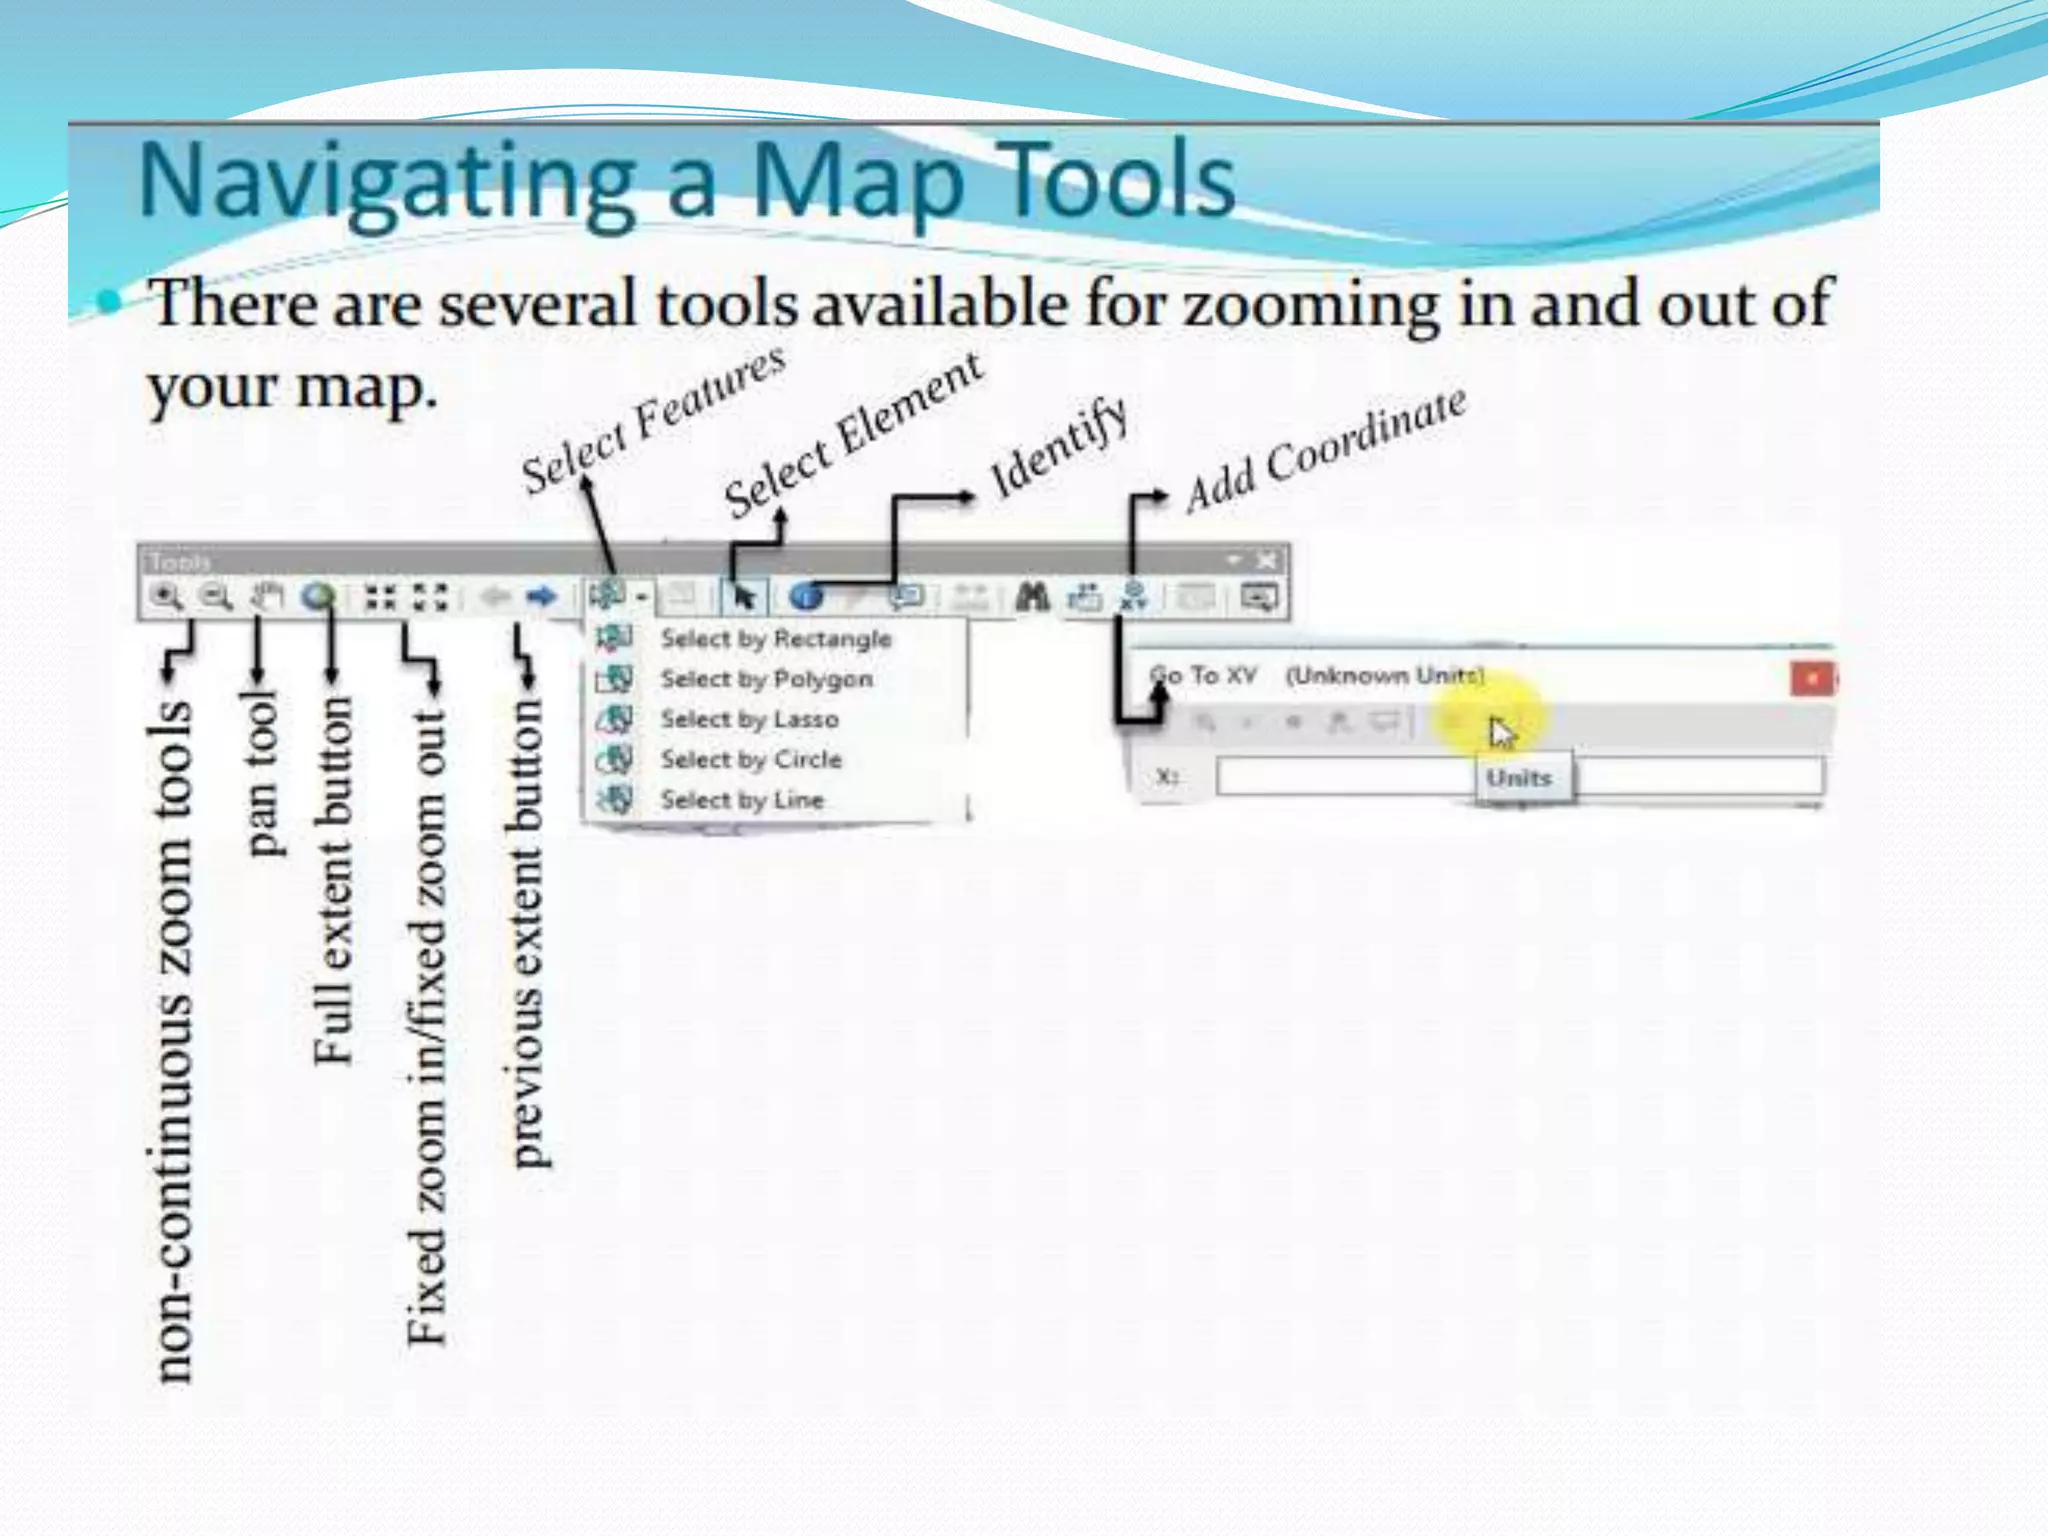
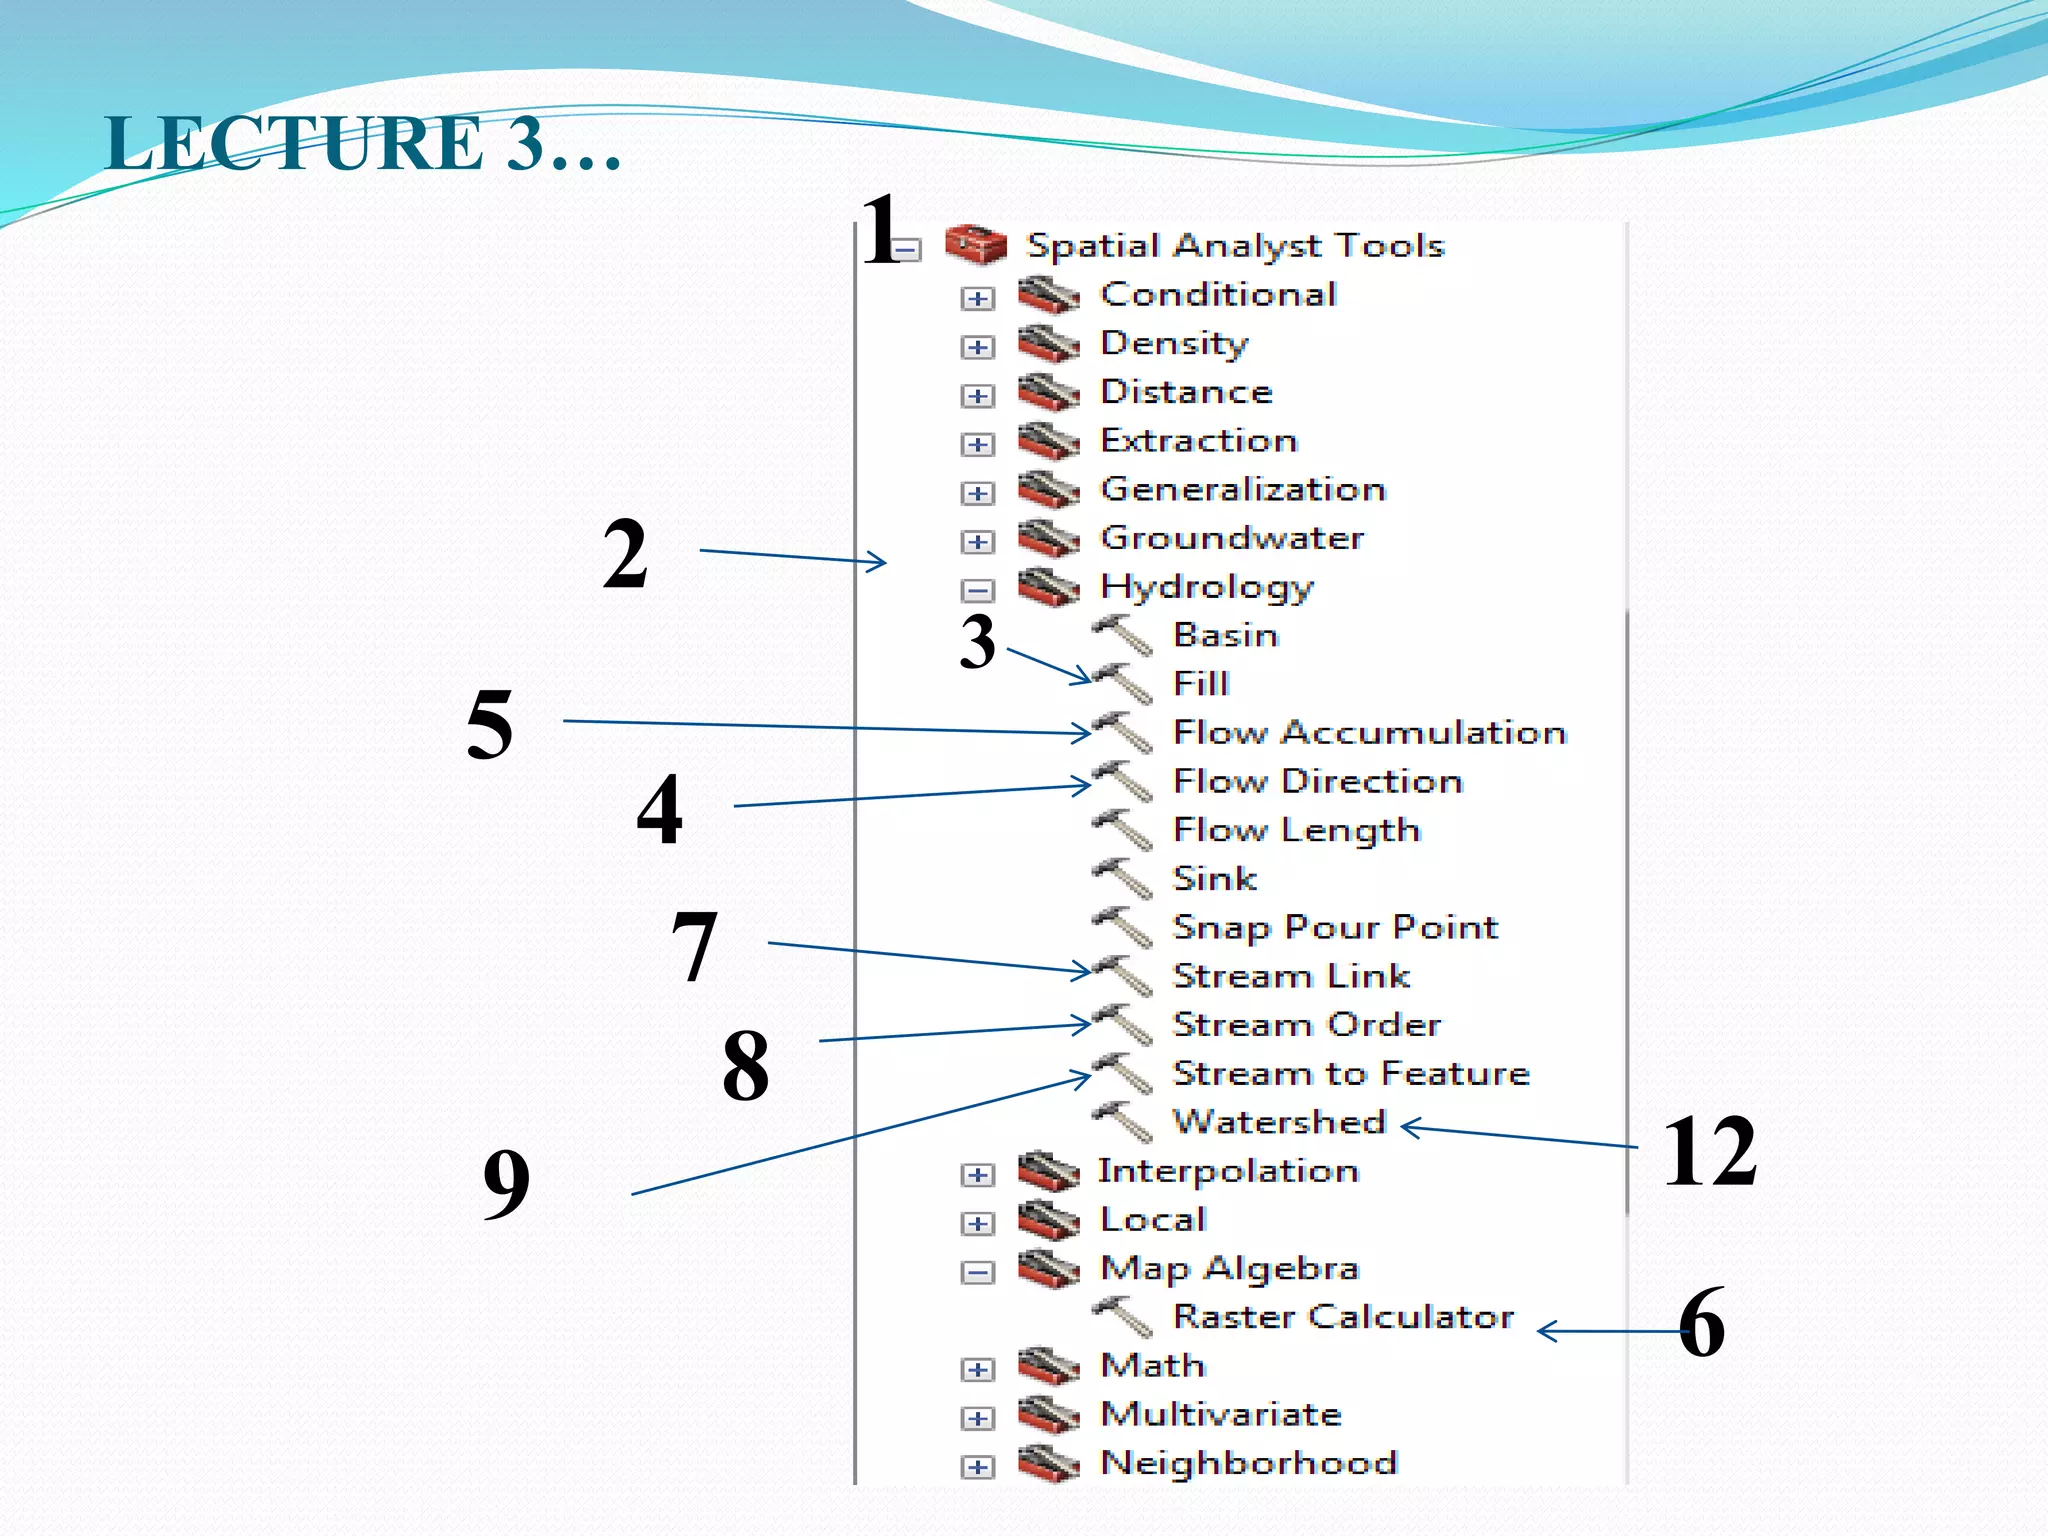
JIMMA INSTITUTE OF TECHNOLOGY (JIT)
Geographic Information System and
Remote Sensing
Computer Lab.
LECTURE 1
Remote Sensing and ArcMap
Chala H (M.Sc.)
February 2022
In the case when you need lecturer
information use blow link and contact information
 Link and reference
For videos
 https://www.youtube.com/channel/UCcpZ4UVy0dlau6
QJpFDjv2A
Lecture tutorial
 https://www.slideshare.net/chalahailu
and JU eLearning
 0000-0002-9453-4534
Remote Sensing Technology for Data Capturing
Earth Observation
Google Earth
GPS
Location Map
Please refer the following link for more
GIS tutorial for beginners
https://youtu.be/0KFRH9yZbyM
 Clip soil for the selected shape file from soil data base in
GIS
https://youtu.be/0Qqn9M5RoSw
 Watershed Delineation and Area calculation using
https://youtu.be/2D8WBZTm2-0
Extract by mask in GIS/create DEM for selected shape file
https://youtu.be/PsKyjr7l33w
Remote sensing website for data capturing
To remotely capture raster and vector data use the
following website:-1 .
For vector(shape files)
 www.diva-gis.org
For raster(DEM)
https://vertex.daac.asf.alaska.edu/#
Download 12.5m*12.5 DEM resolution using the
official website of Alaska satellite data facilities.
https://vertex.daac.asf.alaska.edu/#
ArcGIS
ArcGIS is a collection of software products created by
Environmental Systems Research Institute (Esri)
 The Microsoft of GIS software includes desktop,
server , mobile, hosted, and online GIS products.
In this course we only see Desktop GIS product.
Desktop GIS Products
The desktop GIS products allow users to integrate and
edit data, create new map layers, and author maps.
ArcGIS desktop includes a series of scaleable products.
They are all based on the same architecture, but the
more expensive products have more functionality
ArcMap 10.4.1
 ArcMap is where you create maps and access most of the ArcGIS
functionality.
 You can add and edit data, query and symbolize map layers, and
create map layouts for printing.
Starting ArcMap
 You can launch ArcMap in more than one way .
 The most common way is to click on the start menu and go to
“All Programs,” then the ArcGIS folder, then ArcMap 10.4.1
 If you don’t see ArcGIS in the list of programs, don’t worry, it
might
 still be installed on your computer. Look in c:Program Files for a
ArcGIS folder.
 Open the ArcGIS folder, then the Desktop 10.4.1 folder, then the
Bin folder inside that. Double-click on the ArcMap.exe file to start
ArcMap.
On start search tool you can search for ArcMap10.4.1.
and then click on it
if it is pined to task bar than her you can get at the
lower of your computer as follows
Arc GIS
 ArcGIS composed of 3 components: ArcMap, Arc Toolbox
and ArcCatalog
Arc Catalog
 You can add map layers from ArcCatalog, but you can
also view and add toolboxes, create geocoding services,
edit and view metadata among other important
"housekeeping” tasks.
Cont..
 The tree within the Catalog Window will include a
number of folders that are commonly used with ArcGIS. In
order to add your own map layers, you will need to
“Connect to Folder” to show ArcMap where those other
important folders reside.
 To create a connection to a new folder, click on the
“Connect To Folder” icon at the top of the Catalog
Window or right click on the folder named “Folder
Connection” and choose “Connect Folder ”
 Navigate until you find the folder with your data and click
“OK.”
Cont…
Your folder should now be listed under “Catalog” next to a
icon. One note of caution:
 You do not need to do this repeatedly . Once you have
established a connection to your folder, you will not need to
do it again unless you change computers.
 If you create a new connection to the folder each time you
use ArcGIS, your path options will become unmanageable.
If you have one directory where you store all your GIS files,
consider connecting to that rather than each individual
folder inside.
cont
 When you view map layers within ArcCatalog, you see them
the way ArcGIS sees them.
 Some of the types of files used in ArcGIS, including shape
files, coverages, and grids, are made up of multiple files that
only together create a map layer .
 If you viewed them outside of ArcCatalog (in My Computer,
for example), you would see all of the files listed with
extensions such as .dbf, .shp, .shx. Within ArcCatalog, you
will see only a single file.
 This is especially helpful when you are moving or copying
data.
Cont.….
Other ArcCatalog Functions
 You can view and edit the metadata for any of your
files.
ArcCatalog also has extensive search capabilities,
making it possible to locate files based on name,
location on your computer, geographic location, and
date.
You can create new shapefiles in ArcCatalog. This will
be described in the section “Creating New Shapefiles.”
This is used during digitizing, watershed Delineation,
etc.
Adding Data
 Unless you open an ArcView .mxd file that someone else
created, you will need to add data to get started.
 From the file menu, go to “Add data” or click on the “Add data”
button (yellow square with large black + sign) on the Standard
toolbar .
 Navigate to the folder where you have your map layers. With
ArcGIS 10, you can use the “Add Data” button to access to other
options: Add Basemap and Add Data From ArcGIS Online.
 From the “Add Basemep” option, you can import Bing and
Google aerial images, street and topo maps, and others.
 Through ArcGIS Online, you can import data many additional
layers that include data (such as zip codes with 2010 population
estimates).
 The “Add Data” option allows you to navigate to a folder and
add your own map layers.
Arc Toolbox
 The Arc Toolbox is a set of GIS tools that can do most all the
things that ArcMap can do
 ESRI refers to the tasks these tools do as Geo processing.
 Arc Toolbox provides access to geo processing
 Arc Toolbox is a dockable window in Arc Catalog or ArcMap
 Comprises a set of Tools (750+)
 More than 120 advanced geoprocessing tools.
 Tools support all data types (coverages, shape files, gdb,
raster)
 Multi- step workf low available via Model builder and/or
scripting
 Command line interface also available for traditionalists
and/or power users
Lecture 2 :Map making
5. Cartography
Cartography is about efficient communication of spatial
information to:
 answer space-related questions
 support spatial behavior
 enable spatial problem solving (reasoning, planning)
 support spatial awareness
by creation and use of maps anytime, anywhere
The map developed by the cartographer have
 Legend
 Title
 Scale
 Direction arrow and it also may have data frame grid
 Refer vidio tutorial 2 and 2.1
Map making….
Selection, extract by masking
Land use
Soil types
Reclassification
Export
Clip
Refer lecture 4 and 4.1 video tutorial
Lecture 3: Watershed delineation
Watershed is the area of land that drains down slope to the
lowest points of the terrain.
The water moves by gravity means in a network of drainage
pathways that may be underground or on the surface into a
specified body of water, river or stream.
Although there are many ways for water to enter a stream,
much of it will enter as run-off from the land.
This land is what forms the stream's watershed. However, in
some regions, the water drains to a central depression such
as a lake or marsh with no surface-water exit
Lecture 3 cont……
 LECTURE 3……..
 Water shade delineation by using ArcMap
When you save file, name should be
less than 9 letters.
In the flow direction here: 1,
2,4,8,16,32,64,128 shows direction of
flow. Example 1…. North, S,E,W,
NE,NW, SE, SW
LECTURE 3…
1
3
5
7
4
2
8
12
9
6
Cont….
 Then ArcCatalog….. New shape file…pour point…edit
Refer video tutorial given
Lecture 4
Reclassify….what is the advantage of
raster reclassify?
Conversion of Raster to point
Lecture 5
Buffer
3d analyst tool
Tin
WORKING WITH X,Y,Z
ArcScen
Buffer
 To perform neighborhood analysis we must:
 State which target locations are of interest to us, and what is
their spatial extent
 Define how to determine the neighborhood for each target
 Define which characteristic(s) must be computed for each
neighborhood
 For instance, our target might be a Water Point. Its neighborhood
could be defined as
 an area within 2 km travelling distance; or
 all roads within 500 m travelling distance; or
 all other water points (WPs) within 10 minutes travelling time;
Construct design a block of the town with 10m then road 100m and
again the next block with 300m. By using multiple buffer.
Lecture 5:Thiessen polygon Generation
In order to achieve accurate estimation of the spatial
distribution of rainfall,
It is necessary to use interpolation methods, for this,
The Thiessen method is considered as the most
important in engineering praxis.
The method of constructing the polygons implies the
following steps:
1. Gauge network is plotted on map of the catchment
area of interest.
2. Adjacent stations are connected with lines.
Cont…
3. Perpendicular bisectors of each line are
constructed (perpendicular line at the midpoint
of each line connecting two stations)
4. The bisectors are extended and used to form the
polygon around each gauge station.
5. Rainfall value for each gauge station is
multiplied by the area of each polygon.
6. All values from step 5 are summed and divided
by total basin area.
Cont…
 Although it is widely used in engineering praxis,
this method has its shortcomings.
 For example, in mountainous areas, an
irregular spatial distribution of precipitation can
be formed over small distances, and for such
circumstances the Thiessen method can yield
erroneous results.
 In order to overcome these problems, more
accurate methods are used, in which the whole
area is “rastered” and each of those rasters are
calculated according to the quadrant method.
Practical application using GIS
Calculate the area of Thiessen polygene
Area
length of Thiessen polygon
Dem generation from the survey data
Given
East
North
Elevation
Watershed delineated
Area and perimeter calculation for
Watershed
NB…. Ethiopia is Found at UTM zone
37
Geographic information system and remote sensing

Geographic information system and remote sensing

  • 1.
    JIMMA INSTITUTE OFTECHNOLOGY (JIT) Geographic Information System and Remote Sensing Computer Lab. LECTURE 1 Remote Sensing and ArcMap Chala H (M.Sc.) February 2022
  • 2.
    In the casewhen you need lecturer information use blow link and contact information  Link and reference For videos  https://www.youtube.com/channel/UCcpZ4UVy0dlau6 QJpFDjv2A Lecture tutorial  https://www.slideshare.net/chalahailu and JU eLearning  0000-0002-9453-4534
  • 3.
    Remote Sensing Technologyfor Data Capturing Earth Observation Google Earth GPS Location Map
  • 4.
    Please refer thefollowing link for more GIS tutorial for beginners https://youtu.be/0KFRH9yZbyM  Clip soil for the selected shape file from soil data base in GIS https://youtu.be/0Qqn9M5RoSw  Watershed Delineation and Area calculation using https://youtu.be/2D8WBZTm2-0 Extract by mask in GIS/create DEM for selected shape file https://youtu.be/PsKyjr7l33w
  • 5.
    Remote sensing websitefor data capturing Remote sensing website for data capturing To remotely capture raster and vector data use the following website:-1 . For vector(shape files)  www.diva-gis.org For raster(DEM) https://vertex.daac.asf.alaska.edu/# Download 12.5m*12.5 DEM resolution using the official website of Alaska satellite data facilities. https://vertex.daac.asf.alaska.edu/#
  • 6.
    ArcGIS ArcGIS is acollection of software products created by Environmental Systems Research Institute (Esri)  The Microsoft of GIS software includes desktop, server , mobile, hosted, and online GIS products. In this course we only see Desktop GIS product. Desktop GIS Products The desktop GIS products allow users to integrate and edit data, create new map layers, and author maps. ArcGIS desktop includes a series of scaleable products. They are all based on the same architecture, but the more expensive products have more functionality
  • 7.
    ArcMap 10.4.1  ArcMapis where you create maps and access most of the ArcGIS functionality.  You can add and edit data, query and symbolize map layers, and create map layouts for printing. Starting ArcMap  You can launch ArcMap in more than one way .  The most common way is to click on the start menu and go to “All Programs,” then the ArcGIS folder, then ArcMap 10.4.1  If you don’t see ArcGIS in the list of programs, don’t worry, it might  still be installed on your computer. Look in c:Program Files for a ArcGIS folder.  Open the ArcGIS folder, then the Desktop 10.4.1 folder, then the Bin folder inside that. Double-click on the ArcMap.exe file to start ArcMap.
  • 9.
    On start searchtool you can search for ArcMap10.4.1. and then click on it if it is pined to task bar than her you can get at the lower of your computer as follows
  • 10.
    Arc GIS  ArcGIScomposed of 3 components: ArcMap, Arc Toolbox and ArcCatalog
  • 11.
    Arc Catalog  Youcan add map layers from ArcCatalog, but you can also view and add toolboxes, create geocoding services, edit and view metadata among other important "housekeeping” tasks.
  • 12.
    Cont..  The treewithin the Catalog Window will include a number of folders that are commonly used with ArcGIS. In order to add your own map layers, you will need to “Connect to Folder” to show ArcMap where those other important folders reside.  To create a connection to a new folder, click on the “Connect To Folder” icon at the top of the Catalog Window or right click on the folder named “Folder Connection” and choose “Connect Folder ”  Navigate until you find the folder with your data and click “OK.”
  • 13.
    Cont… Your folder shouldnow be listed under “Catalog” next to a icon. One note of caution:  You do not need to do this repeatedly . Once you have established a connection to your folder, you will not need to do it again unless you change computers.  If you create a new connection to the folder each time you use ArcGIS, your path options will become unmanageable. If you have one directory where you store all your GIS files, consider connecting to that rather than each individual folder inside.
  • 14.
    cont  When youview map layers within ArcCatalog, you see them the way ArcGIS sees them.  Some of the types of files used in ArcGIS, including shape files, coverages, and grids, are made up of multiple files that only together create a map layer .  If you viewed them outside of ArcCatalog (in My Computer, for example), you would see all of the files listed with extensions such as .dbf, .shp, .shx. Within ArcCatalog, you will see only a single file.  This is especially helpful when you are moving or copying data.
  • 15.
    Cont.…. Other ArcCatalog Functions You can view and edit the metadata for any of your files. ArcCatalog also has extensive search capabilities, making it possible to locate files based on name, location on your computer, geographic location, and date. You can create new shapefiles in ArcCatalog. This will be described in the section “Creating New Shapefiles.” This is used during digitizing, watershed Delineation, etc.
  • 31.
    Adding Data  Unlessyou open an ArcView .mxd file that someone else created, you will need to add data to get started.  From the file menu, go to “Add data” or click on the “Add data” button (yellow square with large black + sign) on the Standard toolbar .  Navigate to the folder where you have your map layers. With ArcGIS 10, you can use the “Add Data” button to access to other options: Add Basemap and Add Data From ArcGIS Online.  From the “Add Basemep” option, you can import Bing and Google aerial images, street and topo maps, and others.  Through ArcGIS Online, you can import data many additional layers that include data (such as zip codes with 2010 population estimates).  The “Add Data” option allows you to navigate to a folder and add your own map layers.
  • 33.
    Arc Toolbox  TheArc Toolbox is a set of GIS tools that can do most all the things that ArcMap can do  ESRI refers to the tasks these tools do as Geo processing.  Arc Toolbox provides access to geo processing  Arc Toolbox is a dockable window in Arc Catalog or ArcMap  Comprises a set of Tools (750+)  More than 120 advanced geoprocessing tools.  Tools support all data types (coverages, shape files, gdb, raster)  Multi- step workf low available via Model builder and/or scripting  Command line interface also available for traditionalists and/or power users
  • 36.
    Lecture 2 :Mapmaking 5. Cartography Cartography is about efficient communication of spatial information to:  answer space-related questions  support spatial behavior  enable spatial problem solving (reasoning, planning)  support spatial awareness by creation and use of maps anytime, anywhere The map developed by the cartographer have  Legend  Title  Scale  Direction arrow and it also may have data frame grid  Refer vidio tutorial 2 and 2.1
  • 37.
    Map making…. Selection, extractby masking Land use Soil types Reclassification Export Clip Refer lecture 4 and 4.1 video tutorial
  • 38.
    Lecture 3: Watersheddelineation Watershed is the area of land that drains down slope to the lowest points of the terrain. The water moves by gravity means in a network of drainage pathways that may be underground or on the surface into a specified body of water, river or stream. Although there are many ways for water to enter a stream, much of it will enter as run-off from the land. This land is what forms the stream's watershed. However, in some regions, the water drains to a central depression such as a lake or marsh with no surface-water exit
  • 39.
  • 40.
     LECTURE 3…….. Water shade delineation by using ArcMap When you save file, name should be less than 9 letters. In the flow direction here: 1, 2,4,8,16,32,64,128 shows direction of flow. Example 1…. North, S,E,W, NE,NW, SE, SW
  • 41.
  • 42.
    Cont….  Then ArcCatalog…..New shape file…pour point…edit Refer video tutorial given
  • 43.
    Lecture 4 Reclassify….what isthe advantage of raster reclassify? Conversion of Raster to point
  • 44.
    Lecture 5 Buffer 3d analysttool Tin WORKING WITH X,Y,Z ArcScen
  • 45.
    Buffer  To performneighborhood analysis we must:  State which target locations are of interest to us, and what is their spatial extent  Define how to determine the neighborhood for each target  Define which characteristic(s) must be computed for each neighborhood  For instance, our target might be a Water Point. Its neighborhood could be defined as  an area within 2 km travelling distance; or  all roads within 500 m travelling distance; or  all other water points (WPs) within 10 minutes travelling time; Construct design a block of the town with 10m then road 100m and again the next block with 300m. By using multiple buffer.
  • 46.
    Lecture 5:Thiessen polygonGeneration In order to achieve accurate estimation of the spatial distribution of rainfall, It is necessary to use interpolation methods, for this, The Thiessen method is considered as the most important in engineering praxis. The method of constructing the polygons implies the following steps: 1. Gauge network is plotted on map of the catchment area of interest. 2. Adjacent stations are connected with lines.
  • 47.
    Cont… 3. Perpendicular bisectorsof each line are constructed (perpendicular line at the midpoint of each line connecting two stations) 4. The bisectors are extended and used to form the polygon around each gauge station. 5. Rainfall value for each gauge station is multiplied by the area of each polygon. 6. All values from step 5 are summed and divided by total basin area.
  • 48.
    Cont…  Although itis widely used in engineering praxis, this method has its shortcomings.  For example, in mountainous areas, an irregular spatial distribution of precipitation can be formed over small distances, and for such circumstances the Thiessen method can yield erroneous results.  In order to overcome these problems, more accurate methods are used, in which the whole area is “rastered” and each of those rasters are calculated according to the quadrant method.
  • 49.
    Practical application usingGIS Calculate the area of Thiessen polygene Area length of Thiessen polygon
  • 50.
    Dem generation fromthe survey data Given East North Elevation
  • 51.
    Watershed delineated Area andperimeter calculation for Watershed NB…. Ethiopia is Found at UTM zone 37