Download to read offline
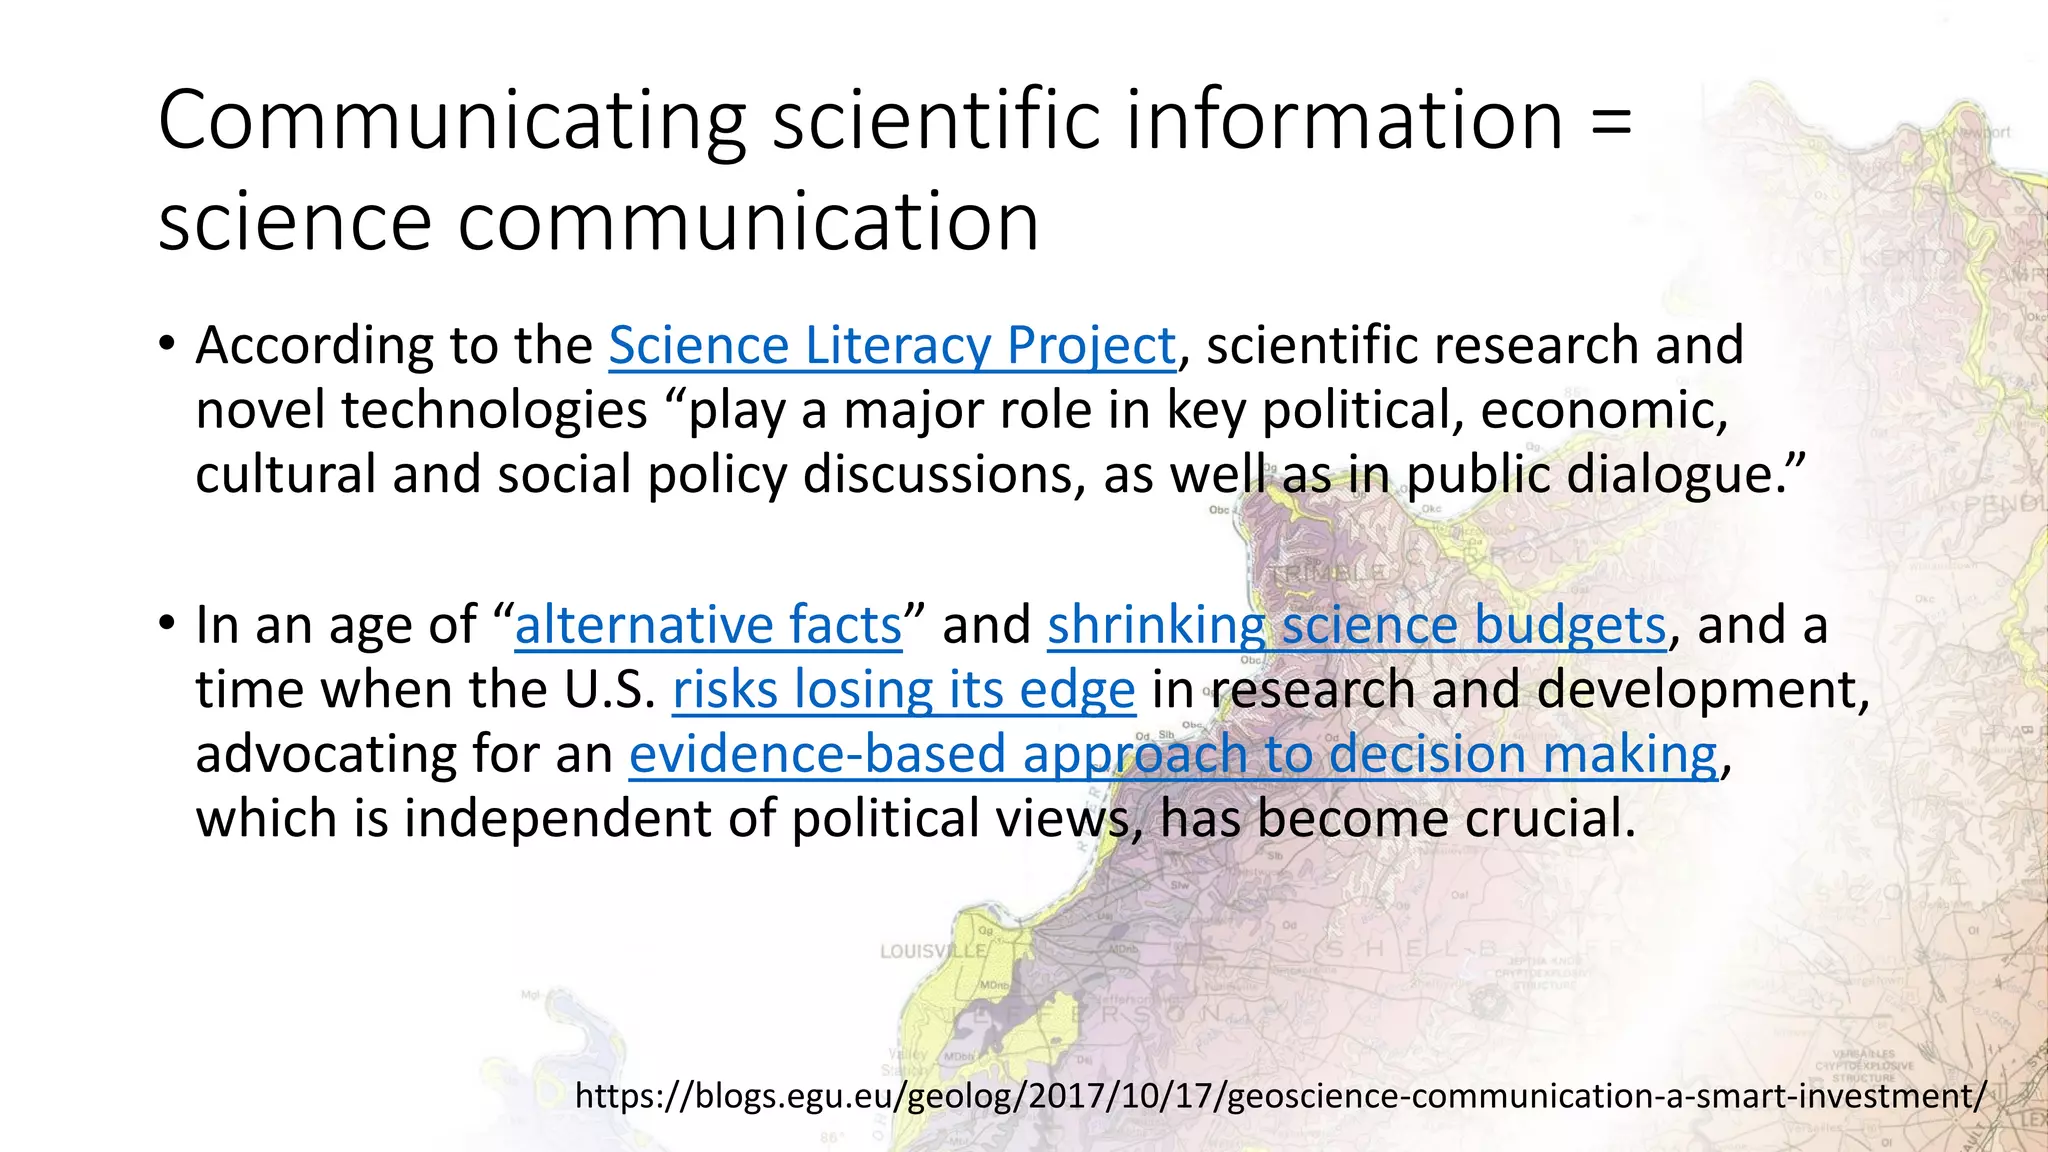


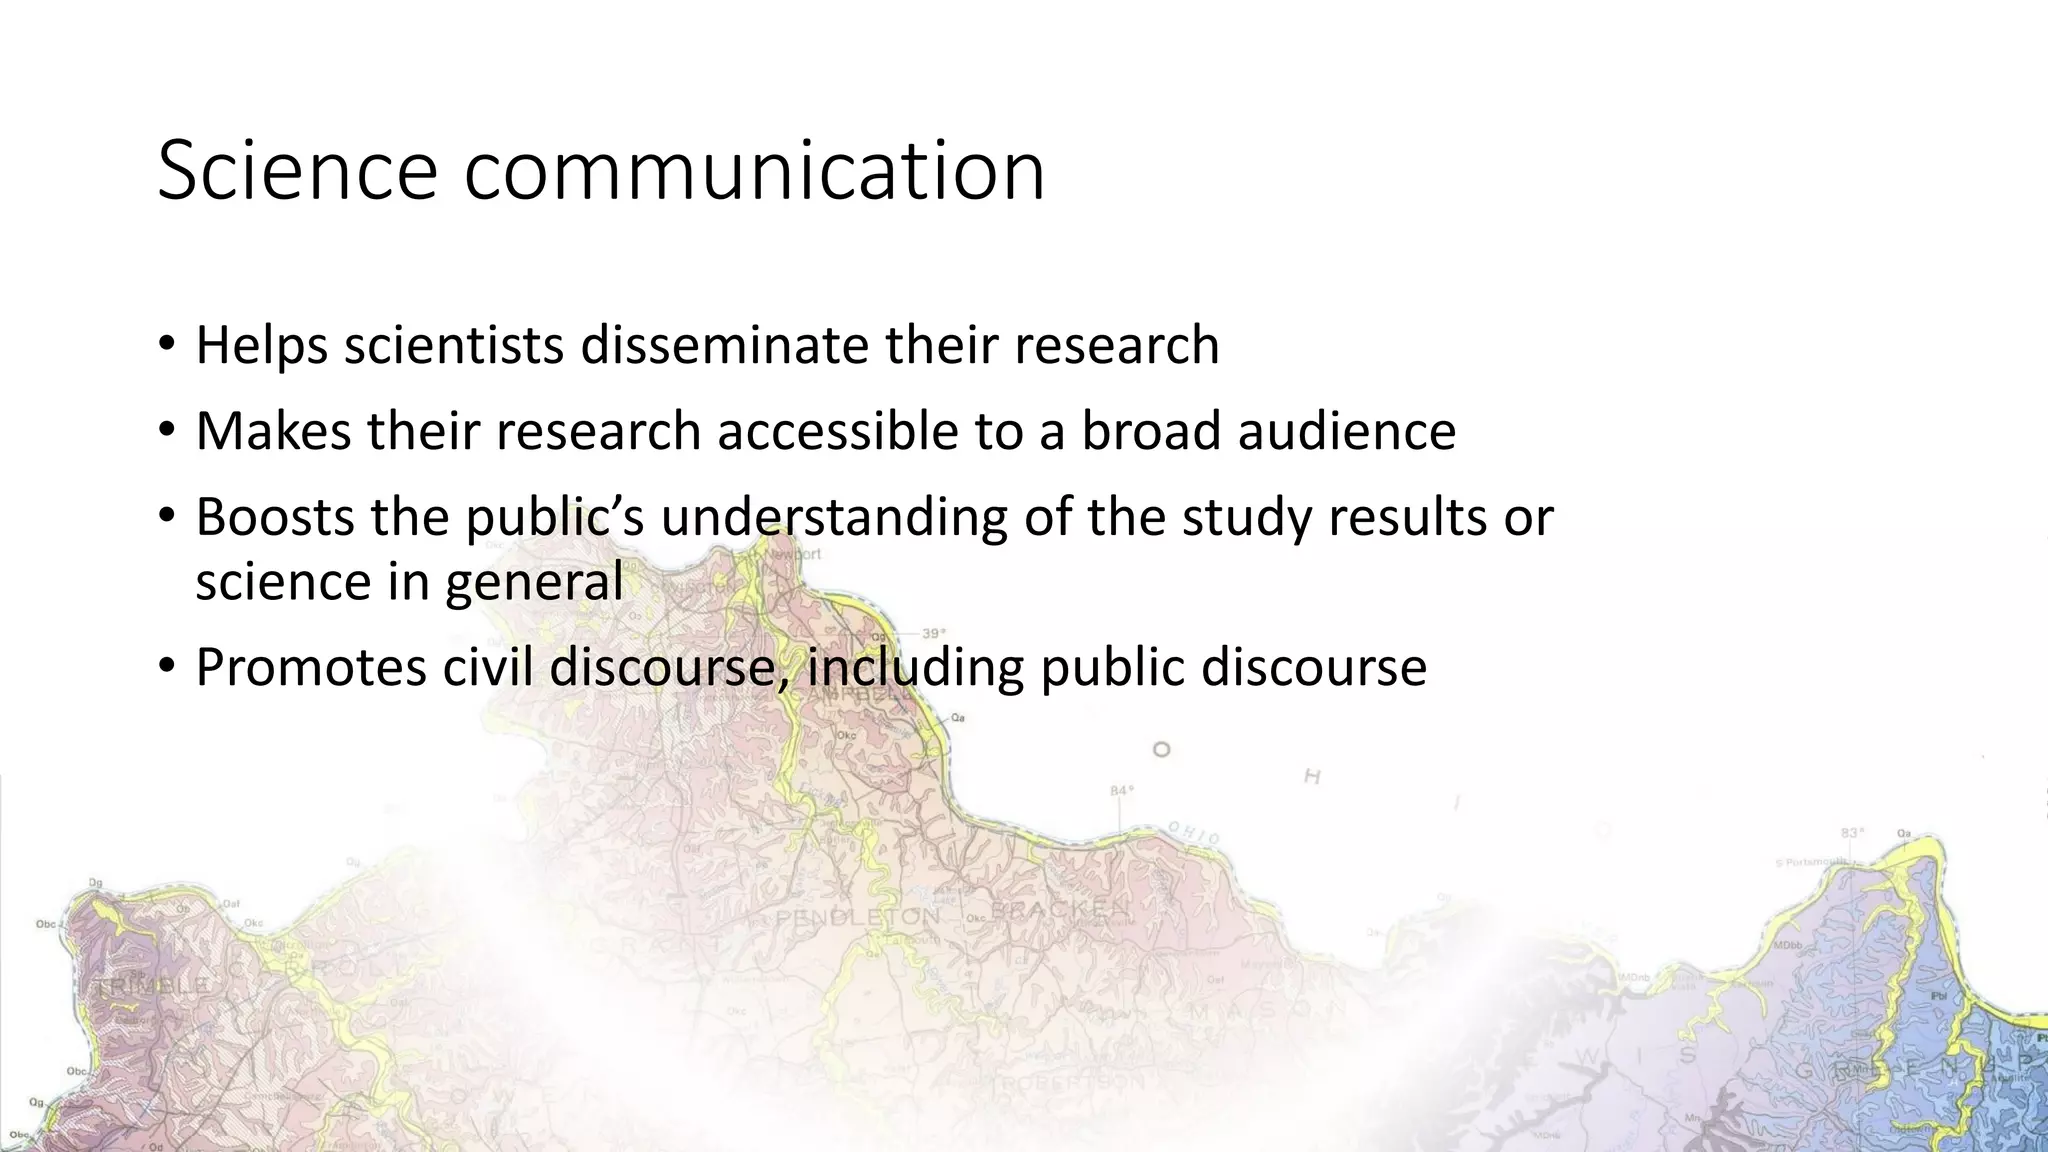
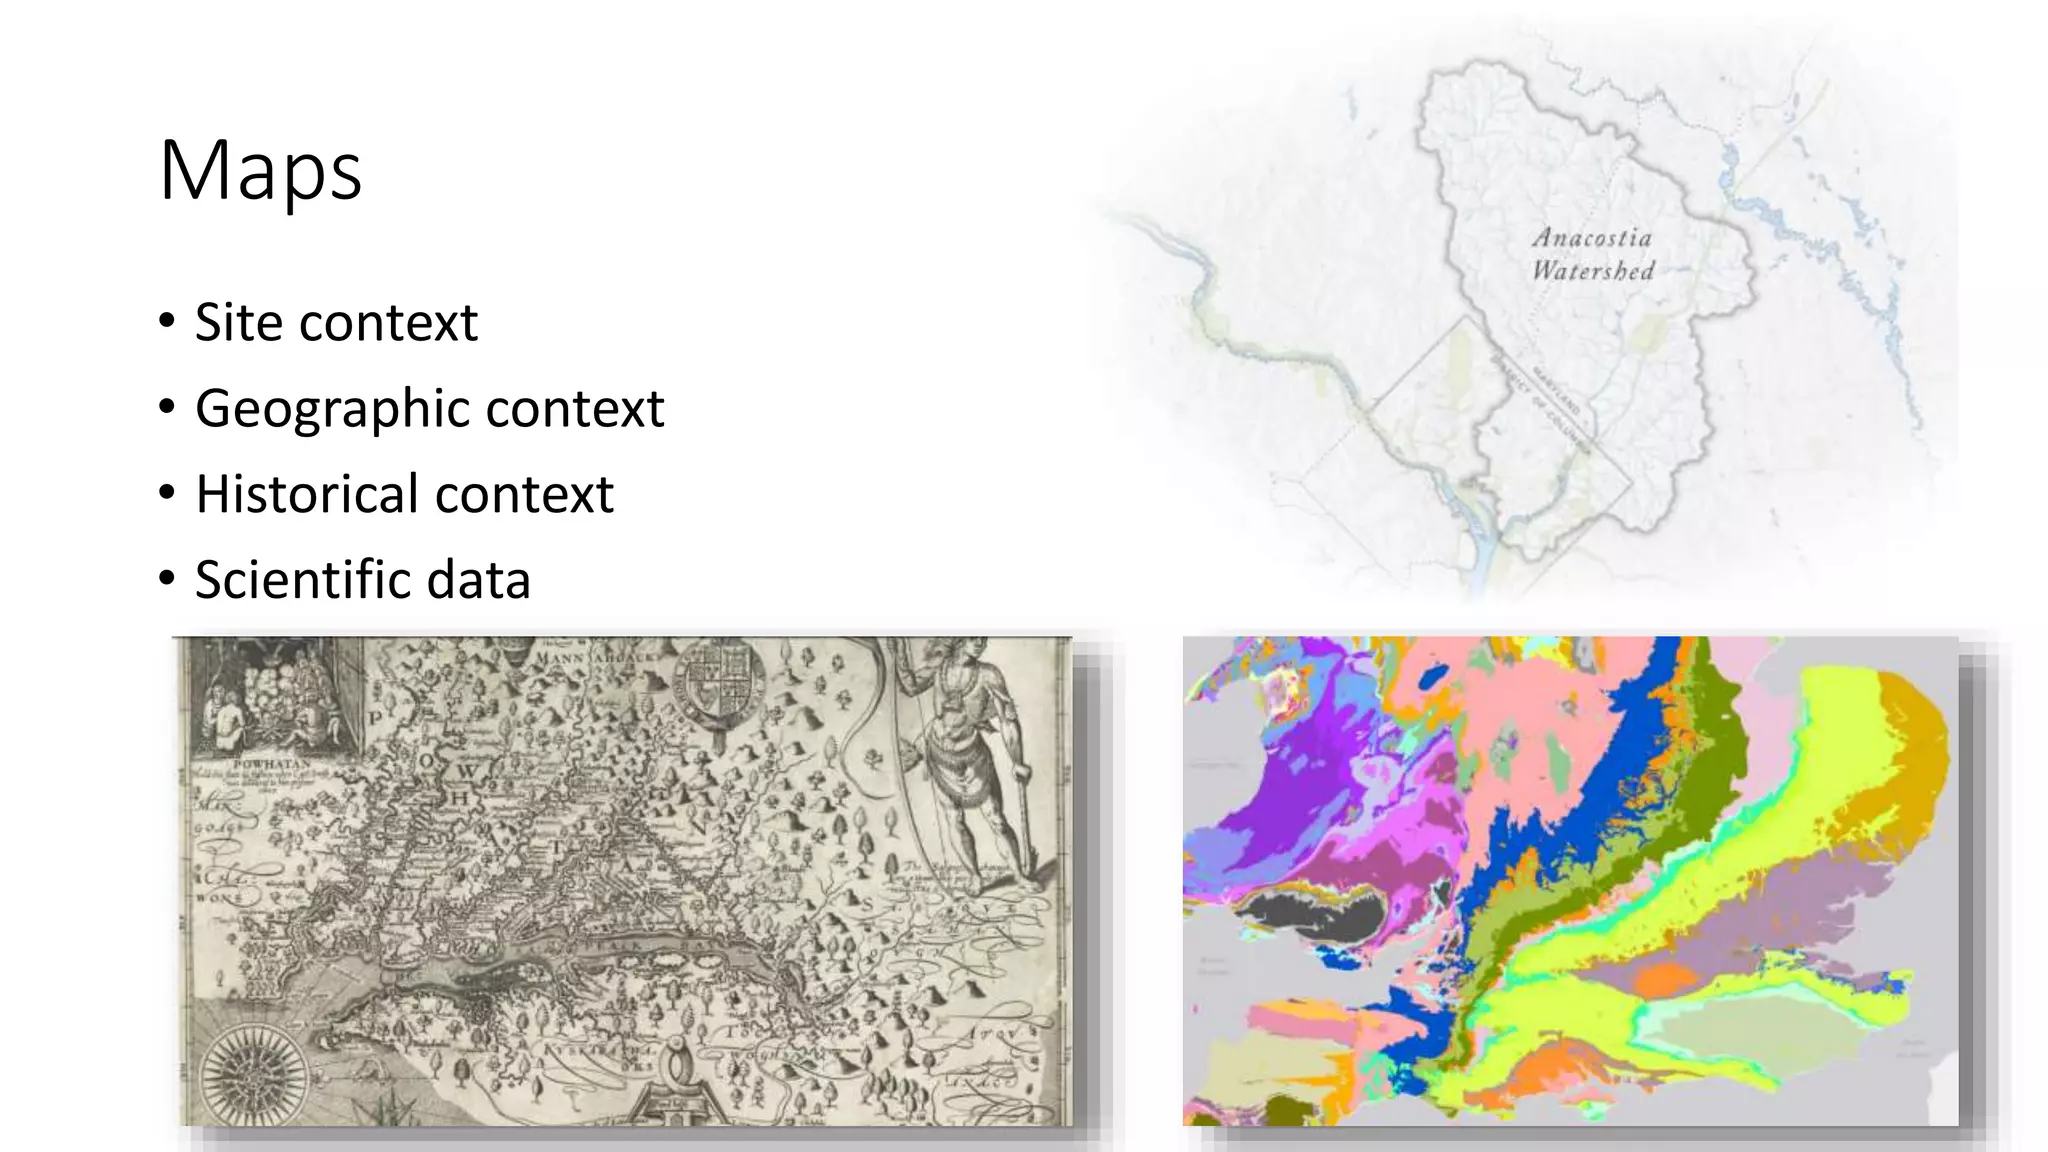
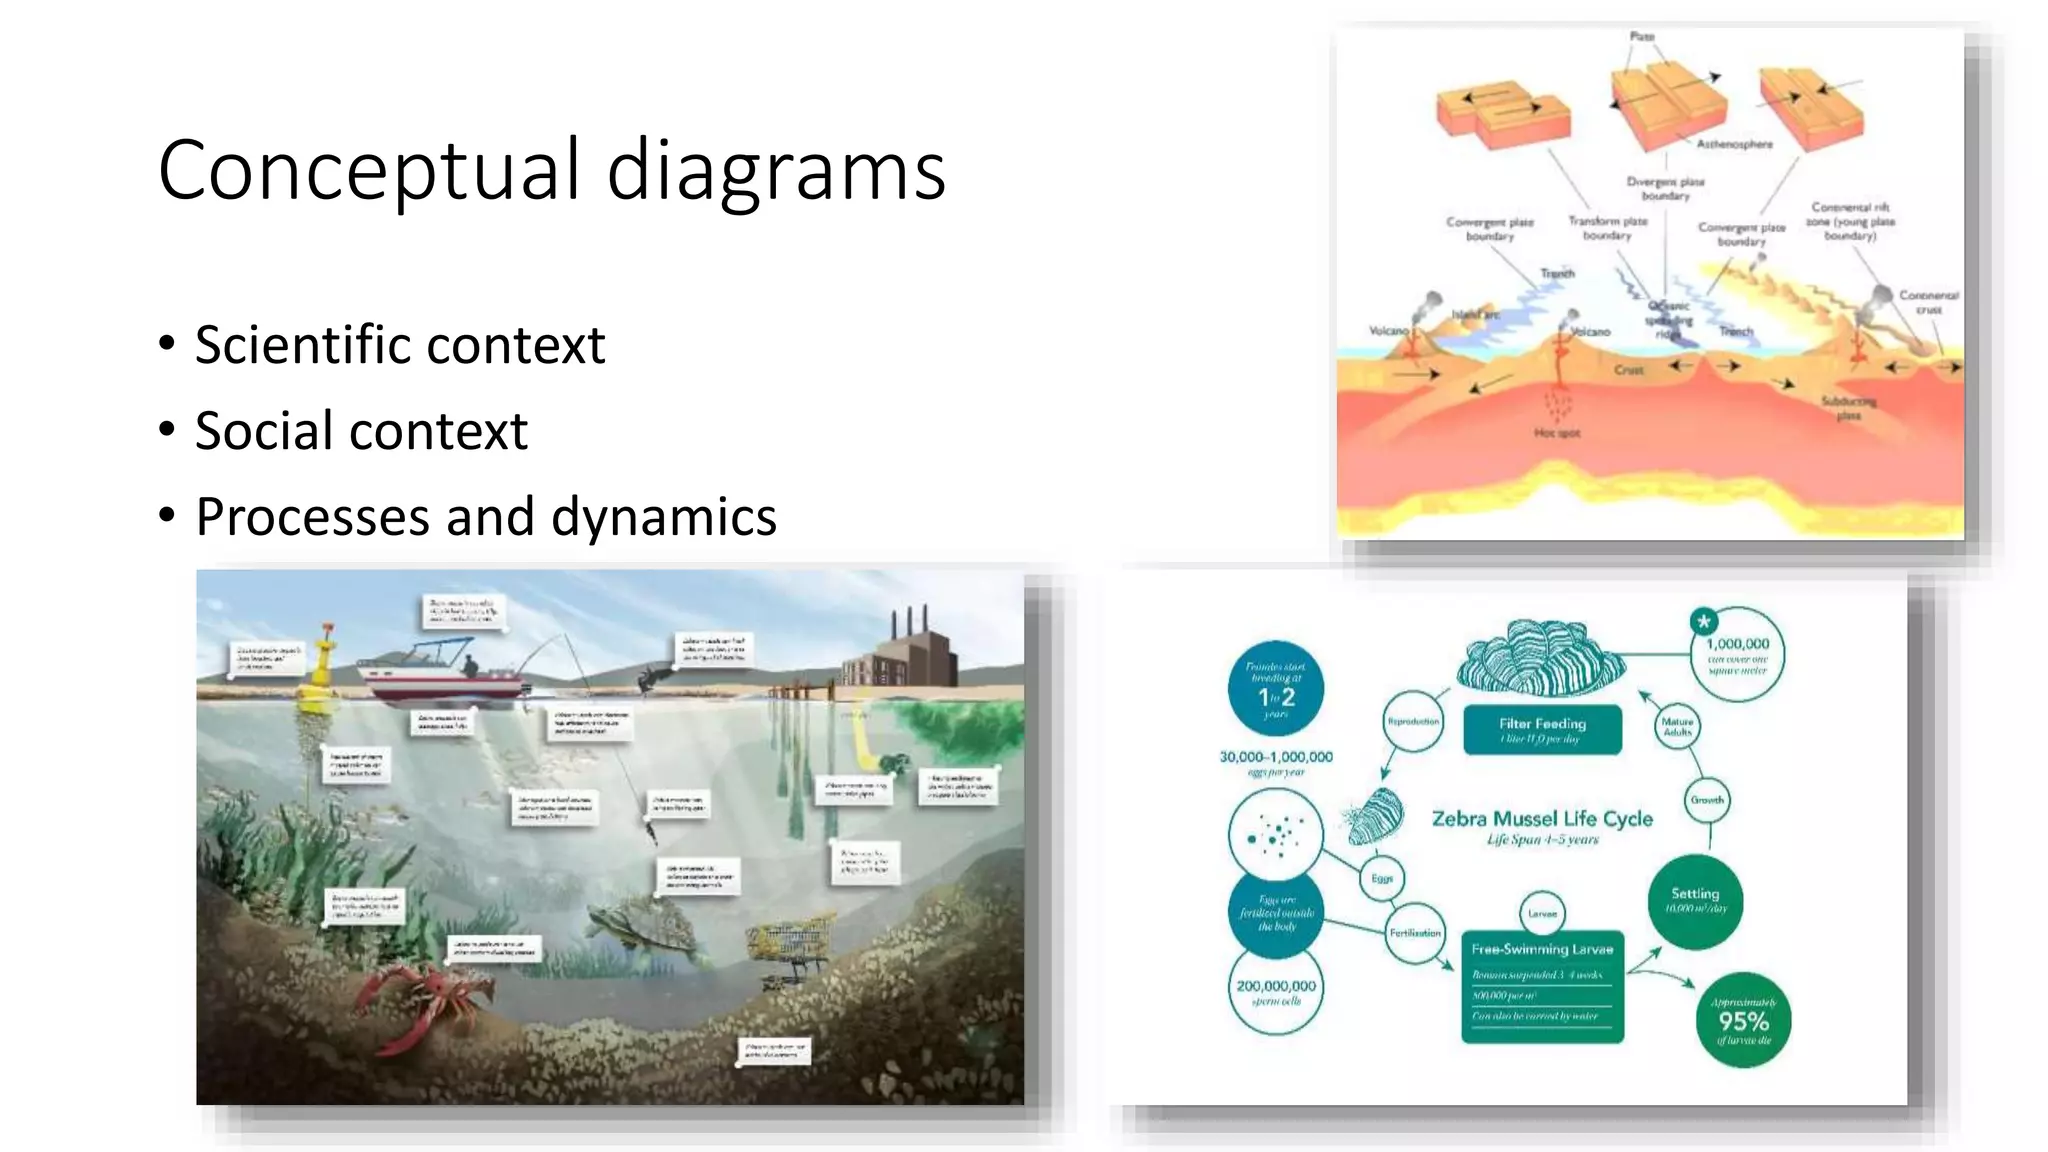
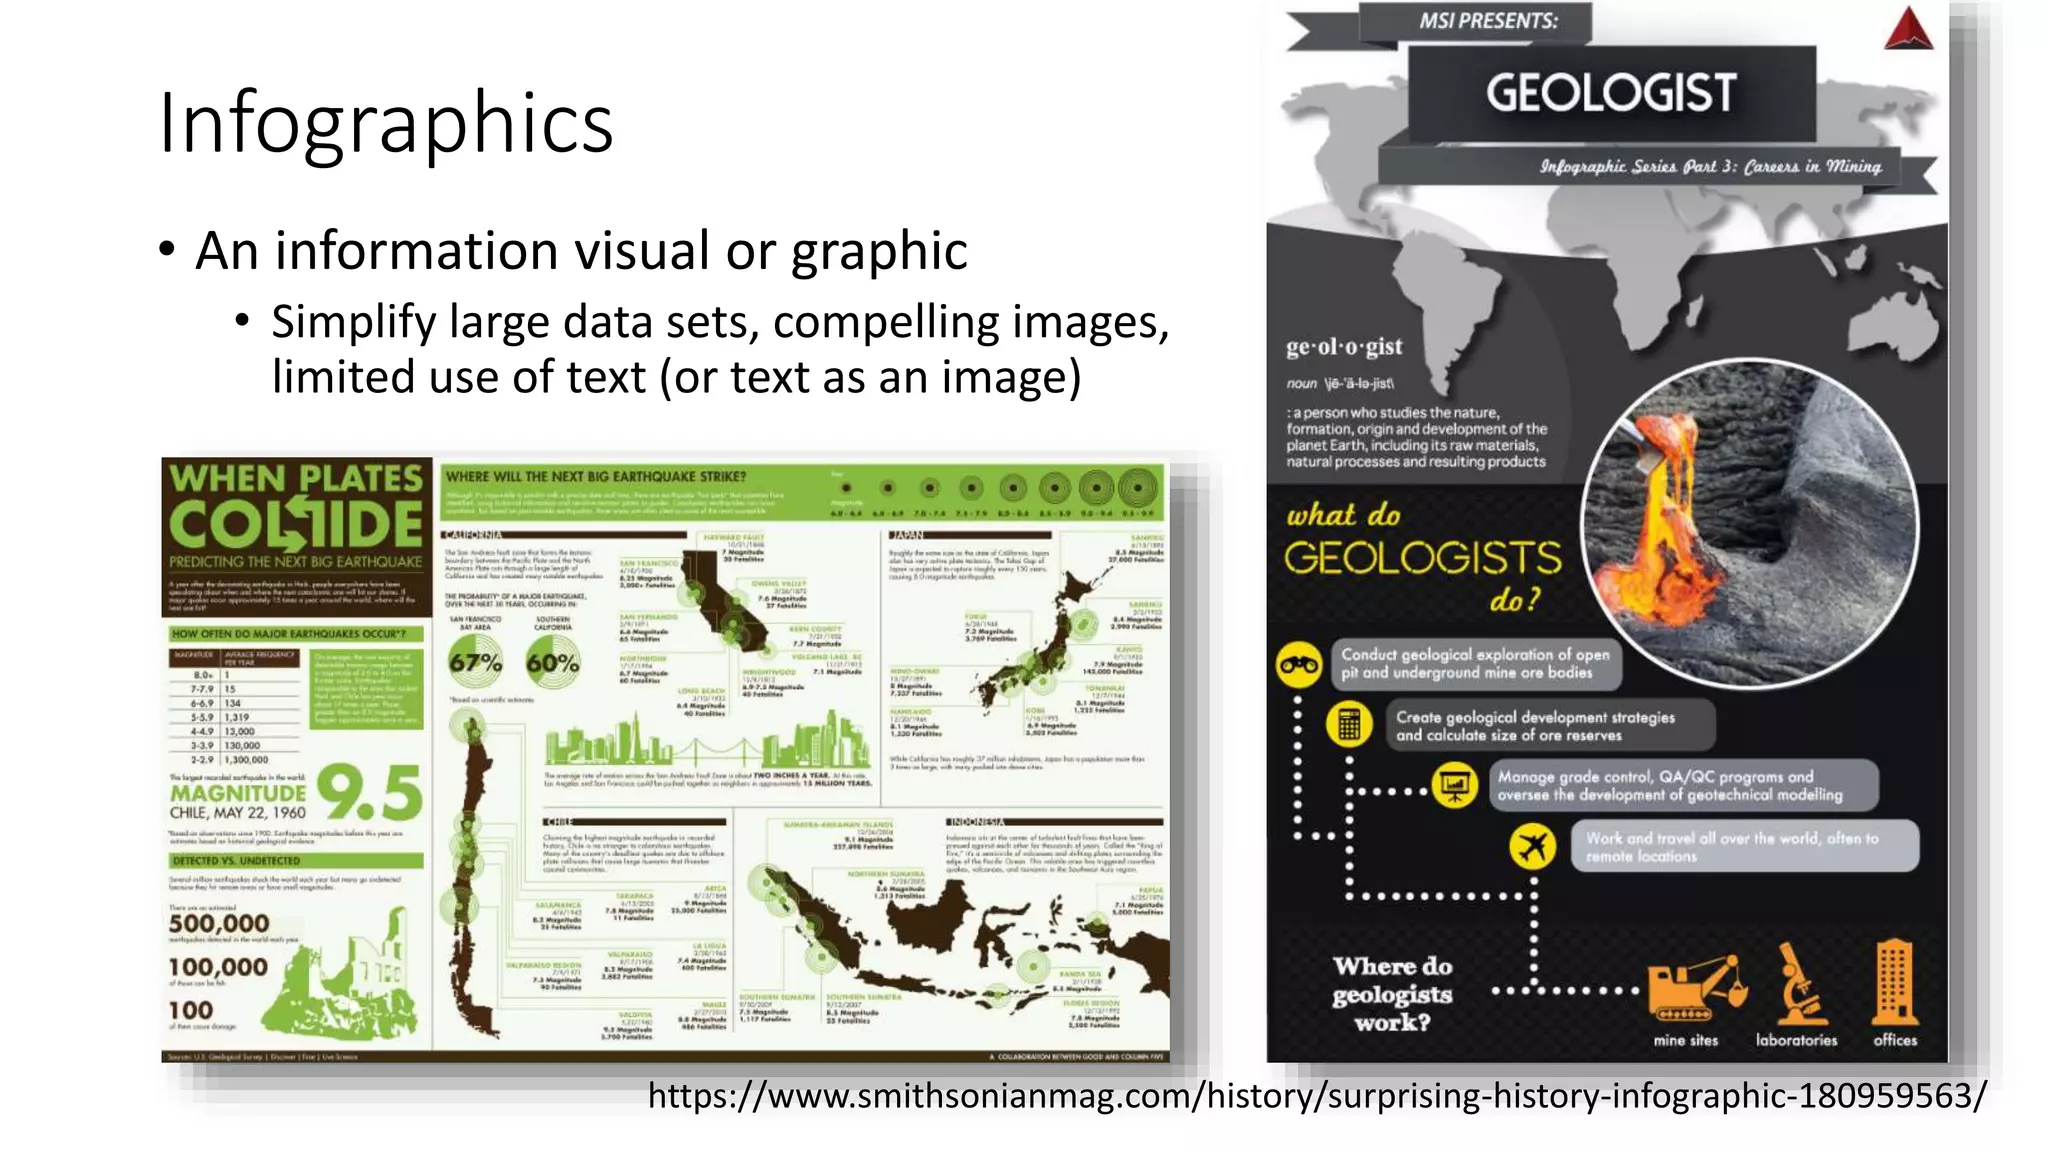

The document discusses the importance of effective science communication in making scientific research accessible and understandable to the public, particularly in an age of misinformation. It emphasizes various methods for visually communicating scientific data, including maps, infographics, and story maps, which help enhance public engagement and understanding. The document also highlights resources and tools available for improving science communication among geoscientists and the broader community.