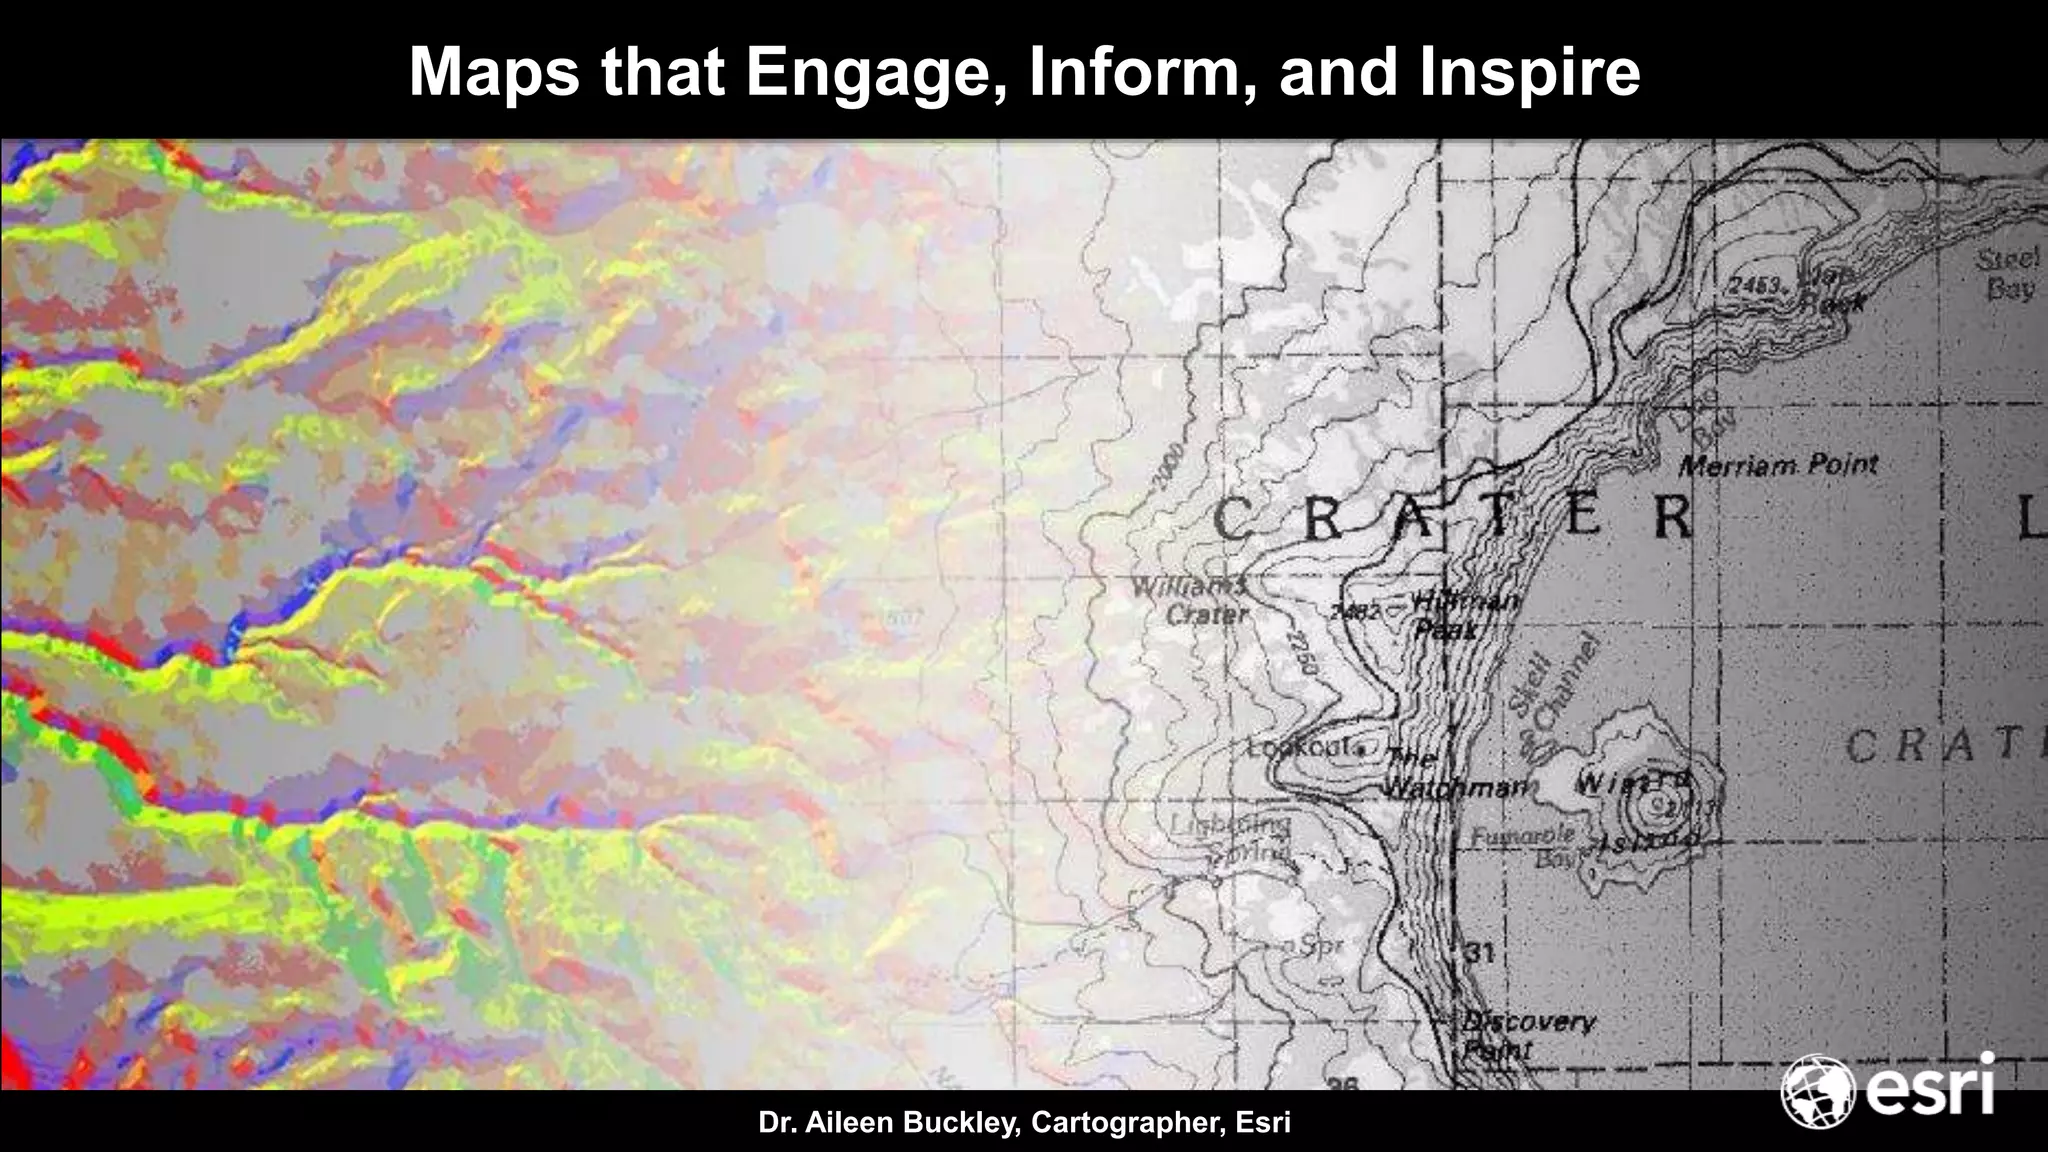
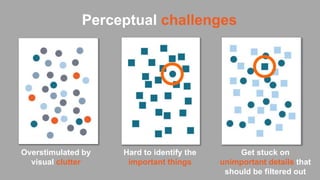
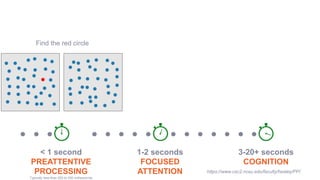
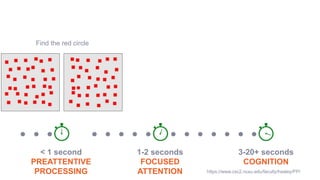
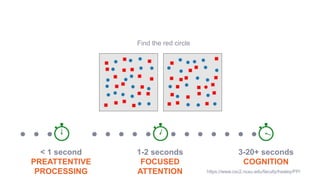
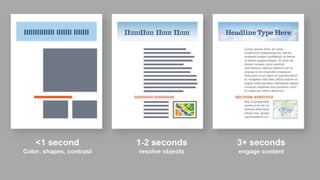
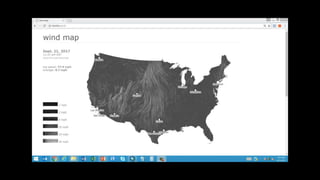
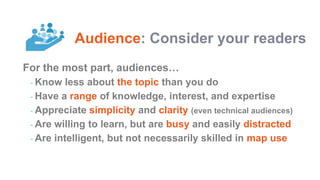
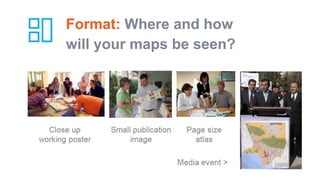
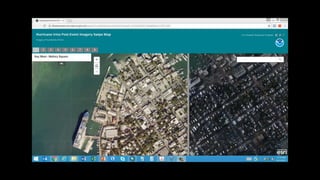
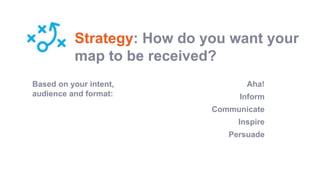
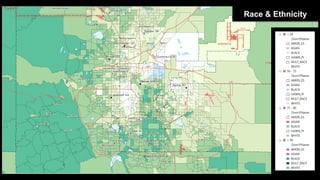
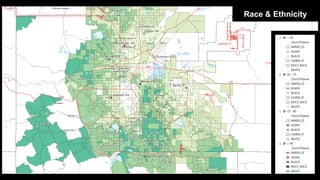
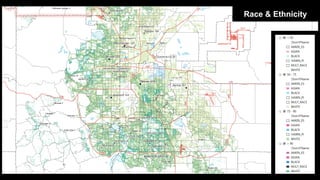
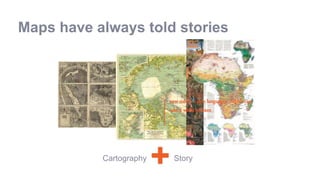
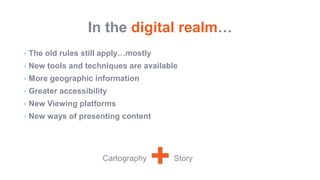
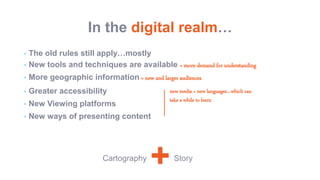
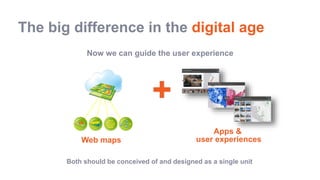
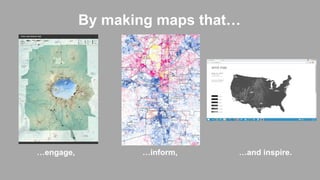
Dr. Aileen Buckley, Cartographer, Esri
Maps that Engage, Inform, and Inspire
Make maps that people are willing to look at long enough to learn something from,
and even prompt them to take action
The goal
Maps, not
data dumps
"Map showing the distribution of the slave population of the Southern states of the United States. Compiled from the census
of 1860. Drawn by E. Hergesheimer. Engr. by Th. Leonhardt." Library of Congress, American Memory Map Collections.
Francis Bicknell Carpenter’s portrait titled First Reading of the Emancipation Proclamation of President Lincoln, 1864, oil on canvas.
How visual perception works
You see something
The image is
sent to your brain
Your brain processes
the image
http://sketchingspirit.typepad.com/sketchingspirit/2011/06/denver-colorado-skyline.html
Let’s says that “seeing something” is
really “legibility”
The ability to be seen… …and recognized
https://www.flickr.com/photos/paul_heaston/8798290688/
Legibility depends on size and contrast
Map Use: Reading, Analysis, Interpretation, 8th edition, Figure 6.13
Field of view
Field of view
Too dark Too lightJust right
Map Use: Reading, Analysis, Interpretation, 8th edition, Figure 6.9
Legibility also depends on contrast
Map Use: Reading, Analysis, Interpretation, 8th edition, Figure 6.7
Visual contrast
The ability to be recognized depends on
many things
< 1 second
SEEING
1-2 seconds
PROCESSING
3-20+ seconds
COGNITION
(cognitioning, cogitating,???)
https://www.flickr.com/photos/paul_heaston/8798290688/
Perceptual challenges
Overstimulated by
visual clutter
Get stuck on
unimportant details that
should be filtered out
Hard to identify the
important things
https://www.csc2.ncsu.edu/faculty/healey/PP/
Find the red circle
< 1 second
PREATTENTIVE
PROCESSING
Typically less than 200 to 250 milliseconds
1-2 seconds
FOCUSED
ATTENTION
3-20+ seconds
COGNITION
https://www.csc2.ncsu.edu/faculty/healey/PP/
Find the red circle
< 1 second
PREATTENTIVE
PROCESSING
1-2 seconds
FOCUSED
ATTENTION
3-20+ seconds
COGNITION
< 1 second
PREATTENTIVE
PROCESSING
1-2 seconds
FOCUSED
ATTENTION
3-20+ seconds
COGNITION
Find the red circle
https://www.csc2.ncsu.edu/faculty/healey/PP/
< 1 second
PREATTENTIVE
PROCESSING
1-2 seconds
FOCUSED
ATTENTION
3-20+ seconds
COGNITION
Find the patterns in the red circles
https://www.csc2.ncsu.edu/faculty/healey/PP/
Fitting spatial knowledge into your
mental map
< 1 second
SEEING
1-2 seconds
PROCESSING
3-20+ seconds
COGNITION
(cognitioning, cogitating,???)
https://www.flickr.com/photos/paul_heaston/8798290688/
20
Map Use: Reading, Analysis, Interpretation, 8th edition, Figure I.1
21
Map Use: Reading, Analysis, Interpretation, 8th edition, Figure I.2
http://www.bbc.com/news/world-us-canada-40019013
Map Use: Reading, Analysis, Interpretation, 8th edition, Figure I.3
Map design matters
• Maps should inform or communicate
• Maps can involve high costs (time, effort)
• Maps are hard for many people to understand
• Maps can provide product or organization/agency credibility
• Maps must compete for peoples’ attention
Map design considerations
Intent Audience Format Strategy
For the most part, audiences…
- Know less about the topic than you do
- Have a range of knowledge, interest, and expertise
- Appreciate simplicity and clarity (even technical audiences)
- Are willing to learn, but are busy and easily distracted
- Are intelligent, but not necessarily skilled in map use
Audience: Consider your readers
Format: Where and how
will your maps be seen?
Strategy: How do you want your
map to be received?
Aha!
Inform
Communicate
Inspire
Persuade
Based on your intent,
audience and format:
DEMO
Built-up Area
Per Capita Income
Population Density
Population Density
Per Capita Income
Per Capita Income
Per Capita Income
Race & Ethnicity
Race & Ethnicity
Race & Ethnicity
Original colors Modified from on-screen view
+Cartography Story
Maps have always told stories
new media = new languages…which can
take a while to learn
In the digital realm…
• The old rules still apply…mostly
• New tools and techniques are available
• More geographic information
• Greater accessibility
• New Viewing platforms
• New ways of presenting content
+Cartography Story
In the digital realm…
• The old rules still apply…mostly
• New tools and techniques are available = more demand for understanding
• More geographic information = new and larger audiences
• Greater accessibility
• New Viewing platforms
• New ways of presenting content
+Cartography Story
new media = new languages…which can
take a while to learn
The big difference in the digital age
Now we can guide the user experience
+Cartography
User
experience
Both should be conceived of and designed as a single unit
Apps &
user experiencesWeb maps
How do I end this talk?
I don’t—you do!
By making maps that…
…engage, …and inspire.…inform,
Maps that Engage, Inform, and Inspire

Maps that Engage, Inform, and Inspire

  • 1.
    Dr. Aileen Buckley,Cartographer, Esri Maps that Engage, Inform, and Inspire
  • 2.
    Make maps thatpeople are willing to look at long enough to learn something from, and even prompt them to take action The goal
  • 3.
  • 4.
    "Map showing thedistribution of the slave population of the Southern states of the United States. Compiled from the census of 1860. Drawn by E. Hergesheimer. Engr. by Th. Leonhardt." Library of Congress, American Memory Map Collections.
  • 5.
    Francis Bicknell Carpenter’sportrait titled First Reading of the Emancipation Proclamation of President Lincoln, 1864, oil on canvas.
  • 7.
    How visual perceptionworks You see something The image is sent to your brain Your brain processes the image http://sketchingspirit.typepad.com/sketchingspirit/2011/06/denver-colorado-skyline.html
  • 8.
    Let’s says that“seeing something” is really “legibility” The ability to be seen… …and recognized https://www.flickr.com/photos/paul_heaston/8798290688/
  • 9.
    Legibility depends onsize and contrast Map Use: Reading, Analysis, Interpretation, 8th edition, Figure 6.13 Field of view
  • 10.
  • 11.
    Too dark ToolightJust right Map Use: Reading, Analysis, Interpretation, 8th edition, Figure 6.9 Legibility also depends on contrast
  • 12.
    Map Use: Reading,Analysis, Interpretation, 8th edition, Figure 6.7 Visual contrast
  • 13.
    The ability tobe recognized depends on many things < 1 second SEEING 1-2 seconds PROCESSING 3-20+ seconds COGNITION (cognitioning, cogitating,???) https://www.flickr.com/photos/paul_heaston/8798290688/
  • 14.
    Perceptual challenges Overstimulated by visualclutter Get stuck on unimportant details that should be filtered out Hard to identify the important things
  • 15.
    https://www.csc2.ncsu.edu/faculty/healey/PP/ Find the redcircle < 1 second PREATTENTIVE PROCESSING Typically less than 200 to 250 milliseconds 1-2 seconds FOCUSED ATTENTION 3-20+ seconds COGNITION
  • 16.
    https://www.csc2.ncsu.edu/faculty/healey/PP/ Find the redcircle < 1 second PREATTENTIVE PROCESSING 1-2 seconds FOCUSED ATTENTION 3-20+ seconds COGNITION
  • 17.
    < 1 second PREATTENTIVE PROCESSING 1-2seconds FOCUSED ATTENTION 3-20+ seconds COGNITION Find the red circle https://www.csc2.ncsu.edu/faculty/healey/PP/
  • 18.
    < 1 second PREATTENTIVE PROCESSING 1-2seconds FOCUSED ATTENTION 3-20+ seconds COGNITION Find the patterns in the red circles https://www.csc2.ncsu.edu/faculty/healey/PP/
  • 19.
    Fitting spatial knowledgeinto your mental map < 1 second SEEING 1-2 seconds PROCESSING 3-20+ seconds COGNITION (cognitioning, cogitating,???) https://www.flickr.com/photos/paul_heaston/8798290688/
  • 20.
    20 Map Use: Reading,Analysis, Interpretation, 8th edition, Figure I.1
  • 21.
    21 Map Use: Reading,Analysis, Interpretation, 8th edition, Figure I.2
  • 23.
  • 24.
    Map Use: Reading,Analysis, Interpretation, 8th edition, Figure I.3
  • 27.
    Map design matters •Maps should inform or communicate • Maps can involve high costs (time, effort) • Maps are hard for many people to understand • Maps can provide product or organization/agency credibility • Maps must compete for peoples’ attention
  • 28.
    Map design considerations IntentAudience Format Strategy
  • 29.
  • 31.
    For the mostpart, audiences… - Know less about the topic than you do - Have a range of knowledge, interest, and expertise - Appreciate simplicity and clarity (even technical audiences) - Are willing to learn, but are busy and easily distracted - Are intelligent, but not necessarily skilled in map use Audience: Consider your readers
  • 32.
    Format: Where andhow will your maps be seen?
  • 35.
    Strategy: How doyou want your map to be received? Aha! Inform Communicate Inspire Persuade Based on your intent, audience and format:
  • 36.
  • 37.
  • 38.
  • 39.
  • 40.
  • 41.
  • 42.
  • 43.
  • 44.
  • 45.
  • 46.
  • 78.
    Original colors Modifiedfrom on-screen view
  • 82.
    +Cartography Story Maps havealways told stories new media = new languages…which can take a while to learn
  • 83.
    In the digitalrealm… • The old rules still apply…mostly • New tools and techniques are available • More geographic information • Greater accessibility • New Viewing platforms • New ways of presenting content +Cartography Story
  • 84.
    In the digitalrealm… • The old rules still apply…mostly • New tools and techniques are available = more demand for understanding • More geographic information = new and larger audiences • Greater accessibility • New Viewing platforms • New ways of presenting content +Cartography Story new media = new languages…which can take a while to learn
  • 85.
    The big differencein the digital age Now we can guide the user experience +Cartography User experience Both should be conceived of and designed as a single unit Apps & user experiencesWeb maps
  • 86.
    How do Iend this talk? I don’t—you do!
  • 87.
    By making mapsthat… …engage, …and inspire.…inform,

Editor's Notes

  • #2 Esri Corporate Template-Dark v3.4 16:9 version – January 29, 2017 For more templates, sample files, and icons, see https://compass.esri.com/resources/presentations/Pages/Main.aspx To add footer text in Windows On the Home tab, under Insert, click Text, and then click Header and Footer. Click the Slide tab, select the Footer check box, and then type the footer text that you want. Click either Apply or Apply to All. To add footer text on a Mac On the View menu, select Header and Footer. Select the Footer check box and then type the footer text that you want. Click either Apply or Apply to All. If footers don't appear on the slides If footers don't appear on title slides, in the Header and Footer dialog box make sure the Don't show on title slide check box is not selected. If the footers are missing from other slides, the placeholders for these items might have been removed from specific slide layouts or the slide master.