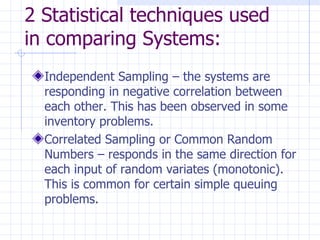
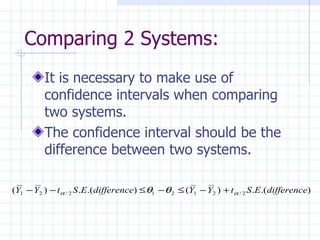
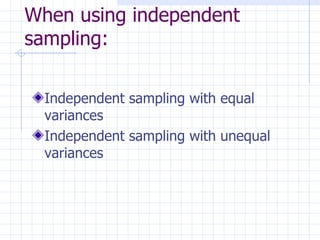
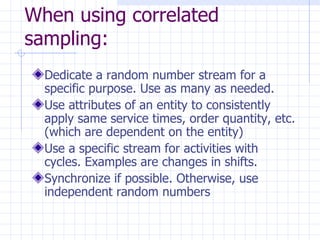
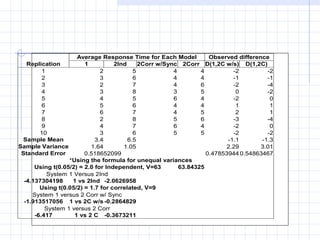
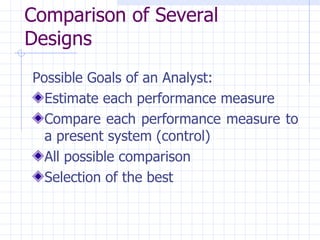
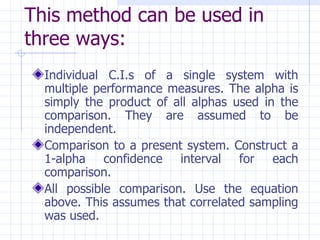
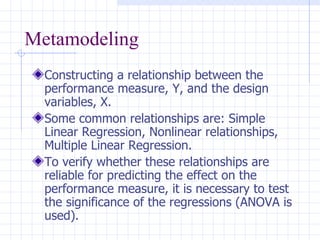
Comparison and Evaluation of Alternative Designs Adapted from J. Banks
2 Statistical techniques used in comparing Systems:   Independent Sampling – the systems are responding in negative correlation between each other. This has been observed in some inventory problems. Correlated Sampling or Common Random Numbers – responds in the same direction for each input of random variates (monotonic). This is common for certain simple queuing problems.
Comparing 2 Systems:   It is necessary to make use of confidence intervals when comparing two systems. The confidence interval should be the difference between two systems.
Three possible scenarios when computing for the confidence interval of the differences  (90%, 95%, or 99%):   0 0 0
When using independent sampling: Independent sampling with equal variances Independent sampling with unequal variances
When using correlated sampling:   Dedicate a random number stream for a specific purpose. Use as many as needed. Use attributes of an entity to consistently apply same service times, order quantity, etc. (which are dependent on the entity) Use a specific stream for activities with cycles. Examples are changes in shifts. Synchronize if possible. Otherwise, use independent random numbers
 
Comparison of Several Designs   Possible Goals of an Analyst: Estimate each performance measure Compare each performance measure to a present system (control) All possible comparison Selection of the best
Using Bonferroni Approach for Comparison:   When making statements about several alternatives, an analyst would like to be confident that all statements are true simultaneously.
This method can be used in three ways:   Individual C.I.s of a single system with multiple performance measures. The alpha is simply the product of all alphas used in the comparison. They are assumed to be independent. Comparison to a present system. Construct a 1-alpha confidence interval for each comparison. All possible comparison. Use the equation above. This assumes that correlated sampling was used.
Selecting the Best Two objectives: Determining the best of the alternatives Determining how much the best is relative to the rest of the alternatives NOTE: It might be possible that selecting the second best is more practical, less costly, more feasible, but still very insignificantly close to being the best.
Understanding the Effect of the Design Alternatives:   Use the power of design of experiments Some of the tools under DOE are: Factorial Designs  (useful for understanding the effects of the alternatives) Screening , these are fractional factorial and Placket Burman (useful for trimming down the unimportant alternatives) Response Surface , these are Central Composite and Box Benhken (useful for identifying the optimal setup in an alternative)
Metamodeling Constructing a relationship between the performance measure, Y, and the design variables, X.  Some common relationships are: Simple Linear Regression, Nonlinear relationships, Multiple Linear Regression. To verify whether these relationships are reliable for predicting the effect on the performance measure, it is necessary to test the significance of the regressions (ANOVA is used).

Comparison and evaluation of alternative designs

  • 1.
    Comparison and Evaluationof Alternative Designs Adapted from J. Banks
  • 2.
    2 Statistical techniquesused in comparing Systems: Independent Sampling – the systems are responding in negative correlation between each other. This has been observed in some inventory problems. Correlated Sampling or Common Random Numbers – responds in the same direction for each input of random variates (monotonic). This is common for certain simple queuing problems.
  • 3.
    Comparing 2 Systems: It is necessary to make use of confidence intervals when comparing two systems. The confidence interval should be the difference between two systems.
  • 4.
    Three possible scenarioswhen computing for the confidence interval of the differences (90%, 95%, or 99%): 0 0 0
  • 5.
    When using independentsampling: Independent sampling with equal variances Independent sampling with unequal variances
  • 6.
    When using correlatedsampling: Dedicate a random number stream for a specific purpose. Use as many as needed. Use attributes of an entity to consistently apply same service times, order quantity, etc. (which are dependent on the entity) Use a specific stream for activities with cycles. Examples are changes in shifts. Synchronize if possible. Otherwise, use independent random numbers
  • 7.
  • 8.
    Comparison of SeveralDesigns Possible Goals of an Analyst: Estimate each performance measure Compare each performance measure to a present system (control) All possible comparison Selection of the best
  • 9.
    Using Bonferroni Approachfor Comparison: When making statements about several alternatives, an analyst would like to be confident that all statements are true simultaneously.
  • 10.
    This method canbe used in three ways: Individual C.I.s of a single system with multiple performance measures. The alpha is simply the product of all alphas used in the comparison. They are assumed to be independent. Comparison to a present system. Construct a 1-alpha confidence interval for each comparison. All possible comparison. Use the equation above. This assumes that correlated sampling was used.
  • 11.
    Selecting the BestTwo objectives: Determining the best of the alternatives Determining how much the best is relative to the rest of the alternatives NOTE: It might be possible that selecting the second best is more practical, less costly, more feasible, but still very insignificantly close to being the best.
  • 12.
    Understanding the Effectof the Design Alternatives: Use the power of design of experiments Some of the tools under DOE are: Factorial Designs (useful for understanding the effects of the alternatives) Screening , these are fractional factorial and Placket Burman (useful for trimming down the unimportant alternatives) Response Surface , these are Central Composite and Box Benhken (useful for identifying the optimal setup in an alternative)
  • 13.
    Metamodeling Constructing arelationship between the performance measure, Y, and the design variables, X. Some common relationships are: Simple Linear Regression, Nonlinear relationships, Multiple Linear Regression. To verify whether these relationships are reliable for predicting the effect on the performance measure, it is necessary to test the significance of the regressions (ANOVA is used).