Download to read offline

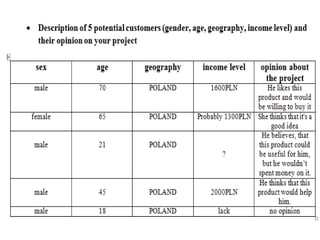


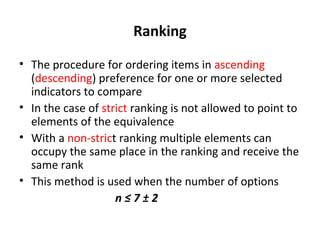


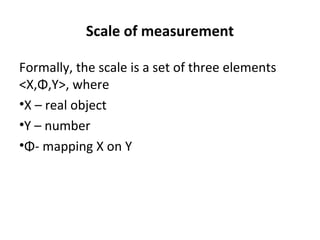


The document outlines different decision making techniques for evaluating options for a restaurant project, including ranking alternatives, pairwise comparisons, grid analysis, and the Analytic Hierarchy Process. It discusses measuring various effects of the project using different scales of measurement and evaluating options through group work activities like defining key effects, proposing an evaluation method and scale, and discussing results. The document provides guidance on tools and processes for assessing and selecting between alternatives for the restaurant project.


![573 ahp[1] note](https://cdn.slidesharecdn.com/ss_thumbnails/573-ahp1note-130203214242-phpapp01-thumbnail.jpg?width=640&height=640&fit=bounds)