Response surface methodology(RSM) includes optimization procedures for the settings
of factorial variables, such that the response reaches a desired maximum or minimum
value.
a collection of statistical and mathematical techniques used to the relationships to
study between a response variable and multiple predictor variables.
a statistical technique used to optimize the response of a system or process, given a set
of input variables. The goal of RSM is to find the optimal set of input variables that result
in the desired output response
One of the popular designs in RSM is the Central Composite Design(CCD), which is a
type of experimental design that allows for the estimation of the curvature of the response
surface.
is widely applied in various fields including engineering, chemistry, biology, and
manufacturing, to find the best settings for a process or system by systematically
exploring the factor space.
3.
Key components andconcepts
Design of Experiments (DOE): RSM starts with the design of a set of experiments that
vary the input factors at different levels. Common experimental designs used in RSM
include full factorial designs, fractional factorial designs, and central composite designs.
Response Variable: This is the outcome or dependent variable that you want to optimize
or understand. t could be a product yield, quality parameter, Cost, or any measurable result
of process.
Independent Variables (Factors): These are the input parameters or variables that may
influence the response variable. RSM helps you identify which of these factors are
significant and how they interact with each other.
Mathematical Models: RSM uses regression analysis to fit mathematical models to the
data generated from the experiments. These models represent the relationship between the
factors and the response. The most common models are quadratic models, which linear,
quadratic, and interaction.
Optimization: Once the mathematical model is built, RSM allows you to optimize the
process by finding the factor settings that maximize or minimize the response variable. This
can be done through various optimization techniques, such as the desirability function
approach.
Response Surface: The response surface is a graphical representation of the mathematical
model in a multidimensional space, often depicted as contour plots or 3D surface plots. It
helps visualize how the response variable changes with variations in the factors.
4.
Analysis of Variance(ANOVA): ANOVA is used to asses the significance of the factors
and their interactions. It helps determine which factors have a significant impact on the
response.
Steepest Descent and Path of Steepest Ascent: These are methods used to systematically
approach the optimal factor settings from an initial starting point.
Model Validation: It's crucial to validate the accuracy and reliability of the mathematical
models developed in RSM. This can be done by comparing predicted values with actual
experimental results.
Robustness Analysis: RSM can be used to assess the robustness of a process by studying
how variations in factors affect the response.
5.
Historical design
Response SurfaceMethodology (RSM) is a statistical experimental design technique
used to study the relationship between a response variable and several predictor
variables.
is a type of design that is used when there is prior knowledge or historical data
available about the factors and their levels.
involves using the existing knowledge about the factors and their levels to create a
design matrix that can be used to conduct the experiment. The design matrix is based on
a statistical model that relates the response variable to the predictor variables and it is
created using software tools such as Design Expert or JMP
6.
The steps involvedin historical design are
Identify the response variable and predictor variables: The first step in historical design is to
identify the response variable and predictor variables. The response variable is the variable
that is being studied, while the predictor variables are the variables that are expected to have
an effect on the response variable.
Identify the levels of the predictor variables: The next step is to identify the levels of the
predictor variables based on prior knowledge or historical data. The levels should be chosen
so that they cover the expected range of the predictor variables.
Determine the number of runs: Once the levels of the predictor variables have been
identified, the next step is to determine the number of runs required for the experiment. The
number of runs is determined by the statistical model and the degree of precision required.
Create the design matrix: Using the identified levels and the number of runs, a design
matrix is created using software tools such as Design Expert or JMP. The design
matrix specifies the combinations of the levels of the predictor variables that are to be
experiment.
Conduct the experiment: The experiment is conducted according to the design matrix, and
the response variable is measured for each combination of predictor variable levels.
Analyze the data: Once the experiment is complete, the data is analyzed using statistical
methods such as regression analysis. The statistical model is used to estimate the effects of the
predictor variables on the response variable and to optimize the response variable based on
the desired criteria.
7.
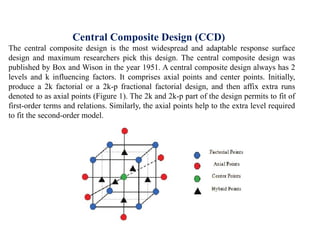
Central Composite Design(CCD)
The central composite design is the most widespread and adaptable response surface
design and maximum researchers pick this design. The central composite design was
published by Box and Wison in the year 1951. A central composite design always has 2
levels and k influencing factors. It comprises axial points and center points. Initially,
produce a 2k factorial or a 2k-p fractional factorial design, and then affix extra runs
denoted to as axial points (Figure 1). The 2k and 2k-p part of the design permits to fit of
first-order terms and relations. Similarly, the axial points help to the extra level required
to fit the second-order model.
8.
Optimization Techniques inResponse Surface methodology
These techniques help practitioners make informed decisions about process or product
improvement.
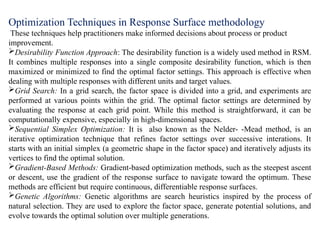
Desirability Function Approach: The desirability function is a widely used method in RSM.
It combines multiple responses into a single composite desirability function, which is then
maximized or minimized to find the optimal factor settings. This approach is effective when
dealing with multiple responses with different units and target values.
Grid Search: In a grid search, the factor space is divided into a grid, and experiments are
performed at various points within the grid. The optimal factor settings are determined by
evaluating the response at each grid point. While this method is straightforward, it can be
computationally expensive, especially in high-dimensional spaces.
Sequential Simplex Optimization: It is also known as the Nelder- -Mead method, is an
iterative optimization technique that refines factor settings over successive interations. It
starts with an initial simplex (a geometric shape in the factor space) and iteratively adjusts its
vertices to find the optimal solution.
Gradient-Based Methods: Gradient-based optimization methods, such as the steepest ascent
or descent, use the gradient of the response surface to navigate toward the optimum. These
methods are efficient but require continuous, differentiable response surfaces.
Genetic Algorithms: Genetic algorithms are search heuristics inspired by the process of
natural selection. They are used to explore the factor space, generate potential solutions, and
evolve towards the optimal solution over multiple generations.
9.
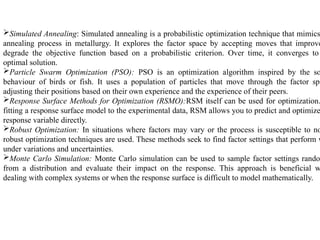
Simulated Annealing: Simulatedannealing is a probabilistic optimization technique that mimics
annealing process in metallurgy. It explores the factor space by accepting moves that improve
degrade the objective function based on a probabilistic criterion. Over time, it converges to
optimal solution.
Particle Swarm Optimization (PSO): PSO is an optimization algorithm inspired by the so
behaviour of birds or fish. It uses a population of particles that move through the factor spa
adjusting their positions based on their own experience and the experience of their peers.
Response Surface Methods for Optimization (RSMO):RSM itself can be used for optimization.
fitting a response surface model to the experimental data, RSM allows you to predict and optimize
response variable directly.
Robust Optimization: In situations where factors may vary or the process is susceptible to no
robust optimization techniques are used. These methods seek to find factor settings that perform w
under variations and uncertainties.
Monte Carlo Simulation: Monte Carlo simulation can be used to sample factor settings rando
from a distribution and evaluate their impact on the response. This approach is beneficial w
dealing with complex systems or when the response surface is difficult to model mathematically.
10.
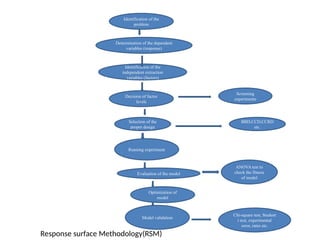
Identification of the
problem
Determinationof the dependent
variables (response)
Identification of the
independent extraction
variables (factors)
Decision of factor
levels
Selection of the
proper design
Screening
experiments
Running experiment
BBD,CCD,CCRD
etc.
ANOVA test to
check the fitness
of model
Chi-square test, Student
t test, experimental
error, rates etc.
Model validation
Optimization of
model
Evaluation of the model
Response surface Methodology(RSM)
11.
Applications of RSM
Responsesurface methodology is used as a statistical tool for optimization.
It is efficient in improving existing studies and products because RSM yields the
maximum amount of information with the minimum effort.
RSM is important in designing, developing, and examining specific scientific studies
and products.
RSM is used to figure out the topography of the response surface and to determine
the region with the best response.
The RSM can be used with various large-scale simulation systems, including Bio
War, ORA, Vista, Construct, and DyNet
12.
Advantages of RSM
Arelatively small number of trials can yield a tremendous amount of knowledge in
a cost effective manner.
Can be used to determine the interaction effects of the independent input
parameters.
The data-driven model equation can be utilized to illustrate the different
combinations of independent input factors that affect the outcome of a
process/product.
Both experimental and numerical responses can be approximated using RSM.
To maintain a high level of efficiency in terms of cost, time, and any other
restrictions.
Compared to the Taguchi and one factorial method, the RSM technique appears to
be more promising in mathematical modeling for forecasting responses.
13.
Disadvantages of RSM
Thismethod necessitates theto explain why an interaction has developed.
This method necessitates the selection of appropriate
operating parameter ranges, and the optimization result is limited to specific
scales.
RSM is not good at foretelling prospective outcomes for a system operated
outside the range of a particularstudy.
RSM cannot operate with larger models.
The more responses you receive, the more likely you will receive poor
optimization results.
14.
References
Sai Datri A,Nataraj K, Lakshmana Rao A. Response Surface Methodology-A
Statistical Tool for the Optimization of Responses. Glob J Addict Rehabil Med.
2023; 7(1): 555705.
Reji M, Kumar R. Response surface methodology (RSM): An overview to
analyze multivariate data. Indian Journal of Microbiol Research 2022;9(4):241-
248.
Textbook of Biostatistics and Research Methodology-By Prof.
Kakasaheb.J.Kore,Mrs.Bommala Supraja, Dr.B.Appa Rao, Dr.K.Blessi Priyanka,
Dr.Prakash Patil. ISBN No.978-81-19908-77-6. Shashwat Publication,Published
in 2023.