
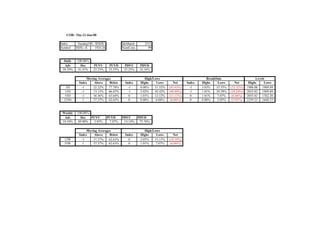


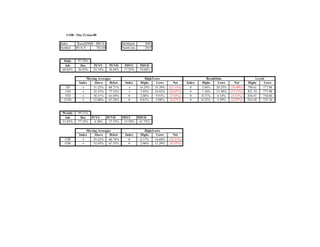
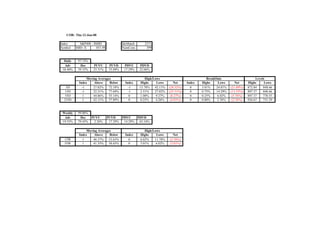

This document provides stock market index data for several major US stock indexes as of June 12, 2008. It includes the daily and weekly performance statistics as well as statistics related to moving averages, highs/lows, and breakouts for each index over different time periods ranging from 3 days to 233 days (approximately 1 year). The indexes included are the S&P 100, Nasdaq 100, S&P 500, Russell 1000, Russell 2000, Russell 3000, and S&P 400.


