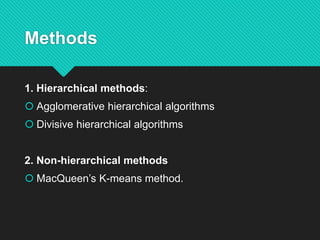
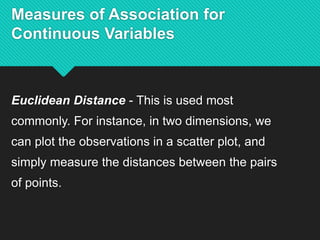
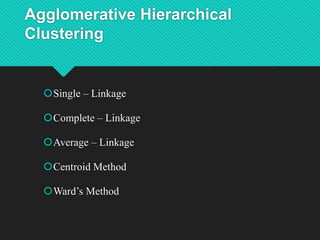
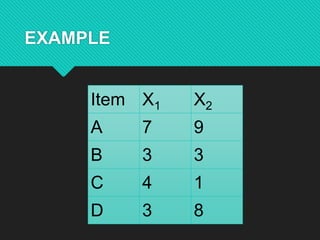
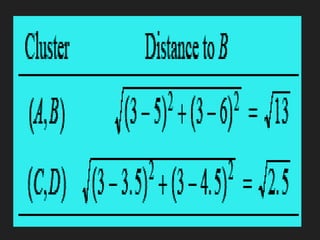
CLUSTER ANALYSIS
-sv
MEANING
Cluster analysis is a data exploration (mining) tool
for dividing a multivariate dataset into “natural”
clusters (groups). We use the methods to explore
whether previously undefined clusters (groups) may
exist in the dataset.
Applications:
 Field of psychiatry - where the characterization of patients on the basis of clusters of
symptoms can be useful in the identification of an appropriate form of therapy.
 Biology - used to find groups of genes that have similar functions.
 Information Retrieval - The world Wide Web consists of billions of Web pages, and the
results of a query to a search engine can return thousands of pages. Clustering can be used
to group these search results into small number of clusters, each of which captures a
particular aspect of the query. For instance, a query of “movie” might return Web pages
grouped into categories such as reviews, trailers, stars and theaters. Each category (cluster)
can be broken into subcategories (sub-clusters_, producing a hierarchical structure that
further assists a user’s exploration of the query results.
 Climate - Understanding the Earth’s climate requires finding patterns in the atmosphere and
ocean. To that end, cluster analysis has been applied to find patterns in the atmospheric
pressure of polar regions and areas of the ocean that have a significant impact on land
climate.
Methods
1. Hierarchical methods:
 Agglomerative hierarchical algorithms
 Divisive hierarchical algorithms
2. Non-hierarchical methods
 MacQueen’s K-means method.
Measures of Association for
Continuous Variables
Euclidean Distance - This is used most
commonly. For instance, in two dimensions, we
can plot the observations in a scatter plot, and
simply measure the distances between the pairs
of points.
Agglomerative Hierarchical
Clustering
Single – Linkage
Complete – Linkage
Average – Linkage
Centroid Method
Ward’s Method
K- MEANS CLUSTER
 This method was presented by MacQueen (1967) in
the Proceedings of the 5th Berkeley Symposium on
Mathematical Statistics and Probability.
 One of the advantages of this method is that we do not
have to calculate the distance measures between all
pairs of subjects. Therefore, this procedure seems
much more efficient or practical when you have very
large datasets.
EXAMPLE
Item X1 X2
A 7 9
B 3 3
C 4 1
D 3 8
THANKYOU

Cluster analysis

  • 1.
  • 2.
    MEANING Cluster analysis isa data exploration (mining) tool for dividing a multivariate dataset into “natural” clusters (groups). We use the methods to explore whether previously undefined clusters (groups) may exist in the dataset.
  • 3.
    Applications:  Field ofpsychiatry - where the characterization of patients on the basis of clusters of symptoms can be useful in the identification of an appropriate form of therapy.  Biology - used to find groups of genes that have similar functions.  Information Retrieval - The world Wide Web consists of billions of Web pages, and the results of a query to a search engine can return thousands of pages. Clustering can be used to group these search results into small number of clusters, each of which captures a particular aspect of the query. For instance, a query of “movie” might return Web pages grouped into categories such as reviews, trailers, stars and theaters. Each category (cluster) can be broken into subcategories (sub-clusters_, producing a hierarchical structure that further assists a user’s exploration of the query results.  Climate - Understanding the Earth’s climate requires finding patterns in the atmosphere and ocean. To that end, cluster analysis has been applied to find patterns in the atmospheric pressure of polar regions and areas of the ocean that have a significant impact on land climate.
  • 4.
    Methods 1. Hierarchical methods: Agglomerative hierarchical algorithms  Divisive hierarchical algorithms 2. Non-hierarchical methods  MacQueen’s K-means method.
  • 5.
    Measures of Associationfor Continuous Variables Euclidean Distance - This is used most commonly. For instance, in two dimensions, we can plot the observations in a scatter plot, and simply measure the distances between the pairs of points.
  • 6.
    Agglomerative Hierarchical Clustering Single –Linkage Complete – Linkage Average – Linkage Centroid Method Ward’s Method
  • 7.
    K- MEANS CLUSTER This method was presented by MacQueen (1967) in the Proceedings of the 5th Berkeley Symposium on Mathematical Statistics and Probability.  One of the advantages of this method is that we do not have to calculate the distance measures between all pairs of subjects. Therefore, this procedure seems much more efficient or practical when you have very large datasets.
  • 8.
    EXAMPLE Item X1 X2 A7 9 B 3 3 C 4 1 D 3 8
  • 14.