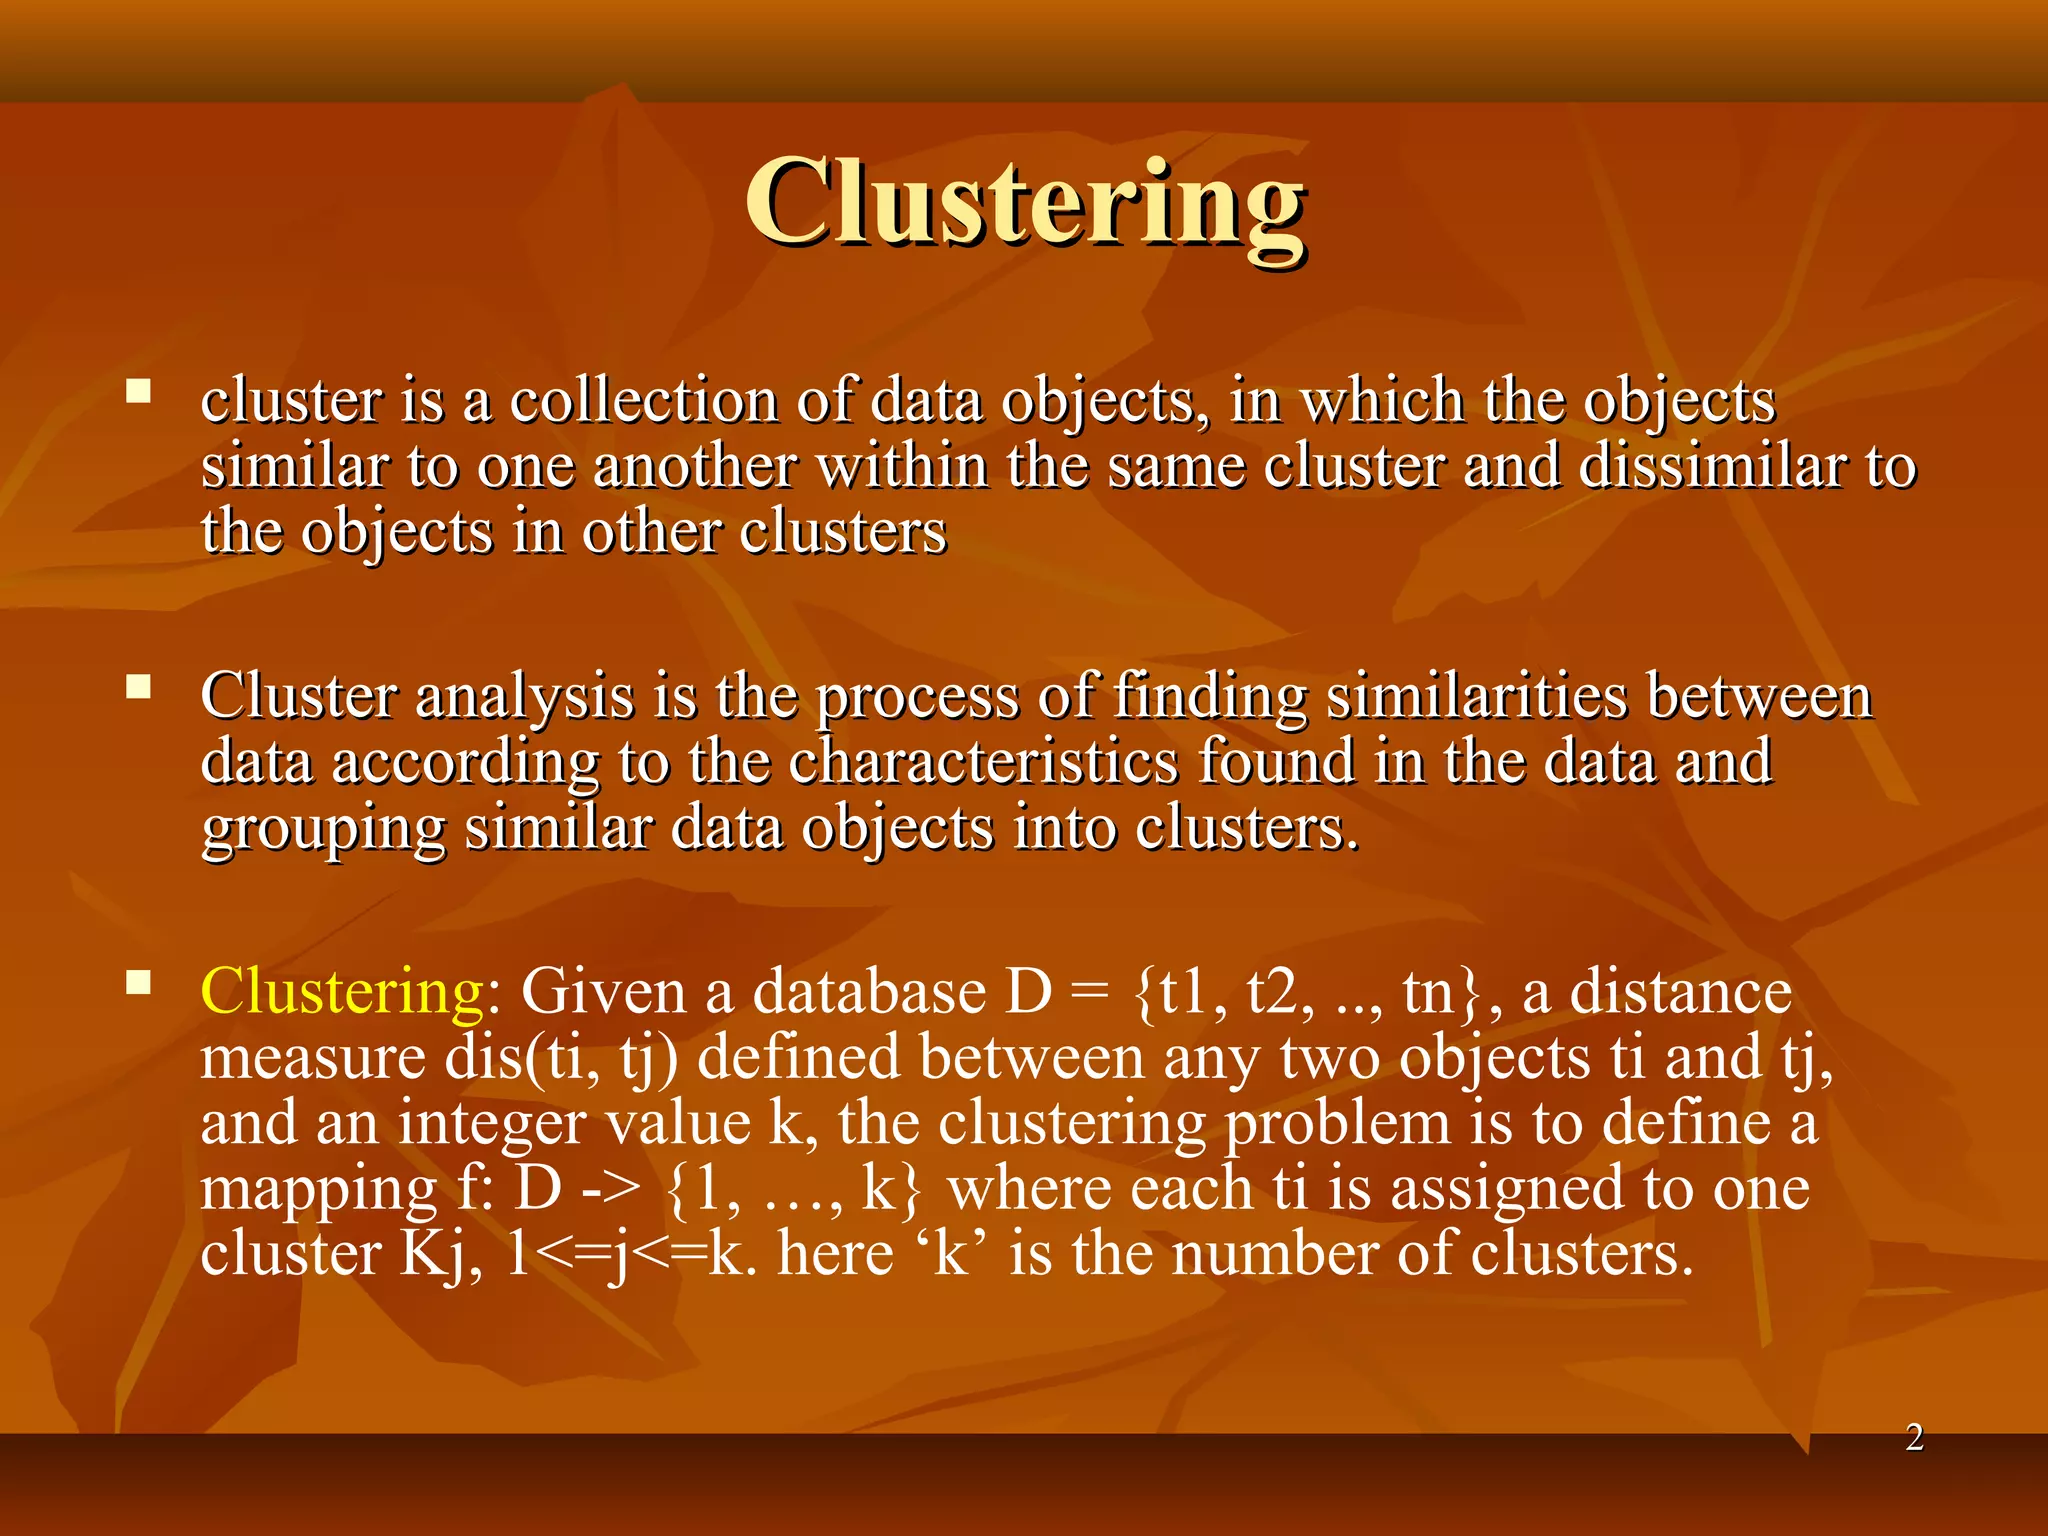
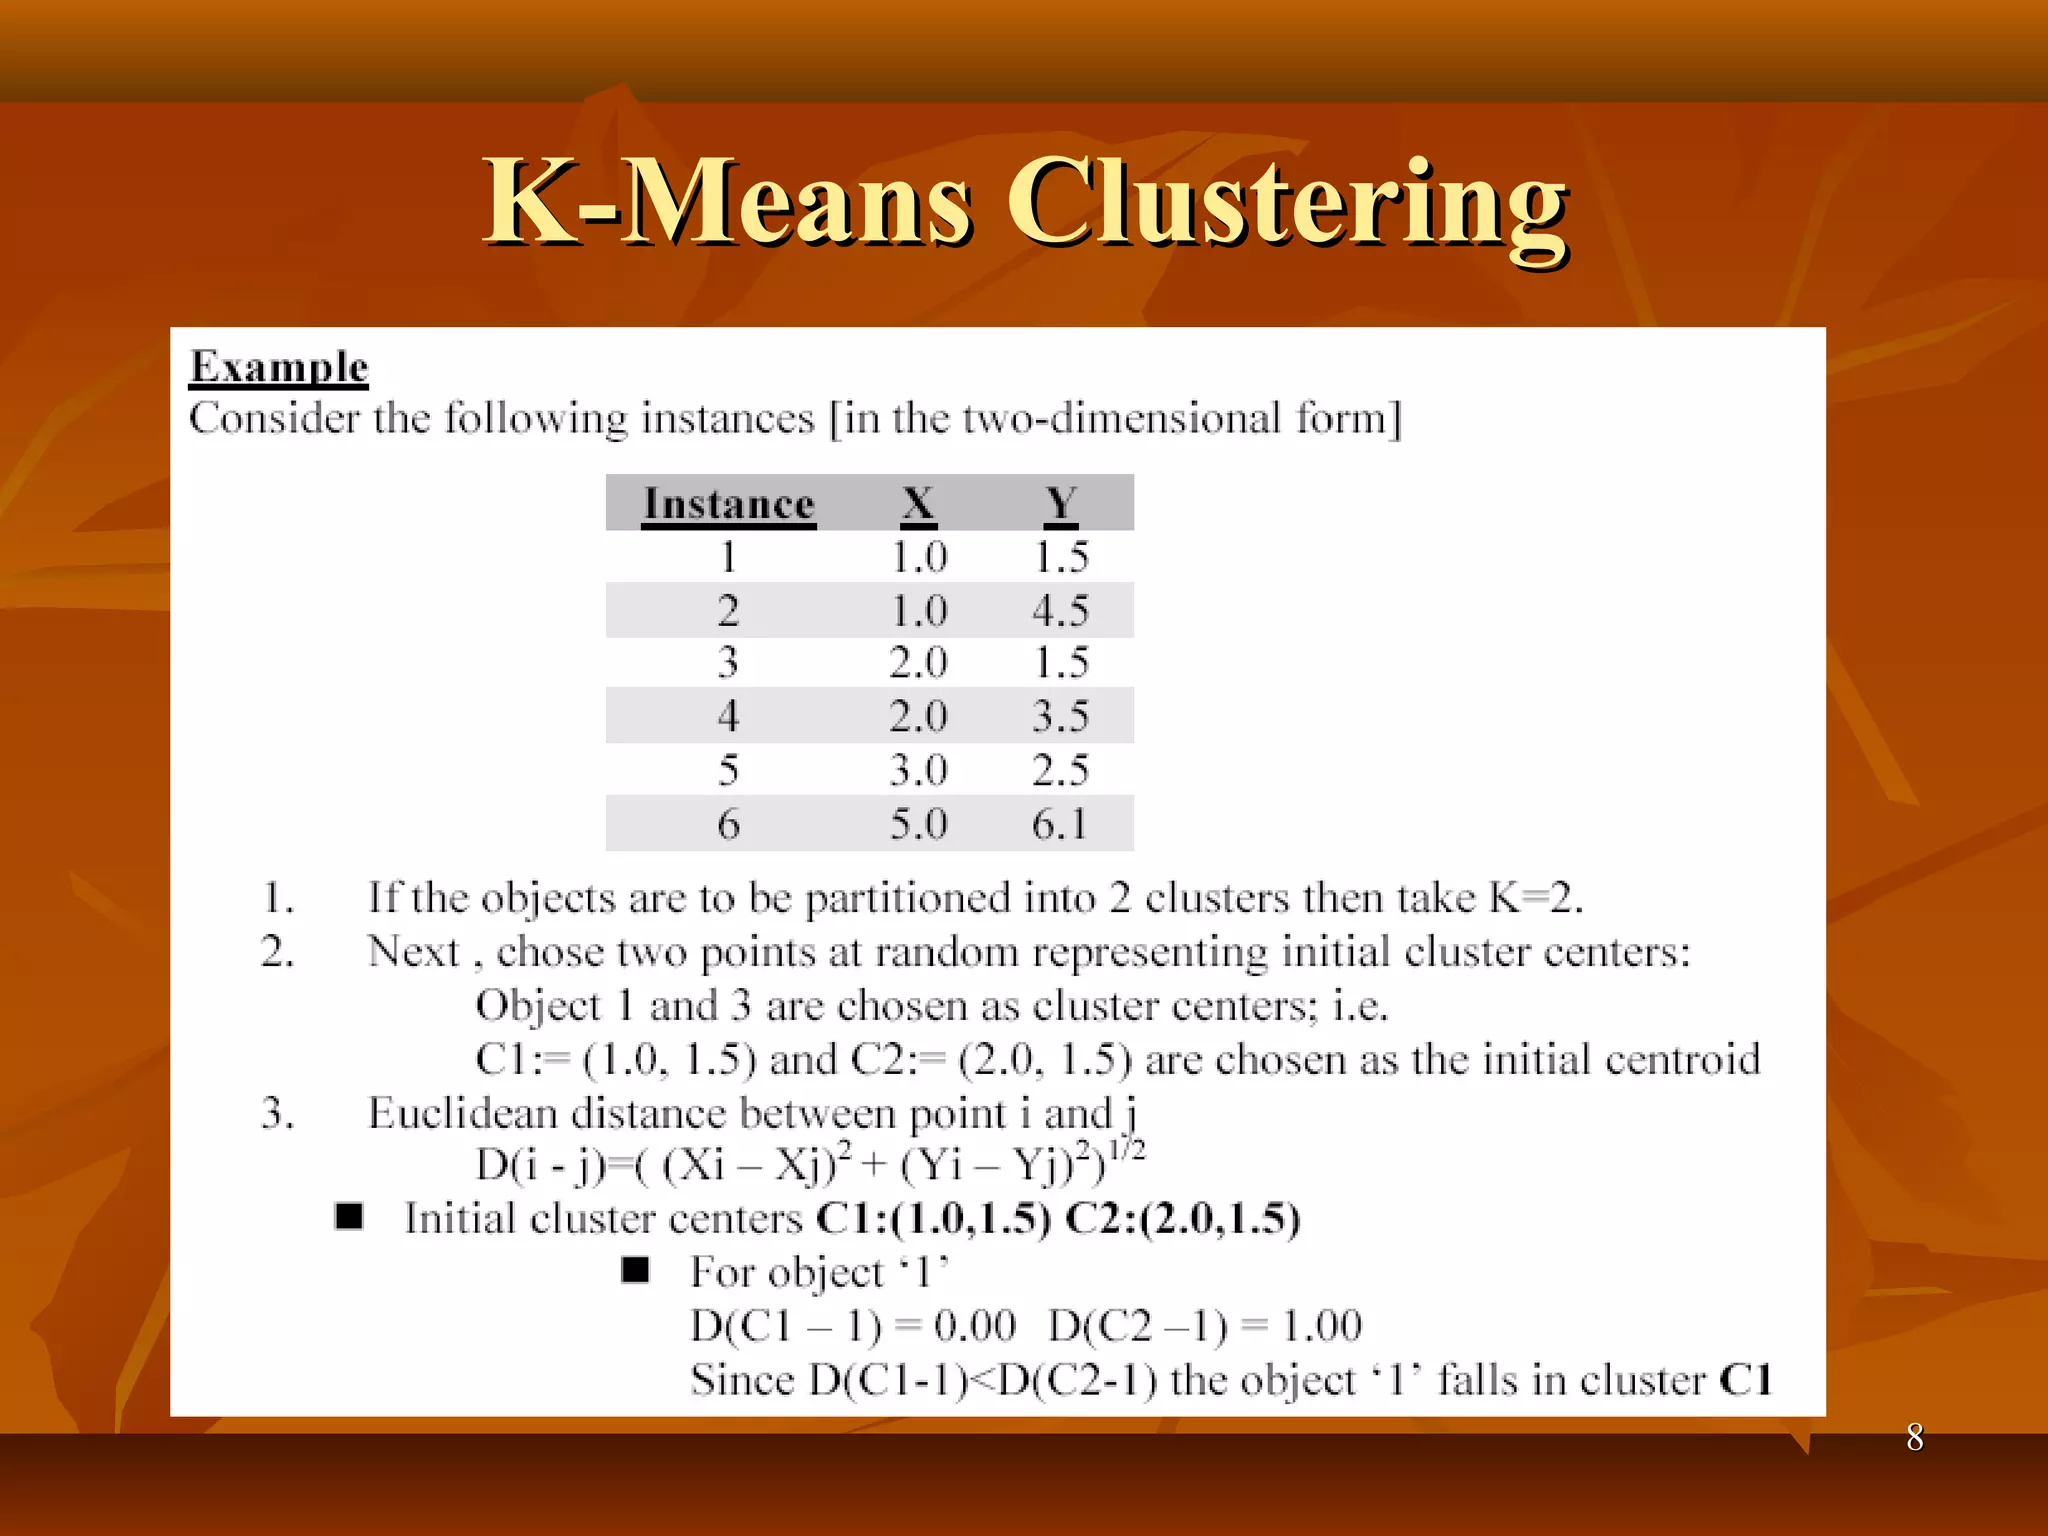
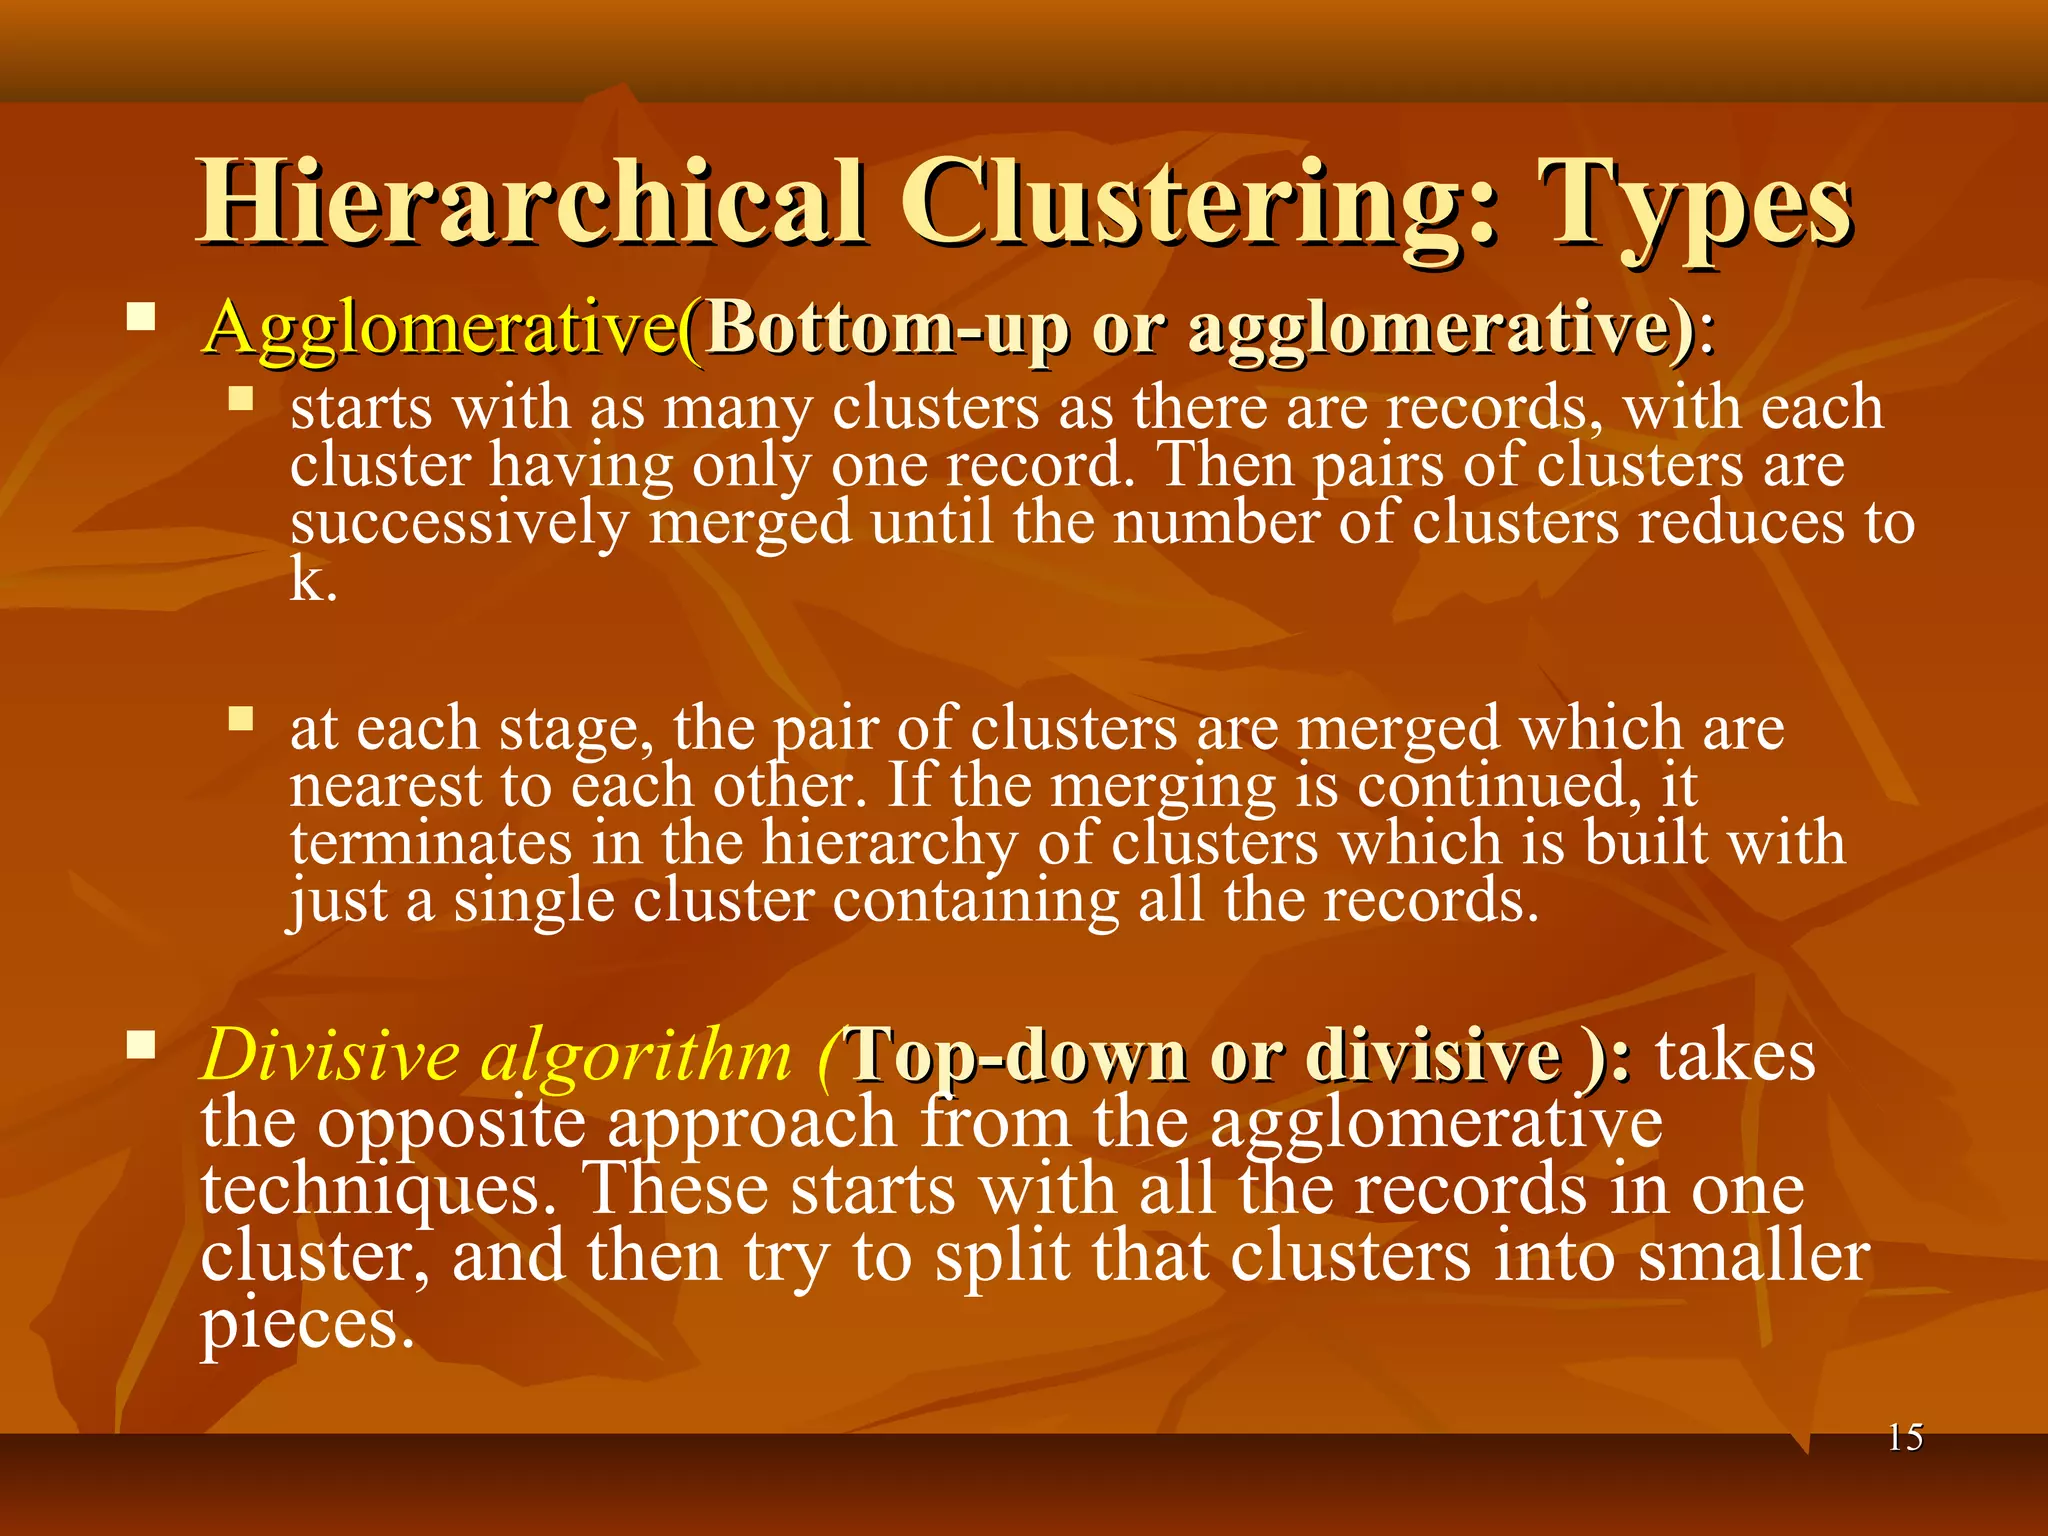
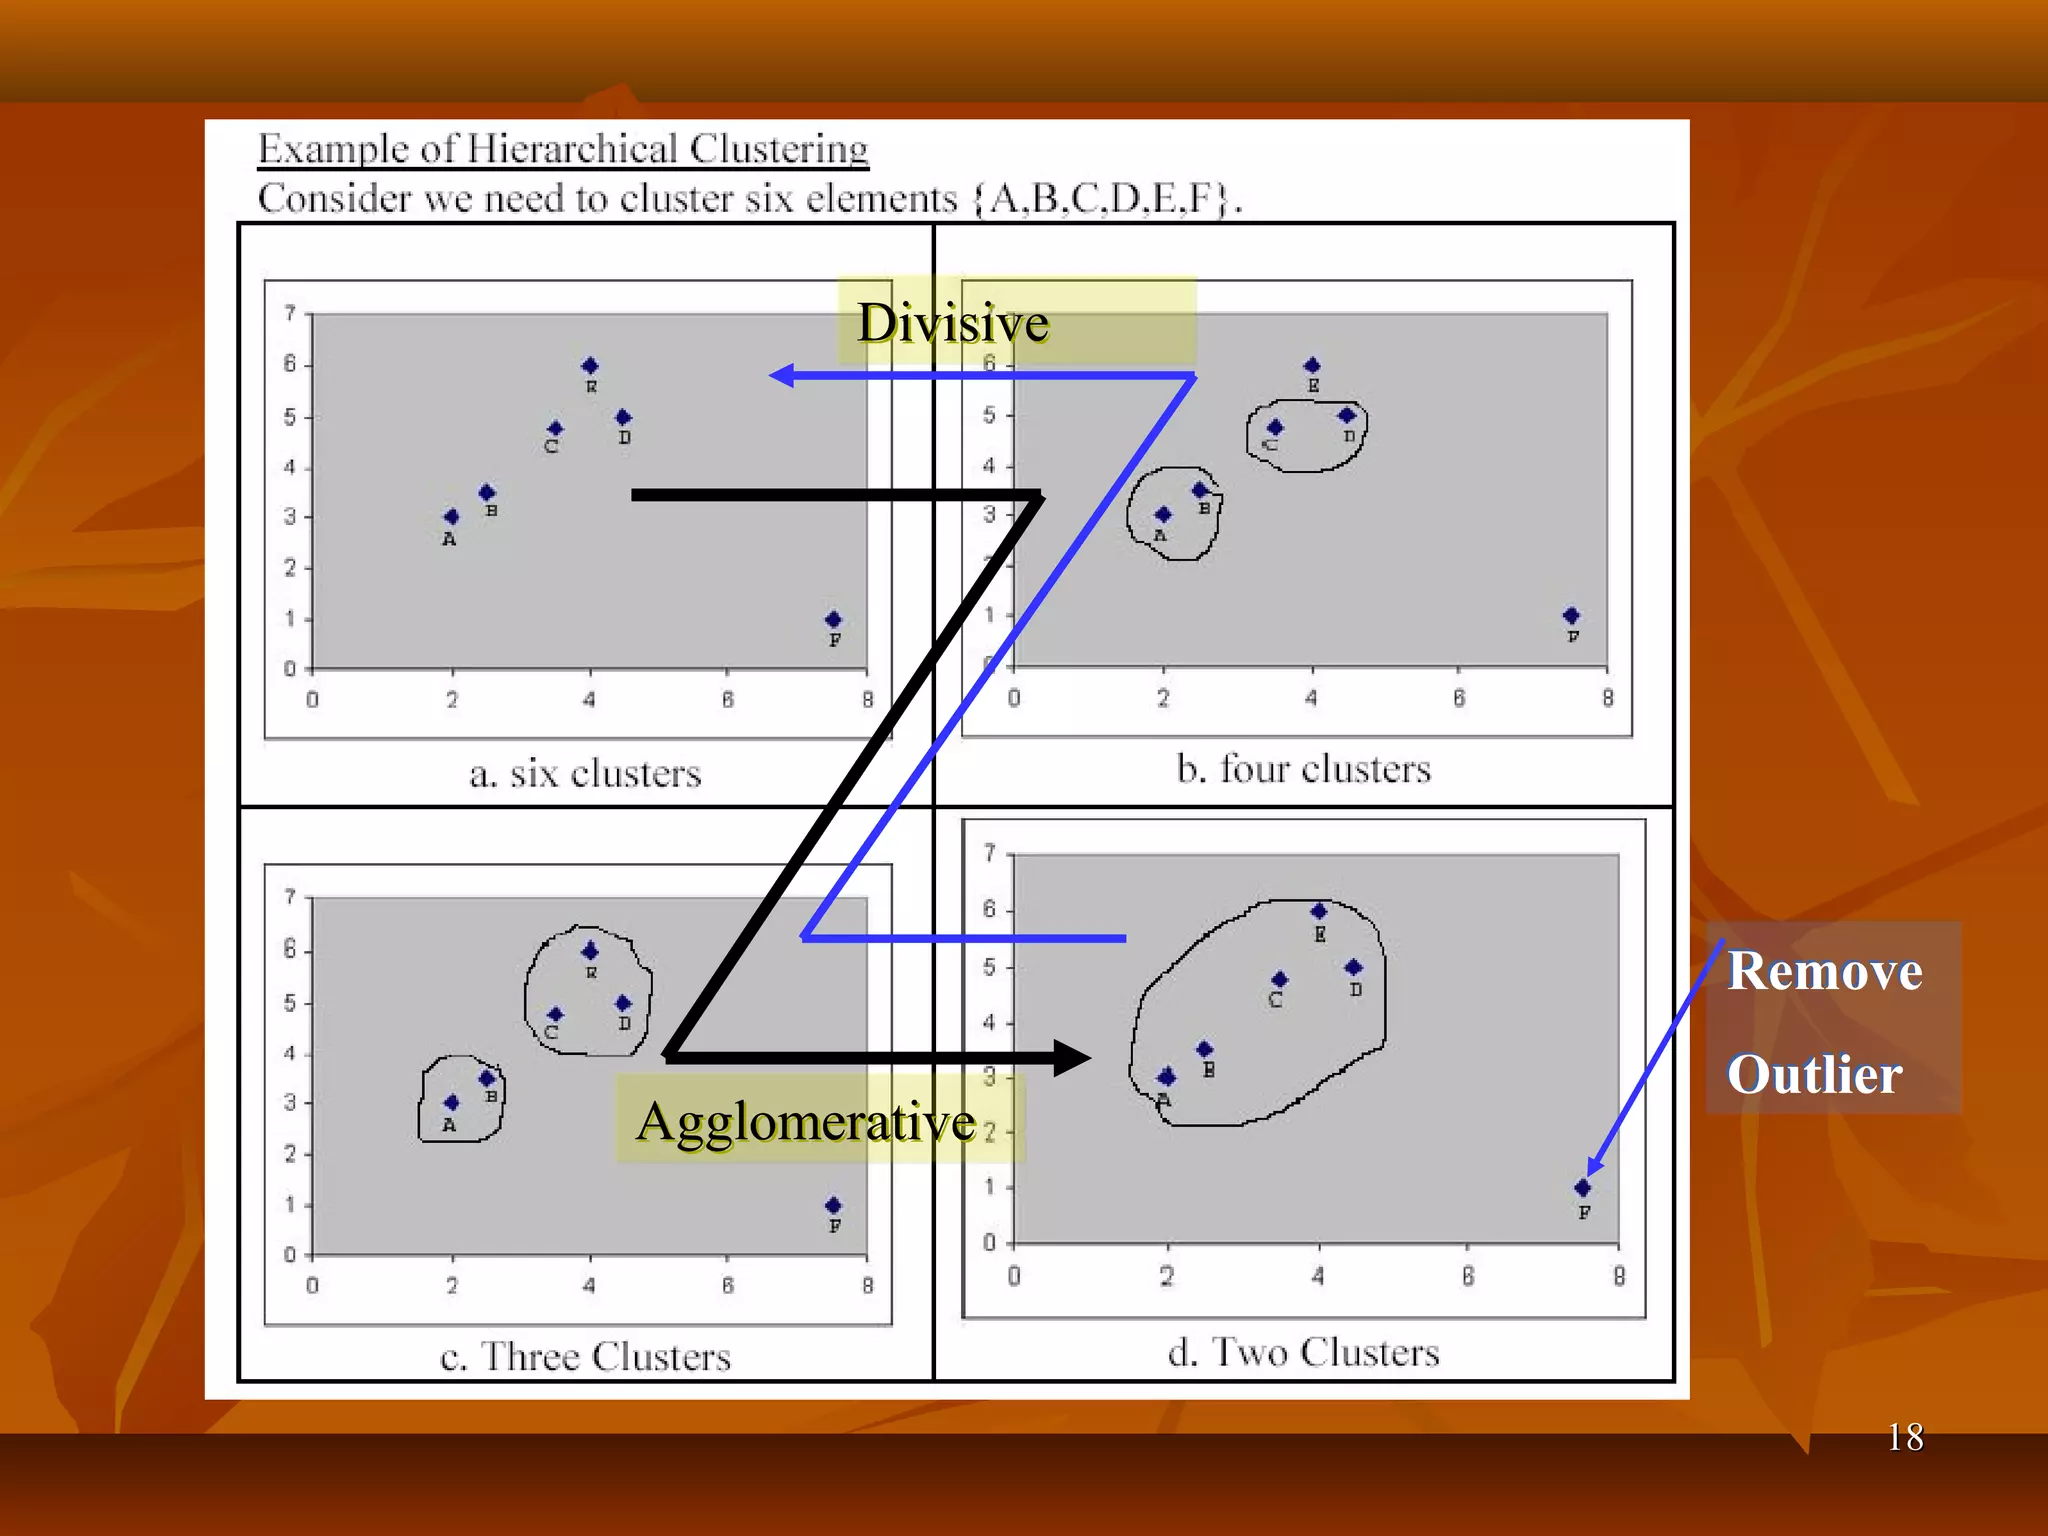
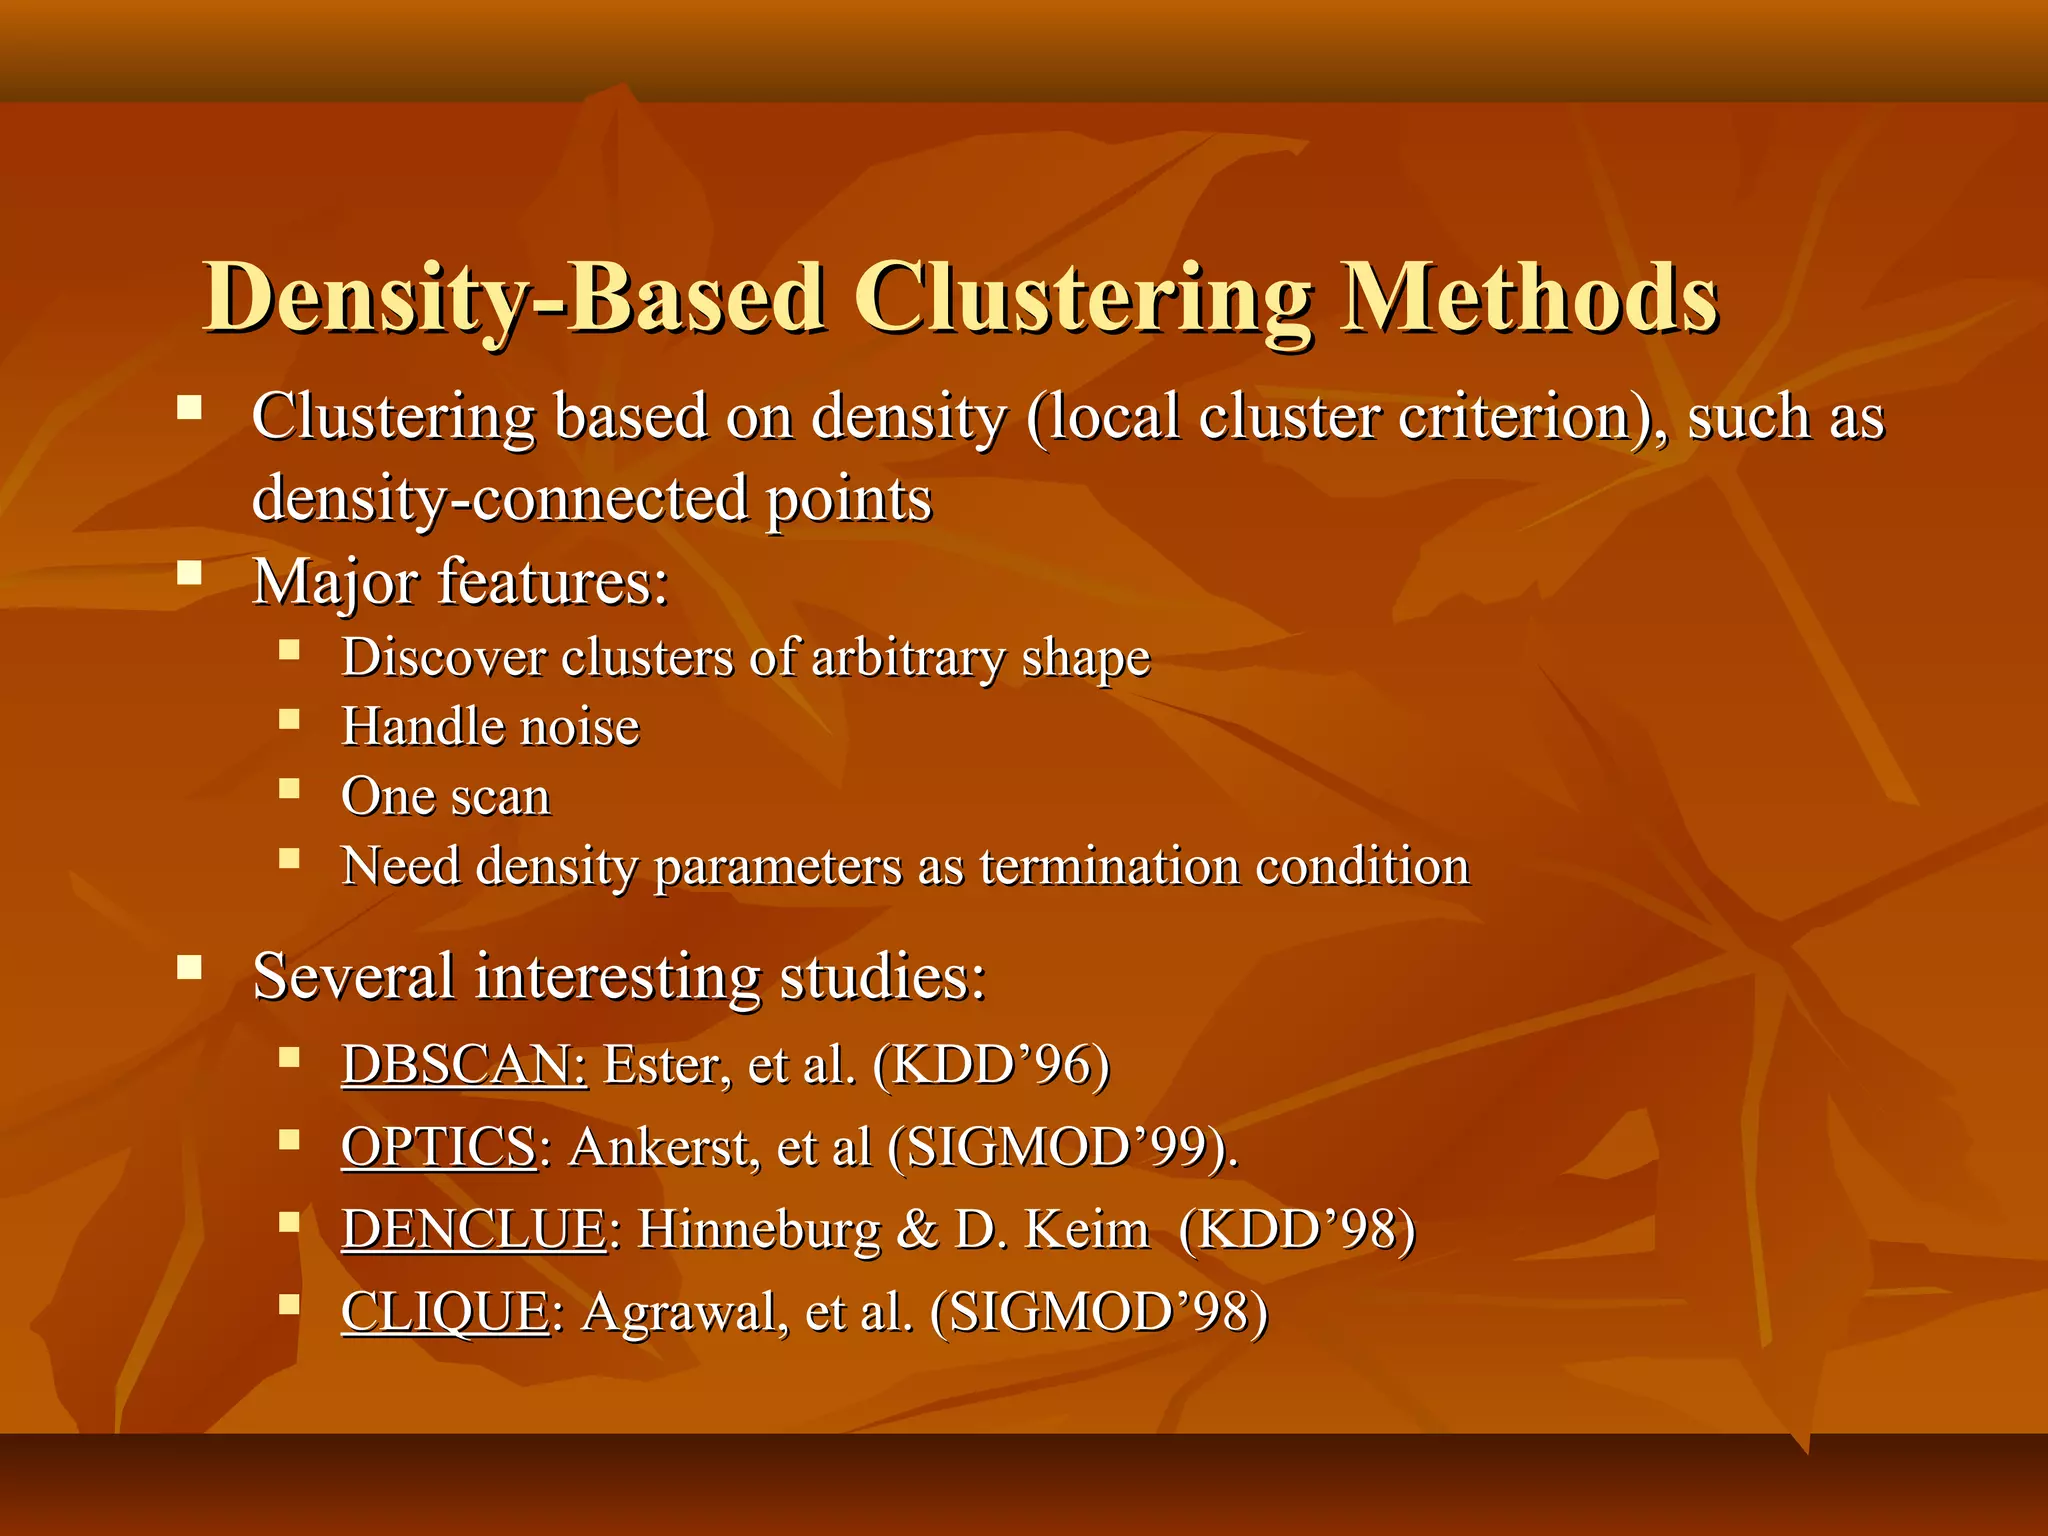
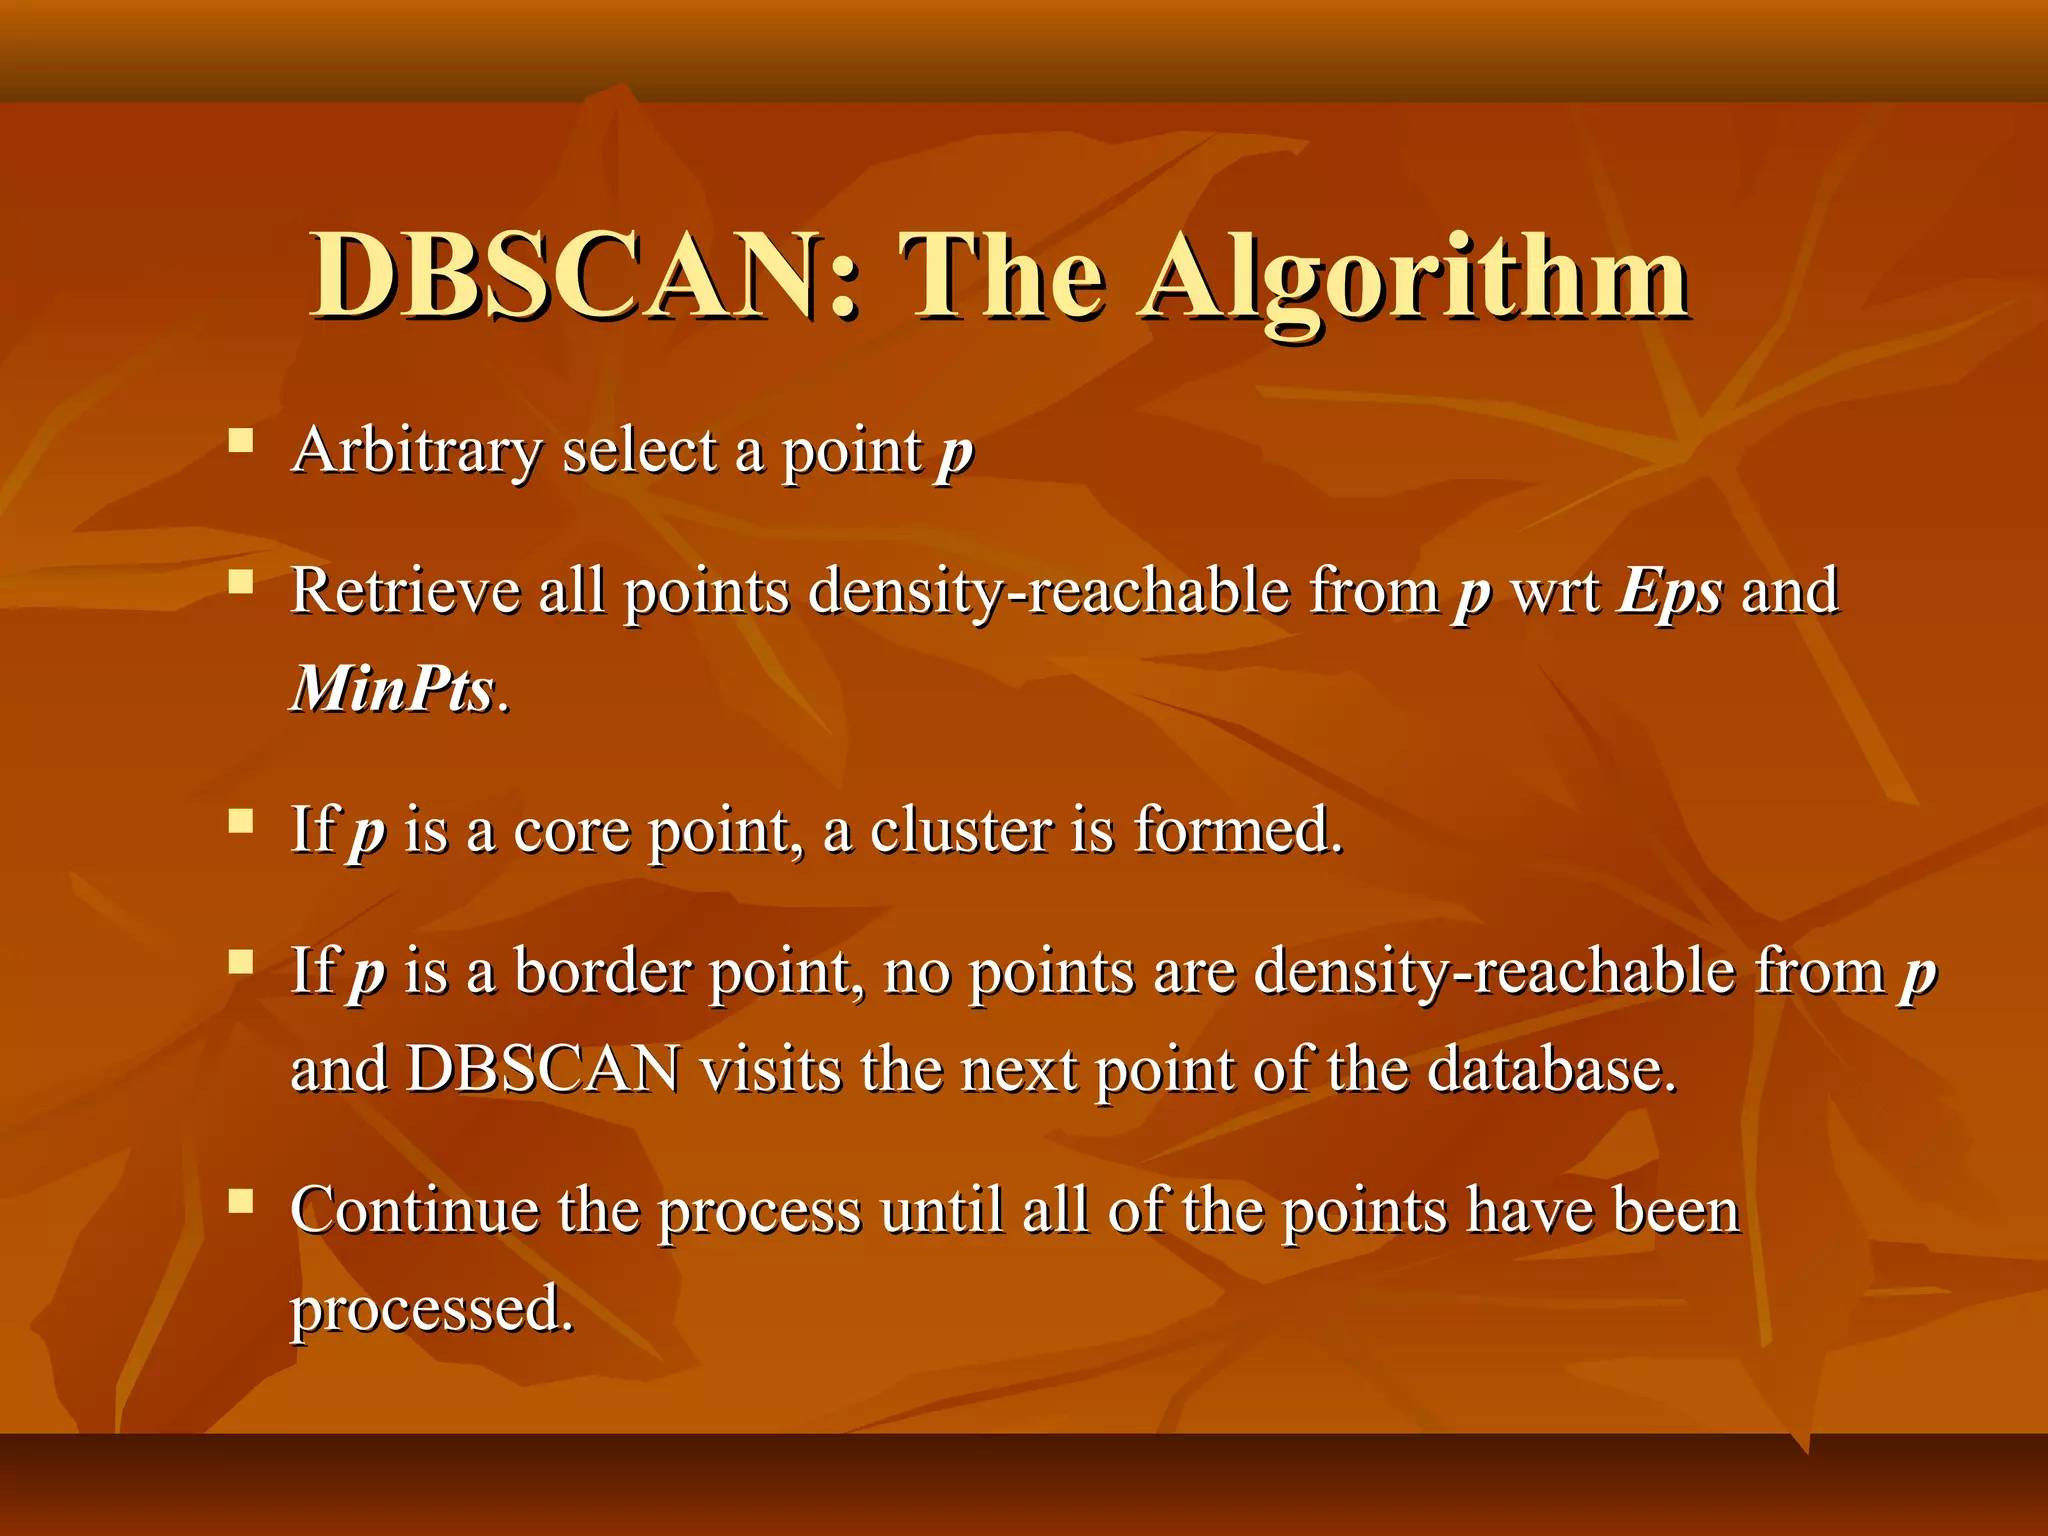
ClusteringClustering
22
ClusteringClustering
 cluster is a collection of data objects, in which the objectscluster is a collection of data objects, in which the objects
similar to one another within the same cluster and dissimilar tosimilar to one another within the same cluster and dissimilar to
the objects in other clustersthe objects in other clusters
 Cluster analysis is the process of finding similarities betweenCluster analysis is the process of finding similarities between
data according to the characteristics found in the data anddata according to the characteristics found in the data and
grouping similar data objects into clusters.grouping similar data objects into clusters.
 Clustering: Given a database D = {t1, t2, .., tn}, a distance
measure dis(ti, tj) defined between any two objects ti and tj,
and an integer value k, the clustering problem is to define a
mapping f: D -> {1, …, k} where each ti is assigned to one
cluster Kj, 1<=j<=k. here ‘k’ is the number of clusters.
33
Examples of Clustering ApplicationsExamples of Clustering Applications
 MarketingMarketing:: Help marketers discover distinct groups in theirHelp marketers discover distinct groups in their
customer bases, and then use this knowledge to develop targetedcustomer bases, and then use this knowledge to develop targeted
marketing programsmarketing programs
 Land useLand use:: Identification of areas of similar land use in an earthIdentification of areas of similar land use in an earth
observation databaseobservation database
 InsuranceInsurance:: Identifying groups of motor insurance policy holdersIdentifying groups of motor insurance policy holders
with a high average claim costwith a high average claim cost
 City-planningCity-planning:: Identifying groups of houses according to theirIdentifying groups of houses according to their
house type, value, and geographical locationhouse type, value, and geographical location
 Earth-quake studiesEarth-quake studies:: Observed earth quake epicenters should beObserved earth quake epicenters should be
clustered along continent faultsclustered along continent faults
44
Categories of ClusteringCategories of Clustering
Distinguish between three main categories (classes) ofDistinguish between three main categories (classes) of
clustering methodsclustering methods
 Partition-basedPartition-based
 HierarchicalHierarchical
 Density-basedDensity-based
 Grid-basedGrid-based
 Model-basedModel-based
55
Partitioning Algorithms: Basic ConceptPartitioning Algorithms: Basic Concept
 Partitioning method:Partitioning method: Construct a partition of a databaseConstruct a partition of a database
DD ofof nn objects into a set ofobjects into a set of kk clustersclusters
 Given aGiven a kk, find a partition of, find a partition of k clustersk clusters that optimizesthat optimizes
the chosen partitioning criterionthe chosen partitioning criterion
 Heuristic methods:Heuristic methods: k-meansk-means andand k-medoidsk-medoids algorithmsalgorithms
 k-meansk-means (MacQueen’67): Each cluster is represented by the(MacQueen’67): Each cluster is represented by the
center of the clustercenter of the cluster
 k-medoidsk-medoids or PAM (Partition around medoids): Each clusteror PAM (Partition around medoids): Each cluster
is represented by one of the objects in the clusteris represented by one of the objects in the cluster
66
TheThe K-MeansK-Means Clustering MethodClustering Method
1.1. Chose k number of clusters to be determinedChose k number of clusters to be determined
2.2. Chose k objects randomly as the initial clusterChose k objects randomly as the initial cluster
centerscenters
3.3. RepeatRepeat
1. Assign each object to their closest cluster center,
using Euclidean distance
2. Compute new cluster centers, calculate mean point
4.4. UntilUntil
1.1. No change in cluster centers orNo change in cluster centers or
2.2. No object change its clustersNo object change its clusters
77
TheThe K-MeansK-Means Clustering MethodClustering Method
88
K-Means ClusteringK-Means Clustering
99
K-Means ClusteringK-Means Clustering
1010
K-Means ClusteringK-Means Clustering
1111
K-Means ClusteringK-Means Clustering
1212
Weakness of K-meansWeakness of K-means
 Applicable only when mean is defined, then
what about categorical data?
 Need to specify K, the number of clusters, in
advance
 run the algorithm with different K values
 Unable to handle noisy data and outliers
 Works best when clusters are of approximately
of equal size
1313
Hierarchical ClusteringHierarchical Clustering
Clustering comes in a form of a tree –Clustering comes in a form of a tree – dendrogramdendrogram
visualizing how data contribute to individualvisualizing how data contribute to individual
clustersclusters
Clustering is realized in a successive mannerClustering is realized in a successive manner
through:through:
 successive splits, orsuccessive splits, or
 successive aggregationssuccessive aggregations
1414
Hierarchical ClusteringHierarchical Clustering
ProvidesProvides graphical illustrationgraphical illustration of relationships between theof relationships between the
data in the form ofdata in the form of dendrogramdendrogram
Dendrogram is a binary treeDendrogram is a binary tree
Two fundamental approaches:Two fundamental approaches:
 Bottom – upBottom – up (agglomerative approach)(agglomerative approach)
 Top-downTop-down (divisive approach)(divisive approach)
1515
Hierarchical Clustering: TypesHierarchical Clustering: Types
 Agglomerative(Agglomerative(Bottom-up or agglomerative)Bottom-up or agglomerative)::
 starts with as many clusters as there are records, with each
cluster having only one record. Then pairs of clusters are
successively merged until the number of clusters reduces to
k.
 at each stage, the pair of clusters are merged which are
nearest to each other. If the merging is continued, it
terminates in the hierarchy of clusters which is built with
just a single cluster containing all the records.
 Divisive algorithm (Top-down or divisive ):Top-down or divisive ): takes
the opposite approach from the agglomerative
techniques. These starts with all the records in one
cluster, and then try to split that clusters into smaller
pieces.
1616
Hierarchical ClusteringHierarchical Clustering
a b c d e f g h
{a}
{b,c,d,e}
{f,g,h}
Top -down Bottom-up
1717
Hierarchical methodsHierarchical methods
 AgglomerativeAgglomerative methods start withmethods start with each object in the dataeach object in the data
forming its own clusterforming its own cluster, and then successively merge the, and then successively merge the
clusters until one large cluster is formed (that encompassesclusters until one large cluster is formed (that encompasses
the entire dataset)the entire dataset)
 DivisiveDivisive methodsmethods start by considering the entire data as onestart by considering the entire data as one
cluster acluster and then split up the cluster(s) until each objectnd then split up the cluster(s) until each object
forms one clusterforms one cluster
1818
AgglomerativeAgglomerative
DivisiveDivisive
Remove
Outlier
Remove
Outlier
Density-Based Clustering MethodsDensity-Based Clustering Methods
 Clustering based on density (local cluster criterion), such asClustering based on density (local cluster criterion), such as
density-connected pointsdensity-connected points
 Major features:Major features:
 Discover clusters of arbitrary shapeDiscover clusters of arbitrary shape
 Handle noiseHandle noise
 One scanOne scan
 Need density parameters as termination conditionNeed density parameters as termination condition
 Several interesting studies:Several interesting studies:
 DBSCAN:DBSCAN: Ester, et al. (KDD’96)Ester, et al. (KDD’96)
 OPTICSOPTICS: Ankerst, et al (SIGMOD’99).: Ankerst, et al (SIGMOD’99).
 DENCLUEDENCLUE: Hinneburg & D. Keim (KDD’98): Hinneburg & D. Keim (KDD’98)
 CLIQUECLIQUE: Agrawal, et al. (SIGMOD’98): Agrawal, et al. (SIGMOD’98)
Density-Based Clustering:Density-Based Clustering:
BackgroundBackground
 The basic termsThe basic terms
 The neighbourhood of an object that enclosed in a circleThe neighbourhood of an object that enclosed in a circle
with radius Eps is called Eps - neighbourhood of thatwith radius Eps is called Eps - neighbourhood of that
objectobject
 Eps neighbourhood with minimum object points is calledEps neighbourhood with minimum object points is called
core object.core object.
 An object A from a dataset is directly density reachableAn object A from a dataset is directly density reachable
from object B where A is the member of Eps-from object B where A is the member of Eps-
neighbourhood of B and B is a core object.neighbourhood of B and B is a core object.
Density-Based Clustering:Density-Based Clustering:
 Density-reachable:Density-reachable:
 A pointA point pp is density-reachable from ais density-reachable from a
pointpoint qq wrt.wrt. EpsEps,, MinPtsMinPts if there is aif there is a
chain of pointschain of points pp11, …,, …, ppnn,, pp11 == qq,, ppnn == pp
such thatsuch that ppi+1i+1 is directly density-is directly density-
reachable fromreachable from ppii
 Density-connectedDensity-connected
 A pointA point pp is density-connected to ais density-connected to a
pointpoint qq wrt.wrt. EpsEps,, MinPtsMinPts if there is aif there is a
pointpoint oo such that both,such that both, pp andand qq areare
density-reachable fromdensity-reachable from oo wrt.wrt. EpsEps andand
MinPtsMinPts..
p
q
p1
p q
o
DBSCAN: Density Based SpatialDBSCAN: Density Based Spatial
Clustering of Applications with NoiseClustering of Applications with Noise
 Relies on aRelies on a density-baseddensity-based notion of cluster: Anotion of cluster: A clustercluster isis
defined as a maximal set of density-connected pointsdefined as a maximal set of density-connected points
 Discovers clusters of arbitrary shape in spatial databases withDiscovers clusters of arbitrary shape in spatial databases with
noisenoise
Core
Border
Outlier
Eps = 1cm
MinPts = 5
DBSCAN: The AlgorithmDBSCAN: The Algorithm
 Arbitrary select a pointArbitrary select a point pp
 Retrieve all points density-reachable fromRetrieve all points density-reachable from pp wrtwrt EpsEps andand
MinPtsMinPts..
 IfIf pp is a core point, a cluster is formed.is a core point, a cluster is formed.
 IfIf pp is a border point, no points are density-reachable fromis a border point, no points are density-reachable from pp
and DBSCAN visits the next point of the database.and DBSCAN visits the next point of the database.
 Continue the process until all of the points have beenContinue the process until all of the points have been
processed.processed.
Grid-Based Clustering MethodGrid-Based Clustering Method
 Using multi-resolution grid data structureUsing multi-resolution grid data structure
 Several interesting methodsSeveral interesting methods
 STINGSTING (a STatistical INformation Grid approach) by(a STatistical INformation Grid approach) by
Wang, Yang and Muntz (1997)Wang, Yang and Muntz (1997)
 WaveClusterWaveCluster by Sheikholeslami, Chatterjee, and Zhangby Sheikholeslami, Chatterjee, and Zhang
(VLDB’98)(VLDB’98)
 A multi-resolution clustering approach usingA multi-resolution clustering approach using
wavelet methodwavelet method
 CLIQUECLIQUE: Agrawal, et al. (SIGMOD’98): Agrawal, et al. (SIGMOD’98)
2525
Grid-Based ClusteringGrid-Based Clustering
Describe structure in data in the language of generic
geometric constructs – hyperboxes and their combinations
Collection of clusters of different
geometry
Formation of clusters by merging
adjacent hyperboxes of the grid
2626
Grid-Based ClusteringGrid-Based Clustering StepsSteps
 Formation of the grid structureFormation of the grid structure
 Insertion of data into the grid structureInsertion of data into the grid structure
 Computation of the density index of each hyperbox of the grid structureComputation of the density index of each hyperbox of the grid structure
 Sorting the hyperboxes with respect to the values of their density indexSorting the hyperboxes with respect to the values of their density index
 Identification of cluster centers (viz. the hyperboxes of the highestIdentification of cluster centers (viz. the hyperboxes of the highest
density)density)
 Traversal of neighboring hyperboxes and merging processTraversal of neighboring hyperboxes and merging process
 Choice of the grid:Choice of the grid:
 too rough grid may not help capture the details of the structure in the data.too rough grid may not help capture the details of the structure in the data.
 too detailed grid produces a significant computational overhead.too detailed grid produces a significant computational overhead.
STING: A Statistical Information GridSTING: A Statistical Information Grid
 The spatial area is divided into rectangular cellsThe spatial area is divided into rectangular cells
 There are several levels of cells corresponding toThere are several levels of cells corresponding to
different levels of resolutiondifferent levels of resolution
STING: A Statistical Information GridSTING: A Statistical Information Grid
 Each cell at a high level is partitioned into a number of smallerEach cell at a high level is partitioned into a number of smaller
cells in the next lower levelcells in the next lower level
 Statistical info of each cell is calculated and stored beforehandStatistical info of each cell is calculated and stored beforehand
and is used to answer queriesand is used to answer queries
 Parameters of higher level cells can be easily calculated fromParameters of higher level cells can be easily calculated from
parameters of lower level cellparameters of lower level cell
 countcount,, meanmean,, ss,, minmin,, maxmax
 type of distribution—normal,type of distribution—normal, uniformuniform, etc., etc.
 For each cell in the current level compute the confidence intervalFor each cell in the current level compute the confidence interval
STING: A Statistical Information GridSTING: A Statistical Information Grid
 Remove the irrelevant cells from further considerationRemove the irrelevant cells from further consideration
 When finish examining the current layer, proceed to the nextWhen finish examining the current layer, proceed to the next
lower levellower level
 Repeat this process until the bottom layer is reachedRepeat this process until the bottom layer is reached
 Advantages:Advantages:
 Query-independent, easy to parallelize, incremental updateQuery-independent, easy to parallelize, incremental update
 O(K),O(K), wherewhere KK is the number of grid cells at the lowest levelis the number of grid cells at the lowest level
 Disadvantages:Disadvantages:
 All the cluster boundaries are either horizontal or vertical,All the cluster boundaries are either horizontal or vertical,
and no diagonal boundary is detectedand no diagonal boundary is detected
Model-Based Clustering MethodsModel-Based Clustering Methods
 Attempt to optimize the fit between the data and someAttempt to optimize the fit between the data and some
mathematical modelmathematical model
 Statistical and AI approachStatistical and AI approach
 COBWEB (Fisher’87)COBWEB (Fisher’87)
 A popular a simple method of incremental conceptual learningA popular a simple method of incremental conceptual learning
 Creates a hierarchical clustering in the form of aCreates a hierarchical clustering in the form of a classification treeclassification tree
 Each node refers to a concept and contains a probabilistic descriptionEach node refers to a concept and contains a probabilistic description
of that conceptof that concept
COBWEB ClusteringCOBWEB Clustering
MethodMethod
A classification tree
SummarySummary
 Cluster analysisCluster analysis groups objects based on theirgroups objects based on their similaritysimilarity
and has wide applicationsand has wide applications
 Clustering algorithms can beClustering algorithms can be categorizedcategorized intointo
partitioning methods, hierarchical methods, density-partitioning methods, hierarchical methods, density-
based methods, grid-based methods, and model-basedbased methods, grid-based methods, and model-based
methodsmethods
 Outlier detectionOutlier detection and analysis are very useful for fraudand analysis are very useful for fraud
detection, etc. and can be performed by statistical,detection, etc. and can be performed by statistical,
distance-based or deviation-based approachesdistance-based or deviation-based approaches

cluster analysis

  • 1.
  • 2.
    22 ClusteringClustering  cluster isa collection of data objects, in which the objectscluster is a collection of data objects, in which the objects similar to one another within the same cluster and dissimilar tosimilar to one another within the same cluster and dissimilar to the objects in other clustersthe objects in other clusters  Cluster analysis is the process of finding similarities betweenCluster analysis is the process of finding similarities between data according to the characteristics found in the data anddata according to the characteristics found in the data and grouping similar data objects into clusters.grouping similar data objects into clusters.  Clustering: Given a database D = {t1, t2, .., tn}, a distance measure dis(ti, tj) defined between any two objects ti and tj, and an integer value k, the clustering problem is to define a mapping f: D -> {1, …, k} where each ti is assigned to one cluster Kj, 1<=j<=k. here ‘k’ is the number of clusters.
  • 3.
    33 Examples of ClusteringApplicationsExamples of Clustering Applications  MarketingMarketing:: Help marketers discover distinct groups in theirHelp marketers discover distinct groups in their customer bases, and then use this knowledge to develop targetedcustomer bases, and then use this knowledge to develop targeted marketing programsmarketing programs  Land useLand use:: Identification of areas of similar land use in an earthIdentification of areas of similar land use in an earth observation databaseobservation database  InsuranceInsurance:: Identifying groups of motor insurance policy holdersIdentifying groups of motor insurance policy holders with a high average claim costwith a high average claim cost  City-planningCity-planning:: Identifying groups of houses according to theirIdentifying groups of houses according to their house type, value, and geographical locationhouse type, value, and geographical location  Earth-quake studiesEarth-quake studies:: Observed earth quake epicenters should beObserved earth quake epicenters should be clustered along continent faultsclustered along continent faults
  • 4.
    44 Categories of ClusteringCategoriesof Clustering Distinguish between three main categories (classes) ofDistinguish between three main categories (classes) of clustering methodsclustering methods  Partition-basedPartition-based  HierarchicalHierarchical  Density-basedDensity-based  Grid-basedGrid-based  Model-basedModel-based
  • 5.
    55 Partitioning Algorithms: BasicConceptPartitioning Algorithms: Basic Concept  Partitioning method:Partitioning method: Construct a partition of a databaseConstruct a partition of a database DD ofof nn objects into a set ofobjects into a set of kk clustersclusters  Given aGiven a kk, find a partition of, find a partition of k clustersk clusters that optimizesthat optimizes the chosen partitioning criterionthe chosen partitioning criterion  Heuristic methods:Heuristic methods: k-meansk-means andand k-medoidsk-medoids algorithmsalgorithms  k-meansk-means (MacQueen’67): Each cluster is represented by the(MacQueen’67): Each cluster is represented by the center of the clustercenter of the cluster  k-medoidsk-medoids or PAM (Partition around medoids): Each clusteror PAM (Partition around medoids): Each cluster is represented by one of the objects in the clusteris represented by one of the objects in the cluster
  • 6.
    66 TheThe K-MeansK-Means ClusteringMethodClustering Method 1.1. Chose k number of clusters to be determinedChose k number of clusters to be determined 2.2. Chose k objects randomly as the initial clusterChose k objects randomly as the initial cluster centerscenters 3.3. RepeatRepeat 1. Assign each object to their closest cluster center, using Euclidean distance 2. Compute new cluster centers, calculate mean point 4.4. UntilUntil 1.1. No change in cluster centers orNo change in cluster centers or 2.2. No object change its clustersNo object change its clusters
  • 7.
    77 TheThe K-MeansK-Means ClusteringMethodClustering Method
  • 8.
  • 9.
  • 10.
  • 11.
  • 12.
    1212 Weakness of K-meansWeaknessof K-means  Applicable only when mean is defined, then what about categorical data?  Need to specify K, the number of clusters, in advance  run the algorithm with different K values  Unable to handle noisy data and outliers  Works best when clusters are of approximately of equal size
  • 13.
    1313 Hierarchical ClusteringHierarchical Clustering Clusteringcomes in a form of a tree –Clustering comes in a form of a tree – dendrogramdendrogram visualizing how data contribute to individualvisualizing how data contribute to individual clustersclusters Clustering is realized in a successive mannerClustering is realized in a successive manner through:through:  successive splits, orsuccessive splits, or  successive aggregationssuccessive aggregations
  • 14.
    1414 Hierarchical ClusteringHierarchical Clustering ProvidesProvidesgraphical illustrationgraphical illustration of relationships between theof relationships between the data in the form ofdata in the form of dendrogramdendrogram Dendrogram is a binary treeDendrogram is a binary tree Two fundamental approaches:Two fundamental approaches:  Bottom – upBottom – up (agglomerative approach)(agglomerative approach)  Top-downTop-down (divisive approach)(divisive approach)
  • 15.
    1515 Hierarchical Clustering: TypesHierarchicalClustering: Types  Agglomerative(Agglomerative(Bottom-up or agglomerative)Bottom-up or agglomerative)::  starts with as many clusters as there are records, with each cluster having only one record. Then pairs of clusters are successively merged until the number of clusters reduces to k.  at each stage, the pair of clusters are merged which are nearest to each other. If the merging is continued, it terminates in the hierarchy of clusters which is built with just a single cluster containing all the records.  Divisive algorithm (Top-down or divisive ):Top-down or divisive ): takes the opposite approach from the agglomerative techniques. These starts with all the records in one cluster, and then try to split that clusters into smaller pieces.
  • 16.
    1616 Hierarchical ClusteringHierarchical Clustering ab c d e f g h {a} {b,c,d,e} {f,g,h} Top -down Bottom-up
  • 17.
    1717 Hierarchical methodsHierarchical methods AgglomerativeAgglomerative methods start withmethods start with each object in the dataeach object in the data forming its own clusterforming its own cluster, and then successively merge the, and then successively merge the clusters until one large cluster is formed (that encompassesclusters until one large cluster is formed (that encompasses the entire dataset)the entire dataset)  DivisiveDivisive methodsmethods start by considering the entire data as onestart by considering the entire data as one cluster acluster and then split up the cluster(s) until each objectnd then split up the cluster(s) until each object forms one clusterforms one cluster
  • 18.
  • 19.
    Density-Based Clustering MethodsDensity-BasedClustering Methods  Clustering based on density (local cluster criterion), such asClustering based on density (local cluster criterion), such as density-connected pointsdensity-connected points  Major features:Major features:  Discover clusters of arbitrary shapeDiscover clusters of arbitrary shape  Handle noiseHandle noise  One scanOne scan  Need density parameters as termination conditionNeed density parameters as termination condition  Several interesting studies:Several interesting studies:  DBSCAN:DBSCAN: Ester, et al. (KDD’96)Ester, et al. (KDD’96)  OPTICSOPTICS: Ankerst, et al (SIGMOD’99).: Ankerst, et al (SIGMOD’99).  DENCLUEDENCLUE: Hinneburg & D. Keim (KDD’98): Hinneburg & D. Keim (KDD’98)  CLIQUECLIQUE: Agrawal, et al. (SIGMOD’98): Agrawal, et al. (SIGMOD’98)
  • 20.
    Density-Based Clustering:Density-Based Clustering: BackgroundBackground The basic termsThe basic terms  The neighbourhood of an object that enclosed in a circleThe neighbourhood of an object that enclosed in a circle with radius Eps is called Eps - neighbourhood of thatwith radius Eps is called Eps - neighbourhood of that objectobject  Eps neighbourhood with minimum object points is calledEps neighbourhood with minimum object points is called core object.core object.  An object A from a dataset is directly density reachableAn object A from a dataset is directly density reachable from object B where A is the member of Eps-from object B where A is the member of Eps- neighbourhood of B and B is a core object.neighbourhood of B and B is a core object.
  • 21.
    Density-Based Clustering:Density-Based Clustering: Density-reachable:Density-reachable:  A pointA point pp is density-reachable from ais density-reachable from a pointpoint qq wrt.wrt. EpsEps,, MinPtsMinPts if there is aif there is a chain of pointschain of points pp11, …,, …, ppnn,, pp11 == qq,, ppnn == pp such thatsuch that ppi+1i+1 is directly density-is directly density- reachable fromreachable from ppii  Density-connectedDensity-connected  A pointA point pp is density-connected to ais density-connected to a pointpoint qq wrt.wrt. EpsEps,, MinPtsMinPts if there is aif there is a pointpoint oo such that both,such that both, pp andand qq areare density-reachable fromdensity-reachable from oo wrt.wrt. EpsEps andand MinPtsMinPts.. p q p1 p q o
  • 22.
    DBSCAN: Density BasedSpatialDBSCAN: Density Based Spatial Clustering of Applications with NoiseClustering of Applications with Noise  Relies on aRelies on a density-baseddensity-based notion of cluster: Anotion of cluster: A clustercluster isis defined as a maximal set of density-connected pointsdefined as a maximal set of density-connected points  Discovers clusters of arbitrary shape in spatial databases withDiscovers clusters of arbitrary shape in spatial databases with noisenoise Core Border Outlier Eps = 1cm MinPts = 5
  • 23.
    DBSCAN: The AlgorithmDBSCAN:The Algorithm  Arbitrary select a pointArbitrary select a point pp  Retrieve all points density-reachable fromRetrieve all points density-reachable from pp wrtwrt EpsEps andand MinPtsMinPts..  IfIf pp is a core point, a cluster is formed.is a core point, a cluster is formed.  IfIf pp is a border point, no points are density-reachable fromis a border point, no points are density-reachable from pp and DBSCAN visits the next point of the database.and DBSCAN visits the next point of the database.  Continue the process until all of the points have beenContinue the process until all of the points have been processed.processed.
  • 24.
    Grid-Based Clustering MethodGrid-BasedClustering Method  Using multi-resolution grid data structureUsing multi-resolution grid data structure  Several interesting methodsSeveral interesting methods  STINGSTING (a STatistical INformation Grid approach) by(a STatistical INformation Grid approach) by Wang, Yang and Muntz (1997)Wang, Yang and Muntz (1997)  WaveClusterWaveCluster by Sheikholeslami, Chatterjee, and Zhangby Sheikholeslami, Chatterjee, and Zhang (VLDB’98)(VLDB’98)  A multi-resolution clustering approach usingA multi-resolution clustering approach using wavelet methodwavelet method  CLIQUECLIQUE: Agrawal, et al. (SIGMOD’98): Agrawal, et al. (SIGMOD’98)
  • 25.
    2525 Grid-Based ClusteringGrid-Based Clustering Describestructure in data in the language of generic geometric constructs – hyperboxes and their combinations Collection of clusters of different geometry Formation of clusters by merging adjacent hyperboxes of the grid
  • 26.
    2626 Grid-Based ClusteringGrid-Based ClusteringStepsSteps  Formation of the grid structureFormation of the grid structure  Insertion of data into the grid structureInsertion of data into the grid structure  Computation of the density index of each hyperbox of the grid structureComputation of the density index of each hyperbox of the grid structure  Sorting the hyperboxes with respect to the values of their density indexSorting the hyperboxes with respect to the values of their density index  Identification of cluster centers (viz. the hyperboxes of the highestIdentification of cluster centers (viz. the hyperboxes of the highest density)density)  Traversal of neighboring hyperboxes and merging processTraversal of neighboring hyperboxes and merging process  Choice of the grid:Choice of the grid:  too rough grid may not help capture the details of the structure in the data.too rough grid may not help capture the details of the structure in the data.  too detailed grid produces a significant computational overhead.too detailed grid produces a significant computational overhead.
  • 27.
    STING: A StatisticalInformation GridSTING: A Statistical Information Grid  The spatial area is divided into rectangular cellsThe spatial area is divided into rectangular cells  There are several levels of cells corresponding toThere are several levels of cells corresponding to different levels of resolutiondifferent levels of resolution
  • 28.
    STING: A StatisticalInformation GridSTING: A Statistical Information Grid  Each cell at a high level is partitioned into a number of smallerEach cell at a high level is partitioned into a number of smaller cells in the next lower levelcells in the next lower level  Statistical info of each cell is calculated and stored beforehandStatistical info of each cell is calculated and stored beforehand and is used to answer queriesand is used to answer queries  Parameters of higher level cells can be easily calculated fromParameters of higher level cells can be easily calculated from parameters of lower level cellparameters of lower level cell  countcount,, meanmean,, ss,, minmin,, maxmax  type of distribution—normal,type of distribution—normal, uniformuniform, etc., etc.  For each cell in the current level compute the confidence intervalFor each cell in the current level compute the confidence interval
  • 29.
    STING: A StatisticalInformation GridSTING: A Statistical Information Grid  Remove the irrelevant cells from further considerationRemove the irrelevant cells from further consideration  When finish examining the current layer, proceed to the nextWhen finish examining the current layer, proceed to the next lower levellower level  Repeat this process until the bottom layer is reachedRepeat this process until the bottom layer is reached  Advantages:Advantages:  Query-independent, easy to parallelize, incremental updateQuery-independent, easy to parallelize, incremental update  O(K),O(K), wherewhere KK is the number of grid cells at the lowest levelis the number of grid cells at the lowest level  Disadvantages:Disadvantages:  All the cluster boundaries are either horizontal or vertical,All the cluster boundaries are either horizontal or vertical, and no diagonal boundary is detectedand no diagonal boundary is detected
  • 30.
    Model-Based Clustering MethodsModel-BasedClustering Methods  Attempt to optimize the fit between the data and someAttempt to optimize the fit between the data and some mathematical modelmathematical model  Statistical and AI approachStatistical and AI approach  COBWEB (Fisher’87)COBWEB (Fisher’87)  A popular a simple method of incremental conceptual learningA popular a simple method of incremental conceptual learning  Creates a hierarchical clustering in the form of aCreates a hierarchical clustering in the form of a classification treeclassification tree  Each node refers to a concept and contains a probabilistic descriptionEach node refers to a concept and contains a probabilistic description of that conceptof that concept
  • 31.
  • 32.
    SummarySummary  Cluster analysisClusteranalysis groups objects based on theirgroups objects based on their similaritysimilarity and has wide applicationsand has wide applications  Clustering algorithms can beClustering algorithms can be categorizedcategorized intointo partitioning methods, hierarchical methods, density-partitioning methods, hierarchical methods, density- based methods, grid-based methods, and model-basedbased methods, grid-based methods, and model-based methodsmethods  Outlier detectionOutlier detection and analysis are very useful for fraudand analysis are very useful for fraud detection, etc. and can be performed by statistical,detection, etc. and can be performed by statistical, distance-based or deviation-based approachesdistance-based or deviation-based approaches