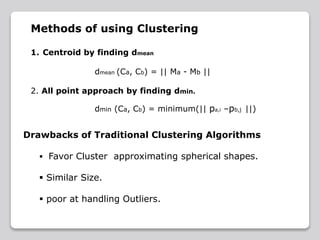
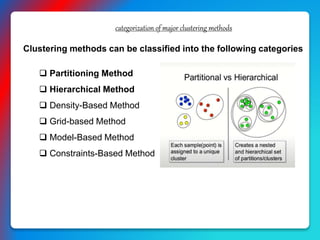
This document discusses various clustering analysis methods including k-means, k-medoids (PAM), and CLARA. It explains that clustering involves grouping similar objects together without predefined classes. Partitioning methods like k-means and k-medoids (PAM) assign objects to clusters to optimize a criterion function. K-means uses cluster centroids while k-medoids uses actual data points as cluster representatives. PAM is more robust to outliers than k-means but does not scale well to large datasets, so CLARA applies PAM to samples of the data. Examples of clustering applications include market segmentation, land use analysis, and earthquake studies.
K-means clustering is an algorithm that groups data points into k number of clusters based on their similarity. It works by randomly selecting k data points as initial cluster centroids and then assigning each remaining point to the closest centroid. It then recalculates the centroids and reassigns points in an iterative process until centroids stabilize. While efficient, k-means clustering has weaknesses in that it requires specifying k, can get stuck in local optima, and is not suitable for non-convex shaped clusters or noisy data.
Clustering is the process of grouping similar objects together. It allows data to be analyzed and summarized. There are several methods of clustering including partitioning, hierarchical, density-based, grid-based, and model-based. Hierarchical clustering methods are either agglomerative (bottom-up) or divisive (top-down). Density-based methods like DBSCAN and OPTICS identify clusters based on density. Grid-based methods impose grids on data to find dense regions. Model-based clustering uses models like expectation-maximization. High-dimensional data can be clustered using subspace or dimension-reduction methods. Constraint-based clustering allows users to specify preferences.
K-means clustering is an algorithm that groups data points into k clusters based on their similarity, with each point assigned to the cluster with the nearest mean. It works by randomly selecting k cluster centroids and then iteratively assigning data points to the closest centroid and recalculating the centroids until convergence. K-means clustering is fast, efficient, and commonly used for vector quantization, image segmentation, and discovering customer groups in marketing. Its runtime complexity is O(t*k*n) where t is the number of iterations, k is the number of clusters, and n is the number of data points.
This document discusses clustering, which is the task of grouping data points into clusters so that points within the same cluster are more similar to each other than points in other clusters. It describes different types of clustering methods, including density-based, hierarchical, partitioning, and grid-based methods. It provides examples of specific clustering algorithms like K-means, DBSCAN, and discusses applications of clustering in fields like marketing, biology, libraries, insurance, city planning, and earthquake studies.
Cluster analysis is a technique used to classify objects into groups called clusters based on their similarities. It has many applications in areas like market research, biology, and image processing. There are different types of clustering methods like partitioning, hierarchical, density-based, and grid-based. The k-means algorithm is a commonly used partitioning method where objects are grouped into k clusters based on their distances from centroid points, which are recalculated in each iteration until cluster memberships stabilize. Cluster analysis helps discover patterns and insights from large datasets.
This document discusses unsupervised machine learning classification through clustering. It defines clustering as the process of grouping similar items together, with high intra-cluster similarity and low inter-cluster similarity. The document outlines common clustering algorithms like K-means and hierarchical clustering, and describes how K-means works by assigning points to centroids and iteratively updating centroids. It also discusses applications of clustering in domains like marketing, astronomy, genomics and more.
This document discusses various unsupervised machine learning clustering algorithms. It begins with an introduction to unsupervised learning and clustering. It then explains k-means clustering, hierarchical clustering, and DBSCAN clustering. For k-means and hierarchical clustering, it covers how they work, their advantages and disadvantages, and compares the two. For DBSCAN, it defines what it is, how it identifies core points, border points, and outliers to form clusters based on density.
The document discusses different clustering techniques used for grouping large amounts of data. It covers partitioning methods like k-means and k-medoids that organize data into exclusive groups. It also describes hierarchical methods like agglomerative and divisive clustering that arrange data into nested groups or trees. Additionally, it mentions density-based and grid-based clustering and provides algorithms for different clustering approaches.
Clustering is an unsupervised learning technique used to group unlabeled data points together based on similarities. It aims to maximize similarity within clusters and minimize similarity between clusters. There are several clustering methods including partitioning, hierarchical, density-based, grid-based, and model-based. Clustering has many applications such as pattern recognition, image processing, market research, and bioinformatics. It is useful for extracting hidden patterns from large, complex datasets.
This document outlines topics to be covered in a presentation on K-means clustering. It will discuss the introduction of K-means clustering, how the algorithm works, provide an example, and applications. The key aspects are that K-means clustering partitions data into K clusters based on similarity, assigns data points to the closest centroid, and recalculates centroids until clusters are stable. It is commonly used for market segmentation, computer vision, astronomy, and agriculture.
This course is all about the data mining that how we get the optimized results. it included with all types and how we use these techniques.This course is all about the data mining that how we get the optimized results. it included with all types and how we use these techniques.This course is all about the data mining that how we get the optimized results. it included with all types and how we use these techniques.This course is all about the data mining that how we get the optimized results. it included with all types and how we use these techniques.This course is all about the data mining that how we get the optimized results. it included with all types and how we use these techniques
This document provides an overview of clustering and classification techniques in data mining. It defines clustering and classification as unsupervised and supervised learning respectively. The document discusses how classification works by building a model from training data and then using the model to classify new data. For clustering, it explains that clusters are formed by grouping similar data objects without predefined labels. The document also describes different types of clustering techniques like hierarchical, partitioning, and probabilistic clustering. Finally, it provides a step-by-step explanation of the k-means clustering algorithm.
- Hierarchical clustering produces nested clusters organized as a hierarchical tree called a dendrogram. It can be either agglomerative, where each point starts in its own cluster and clusters are merged, or divisive, where all points start in one cluster which is recursively split.
- Common hierarchical clustering algorithms include single linkage (minimum distance), complete linkage (maximum distance), group average, and Ward's method. They differ in how they calculate distance between clusters during merging.
- K-means is a partitional clustering algorithm that divides data into k non-overlapping clusters based on minimizing distance between points and cluster centroids. It is fast but sensitive to initialization and assumes spherical clusters of similar size and density.
Cluster analysis is a technique used to group objects based on characteristics they possess. It involves measuring the distance or similarity between objects and grouping those that are most similar together. There are two main types: hierarchical cluster analysis, which groups objects sequentially into clusters; and nonhierarchical cluster analysis, which directly assigns objects to pre-specified clusters. The choice of method depends on factors like sample size and research objectives.
Data Science - Part VII - Cluster AnalysisDerek Kane
This lecture provides an overview of clustering techniques, including K-Means, Hierarchical Clustering, and Gaussian Mixed Models. We will go through some methods of calibration and diagnostics and then apply the technique on a recognizable dataset.
This presentation introduces clustering analysis and the k-means clustering technique. It defines clustering as an unsupervised method to segment data into groups with similar traits. The presentation outlines different clustering types (hard vs soft), techniques (partitioning, hierarchical, etc.), and describes the k-means algorithm in detail through multiple steps. It discusses requirements for clustering, provides examples of applications, and reviews advantages and disadvantages of k-means clustering.
K-means clustering is an algorithm that groups data points into k clusters based on their attributes and distances from initial cluster center points. It works by first randomly selecting k data points as initial centroids, then assigning all other points to the closest centroid and recalculating the centroids. This process repeats until the centroids are stable or a maximum number of iterations is reached. K-means clustering is widely used for machine learning applications like image segmentation and speech recognition due to its efficiency, but it is sensitive to initialization and assumes spherical clusters of similar size and density.
Cluster analysis is used to group similar objects together and separate dissimilar objects. It has applications in understanding data patterns and reducing large datasets. The main types are partitional which divides data into non-overlapping subsets, and hierarchical which arranges clusters in a tree structure. Popular clustering algorithms include k-means, hierarchical clustering, and graph-based clustering. K-means partitions data into k clusters by minimizing distances between points and cluster centroids, but requires specifying k and is sensitive to initial centroid positions. Hierarchical clustering creates nested clusters without needing to specify the number of clusters, but has higher computational costs.
This is very simple introduction to Clustering with some real world example. At the end of lecture I use stackOverflow API to test some clustering. I also wants to try facebook but it has some problem with it's API
The document discusses K-means clustering, an unsupervised machine learning algorithm that partitions observations into k clusters defined by centroids. It compares clustering to classification, noting clustering does not use training data and maps observations into natural groupings. The K-means algorithm is then explained, with the steps of initializing centroids, assigning observations to the closest centroid, revising centroids as cluster means, and repeating until convergence. Applications of clustering in business contexts like banking, retail, and insurance are also briefly mentioned.
Predictive modeling is a process used in predictive analytics to create statistical models that can forecast future outcomes based on historical data. Predictive modeling uses techniques from data mining, statistics, and machine learning to analyze current data to make predictions. The predictive modeling process involves collecting data, creating a model, testing and validating the model, and evaluating the model's performance. Predictive models are commonly used to predict customer behavior, risk levels, product performance, and more. Industries like retail, healthcare, finance, and telecommunications frequently use predictive modeling techniques.
This document discusses machine learning concepts including supervised vs. unsupervised learning, clustering algorithms, and specific clustering methods like k-means and k-nearest neighbors. It provides examples of how clustering can be used for applications such as market segmentation and astronomical data analysis. Key clustering algorithms covered are hierarchy methods, partitioning methods, k-means which groups data by assigning objects to the closest cluster center, and k-nearest neighbors which classifies new data based on its closest training examples.
This document discusses various machine learning techniques for classification and prediction. It covers decision tree induction, tree pruning, Bayesian classification, Bayesian belief networks, backpropagation, association rule mining, and ensemble methods like bagging and boosting. Classification involves predicting categorical labels while prediction predicts continuous values. Key steps for preparing data include cleaning, transformation, and comparing different methods based on accuracy, speed, robustness, scalability, and interpretability.
2.1 Data Mining-classification Basic conceptsKrish_ver2
This document discusses classification and decision trees. It defines classification as predicting categorical class labels using a model constructed from a training set. Decision trees are a popular classification method that operate in a top-down recursive manner, splitting the data into purer subsets based on attribute values. The algorithm selects the optimal splitting attribute using an evaluation metric like information gain at each step until it reaches a leaf node containing only one class.
Cluster analysis is an unsupervised machine learning technique that groups unlabeled data points into clusters. The goal is to categorize data objects such that objects within a cluster are as similar as possible to each other, and as dissimilar as possible to objects in other clusters. Good clustering produces high quality clusters with high intra-class similarity and low inter-class similarity. Clustering has applications in marketing, land use analysis, insurance, and other domains.
This document provides information about clustering and cluster analysis. It begins by defining clustering as the process of grouping objects into classes of similar objects. It then discusses what a cluster is and different types of clustering techniques, including partitioning methods like k-means clustering. K-means clustering is explained as an algorithm that assigns objects to clusters based on minimizing distance between objects and cluster centers, then updating the cluster centers. Examples are provided to demonstrate how k-means clustering works on a sample dataset.
UNIT - 4: Data Warehousing and Data MiningNandakumar P
UNIT-IV
Cluster Analysis: Types of Data in Cluster Analysis – A Categorization of Major Clustering Methods – Partitioning Methods – Hierarchical methods – Density, Based Methods – Grid, Based Methods – Model, Based Clustering Methods – Clustering High, Dimensional Data – Constraint, Based Cluster Analysis – Outlier Analysis.
Cluster analysis is an unsupervised machine learning technique used to group similar objects together. It partitions data into clusters where objects within a cluster are as similar as possible to each other, and as dissimilar as possible to objects in other clusters. There are several clustering methods including partitioning, hierarchical, density-based, grid-based, and model-based. Clustering is widely used in applications such as market segmentation, document classification, and fraud detection.
It is a data mining technique used to place the data elements into their related groups. Clustering is the process of partitioning the data (or objects) into the same class, The data in one class is more similar to each other than to those in other cluster.
The document discusses clustering and its applications in contour detection. It notes that while clustering is widely used to organize unlabeled data and remove noise, there are still challenges. Specifically, selecting an appropriate data set, determining the number of clusters, and validating results can be ambiguous. Clustering algorithms are also sensitive to these parameters and the data set properties. Contour extraction methods also lack efficiency and universality. Improved clustering techniques are needed that can be more effectively applied to contour detection problems across different data sets.
The document summarizes the CURE clustering algorithm, which uses a hierarchical approach that selects a constant number of representative points from each cluster to address limitations of centroid-based and all-points clustering methods. It employs random sampling and partitioning to speed up processing of large datasets. Experimental results show CURE detects non-spherical and variably-sized clusters better than compared methods, and it has faster execution times on large databases due to its sampling approach.
This document provides an overview of clustering and k-means clustering algorithms. It begins by defining clustering as the process of grouping similar objects together and dissimilar objects separately. K-means clustering is introduced as an algorithm that partitions data points into k clusters by minimizing total intra-cluster variance, iteratively updating cluster means. The k-means algorithm and an example are described in detail. Weaknesses and applications are discussed. Finally, vector quantization and principal component analysis are briefly introduced.
Clustering and Classification Algorithms Ankita DubeyAnkita Dubey
Clustering is a process of partitioning a set of data (or objects) into a set of meaningful sub-classes, called clusters. Help users understand the natural grouping or structure in a data set. Used either as a stand-alone tool to get insight into data distribution or as a preprocessing step for other algorithms.
Unsupervised learning Algorithms and Assumptionsrefedey275
Topics :
Introduction to unsupervised learning
Unsupervised learning Algorithms and Assumptions
K-Means algorithm – introduction
Implementation of K-means algorithm
Hierarchical Clustering – need and importance of hierarchical clustering
Agglomerative Hierarchical Clustering
Working of dendrogram
Steps for implementation of AHC using Python
Gaussian Mixture Models – Introduction, importance and need of the model
Normal , Gaussian distribution
Implementation of Gaussian mixture model
Understand the different distance metrics used in clustering
Euclidean, Manhattan, Cosine, Mahala Nobis
Features of a Cluster – Labels, Centroids, Inertia, Eigen vectors and Eigen values
Principal component analysis
Supervised learning (classification)
Supervision: The training data (observations, measurements, etc.) are accompanied by labels indicating the class of the observations
New data is classified based on the training set
Unsupervised learning (clustering)
The class labels of training data is unknown
Given a set of measurements, observations, etc. with the aim of establishing the existence of classes or clusters in the data
Types of Hierarchical Clustering
There are mainly two types of hierarchical clustering:
Agglomerative hierarchical clustering
Divisive Hierarchical clustering
A distribution in statistics is a function that shows the possible values for a variable and how often they occur.
In probability theory and statistics, the Normal Distribution, also called the Gaussian Distribution.
is the most significant continuous probability distribution.
Sometimes it is also called a bell curve.
This document summarizes a research paper that evaluates cluster quality using a modified density subspace clustering approach. It discusses how density subspace clustering can be used to identify clusters in high-dimensional datasets by detecting density-connected clusters in all subspaces. The proposed approach uses a density subspace clustering algorithm to select attribute subsets and identify the best clusters. It then calculates intra-cluster and inter-cluster distances to evaluate cluster quality and compares the results to other clustering algorithms in terms of accuracy and runtime. Experimental results showed that the proposed method improves clustering quality and performs faster than existing techniques.
A survey on Efficient Enhanced K-Means Clustering Algorithmijsrd.com
Data mining is the process of using technology to identify patterns and prospects from large amount of information. In Data Mining, Clustering is an important research topic and wide range of unverified classification application. Clustering is technique which divides a data into meaningful groups. K-means clustering is a method of cluster analysis which aims to partition n observations into k clusters in which each observation belongs to the cluster with the nearest mean. In this paper, we present the comparison of different K-means clustering algorithms.
This document discusses unsupervised machine learning techniques for clustering unlabeled data. It covers k-means clustering, which partitions data into k groups based on minimizing distance between points and cluster centroids. It also discusses agglomerative hierarchical clustering, which successively merges clusters based on their distance. As an example, it shows hierarchical clustering of texture images from five classes to group similar textures.
Clustering is an unsupervised machine learning technique used to group unlabeled data points. There are two main approaches: hierarchical clustering and partitioning clustering. Partitioning clustering algorithms like k-means and k-medoids attempt to partition data into k clusters by optimizing a criterion function. Hierarchical clustering creates nested clusters by merging or splitting clusters. Examples of hierarchical algorithms include agglomerative clustering, which builds clusters from bottom-up, and divisive clustering, which separates clusters from top-down. Clustering can group both numerical and categorical data.
Clustering is an unsupervised machine learning technique that groups unlabeled data points into clusters based on similarities. It can be used for tasks like market segmentation, image segmentation, and anomaly detection. The k-means clustering algorithm is a common partitioning clustering method that divides data into k predefined clusters by minimizing distances between data points and cluster centroids.
The document provides an overview of clustering methods and algorithms. It defines clustering as the process of grouping objects that are similar to each other and dissimilar to objects in other groups. It discusses existing clustering methods like K-means, hierarchical clustering, and density-based clustering. For each method, it outlines the basic steps and provides an example application of K-means clustering to demonstrate how the algorithm works. The document also discusses evaluating clustering results and different measures used to assess cluster validity.
This document discusses hierarchical clustering algorithms. It describes hierarchical clustering as a method that forms clusters based on a hierarchical (tree-like) structure, with new clusters being formed from previously established clusters. There are two main approaches: agglomerative, which is a bottom-up approach that treats each data point as an individual cluster initially, and divisive, which is a top-down approach that treats all data points as one cluster initially. The document provides examples of hierarchical clustering algorithms and discusses key aspects like linkage criteria and interpreting dendrograms.
This document discusses different methods of cluster analysis. Cluster analysis is a statistical technique that groups similar objects together into clusters. There are several categories of clustering methods, including partitioning, hierarchical, density-based, grid-based, model-based, and constraint-based. The partitioning method divides data into a set number of partitions or clusters, while hierarchical methods create hierarchical groupings by either merging or dividing clusters. Density-based clustering focuses on grouping areas of high density, and grid-based clustering quantizes space into a grid for faster processing. Model-based clustering fits data to hypothesized models, and constraint-based clustering incorporates user-defined constraints.
Clustering is an unsupervised machine learning technique that groups unlabeled data points together based on similarities. There are several types of clustering algorithms, including hierarchical, k-means, density-based, model-based, grid-based, and distribution-based algorithms. Each algorithm uses different methods to define clusters, such as distance between points, density of points, or fitting to statistical models. K-means clustering partitions data into k clusters by minimizing distances between points and cluster centroids.
Step by step operations by which we make a group of objects in which attributes
of all the objects are nearly similar, known as clustering. So, a cluster is a collection of
objects that acquire nearly same attribute values. The property of an object in a cluster is
similar to other objects in same cluster but different with objects of other clusters.
Clustering is used in wide range of applications like pattern recognition, image processing,
data analysis, machine learning etc. Nowadays, more attention has been put on categorical
data rather than numerical data. Where, the range of numerical attributes organizes in a
class like small, medium, high, and so on. There is wide range of algorithm that used to
make clusters of given categorical data. Our approach is to enhance the working on well-
known clustering algorithm k-modes to improve accuracy of algorithm. We proposed a new
approach named “High Accuracy Clustering Algorithm for Categorical datasets”.
Lecture 11 - KNN and Clustering, a lecture in subject module Statistical & Ma...Maninda Edirisooriya
Supervised ML technique, K-Nearest Neighbor and Unsupervised Clustering techniques are learnt in this lesson. This was one of the lectures of a full course I taught in University of Moratuwa, Sri Lanka on 2023 second half of the year.
Learn SQL from basic queries to Advance queriesmanishkhaire30
Dive into the world of data analysis with our comprehensive guide on mastering SQL! This presentation offers a practical approach to learning SQL, focusing on real-world applications and hands-on practice. Whether you're a beginner or looking to sharpen your skills, this guide provides the tools you need to extract, analyze, and interpret data effectively.
Key Highlights:
Foundations of SQL: Understand the basics of SQL, including data retrieval, filtering, and aggregation.
Advanced Queries: Learn to craft complex queries to uncover deep insights from your data.
Data Trends and Patterns: Discover how to identify and interpret trends and patterns in your datasets.
Practical Examples: Follow step-by-step examples to apply SQL techniques in real-world scenarios.
Actionable Insights: Gain the skills to derive actionable insights that drive informed decision-making.
Join us on this journey to enhance your data analysis capabilities and unlock the full potential of SQL. Perfect for data enthusiasts, analysts, and anyone eager to harness the power of data!
#DataAnalysis #SQL #LearningSQL #DataInsights #DataScience #Analytics
Predictably Improve Your B2B Tech Company's Performance by Leveraging DataKiwi Creative
Harness the power of AI-backed reports, benchmarking and data analysis to predict trends and detect anomalies in your marketing efforts.
Peter Caputa, CEO at Databox, reveals how you can discover the strategies and tools to increase your growth rate (and margins!).
From metrics to track to data habits to pick up, enhance your reporting for powerful insights to improve your B2B tech company's marketing.
- - -
This is the webinar recording from the June 2024 HubSpot User Group (HUG) for B2B Technology USA.
Watch the video recording at https://youtu.be/5vjwGfPN9lw
Sign up for future HUG events at https://events.hubspot.com/b2b-technology-usa/
End-to-end pipeline agility - Berlin Buzzwords 2024Lars Albertsson
We describe how we achieve high change agility in data engineering by eliminating the fear of breaking downstream data pipelines through end-to-end pipeline testing, and by using schema metaprogramming to safely eliminate boilerplate involved in changes that affect whole pipelines.
A quick poll on agility in changing pipelines from end to end indicated a huge span in capabilities. For the question "How long time does it take for all downstream pipelines to be adapted to an upstream change," the median response was 6 months, but some respondents could do it in less than a day. When quantitative data engineering differences between the best and worst are measured, the span is often 100x-1000x, sometimes even more.
A long time ago, we suffered at Spotify from fear of changing pipelines due to not knowing what the impact might be downstream. We made plans for a technical solution to test pipelines end-to-end to mitigate that fear, but the effort failed for cultural reasons. We eventually solved this challenge, but in a different context. In this presentation we will describe how we test full pipelines effectively by manipulating workflow orchestration, which enables us to make changes in pipelines without fear of breaking downstream.
Making schema changes that affect many jobs also involves a lot of toil and boilerplate. Using schema-on-read mitigates some of it, but has drawbacks since it makes it more difficult to detect errors early. We will describe how we have rejected this tradeoff by applying schema metaprogramming, eliminating boilerplate but keeping the protection of static typing, thereby further improving agility to quickly modify data pipelines without fear.
Orchestrating the Future: Navigating Today's Data Workflow Challenges with Ai...Kaxil Naik
Navigating today's data landscape isn't just about managing workflows; it's about strategically propelling your business forward. Apache Airflow has stood out as the benchmark in this arena, driving data orchestration forward since its early days. As we dive into the complexities of our current data-rich environment, where the sheer volume of information and its timely, accurate processing are crucial for AI and ML applications, the role of Airflow has never been more critical.
In my journey as the Senior Engineering Director and a pivotal member of Apache Airflow's Project Management Committee (PMC), I've witnessed Airflow transform data handling, making agility and insight the norm in an ever-evolving digital space. At Astronomer, our collaboration with leading AI & ML teams worldwide has not only tested but also proven Airflow's mettle in delivering data reliably and efficiently—data that now powers not just insights but core business functions.
This session is a deep dive into the essence of Airflow's success. We'll trace its evolution from a budding project to the backbone of data orchestration it is today, constantly adapting to meet the next wave of data challenges, including those brought on by Generative AI. It's this forward-thinking adaptability that keeps Airflow at the forefront of innovation, ready for whatever comes next.
The ever-growing demands of AI and ML applications have ushered in an era where sophisticated data management isn't a luxury—it's a necessity. Airflow's innate flexibility and scalability are what makes it indispensable in managing the intricate workflows of today, especially those involving Large Language Models (LLMs).
This talk isn't just a rundown of Airflow's features; it's about harnessing these capabilities to turn your data workflows into a strategic asset. Together, we'll explore how Airflow remains at the cutting edge of data orchestration, ensuring your organization is not just keeping pace but setting the pace in a data-driven future.
Session in https://budapestdata.hu/2024/04/kaxil-naik-astronomer-io/ | https://dataml24.sessionize.com/session/667627
The Ipsos - AI - Monitor 2024 Report.pdfSocial Samosa
According to Ipsos AI Monitor's 2024 report, 65% Indians said that products and services using AI have profoundly changed their daily life in the past 3-5 years.
Beyond the Basics of A/B Tests: Highly Innovative Experimentation Tactics You...Aggregage
This webinar will explore cutting-edge, less familiar but powerful experimentation methodologies which address well-known limitations of standard A/B Testing. Designed for data and product leaders, this session aims to inspire the embrace of innovative approaches and provide insights into the frontiers of experimentation!
2. • Introduction
• categorization of major clustering methods
• partitioning methods
• Hierarchical methods
• outlier analysis
Contents
3. Clustering
• It is basically a type of Unsupervised learning method;
• It is a method in which we draw reference from datasets consisting of
input data without labeled responses.
• Clustering is the task of dividing the population or data point into a
number of groups such that data point in the same groups are more
similar to other data points in the same group and dissimilar to the data
points in other groups.
•There are no criteria for a good clustering, It depends on the user, what
is the criteria they may use which satisfy their need.
Introduction
4. Drawbacks of Traditional Clustering Algorithms
Favor Cluster approximating spherical shapes.
Similar Size.
poor at handling Outliers.
Methods of using Clustering
1. Centroid by finding dmean
dmean (Ca, Cb) = || Ma - Mb ||
2. All point approach by finding dmin.
dmin (Ca, Cb) = minimum(|| pa,i –pb,j ||)
5. Application of cluster analysis:
• It is widely used in many applications such as image processing, data
analysis, and pattern recognition.
• It can be used in the field of biology, by deriving animal and plant
taxonomies, Identifying genes with the same capabilities.
• It also helps in information discovery by classifying documents on the web.
• Clustering is used in outlier detection application such as detection of
credit card fraud.
• It also help in identification of areas of similar land use in an earth
observation database.
6. categorization of major clustering methods
Clustering methods can be classified into the following categories
Partitioning Method
Hierarchical Method
Density-Based Method
Grid-based Method
Model-Based Method
Constraints-Based Method
7. Partitioning Method
These Methods partition the object into k cluster and each partition forms one
cluster.
• Each group has at least one Object, each object belonging to one group
• In this method starts with one big cluster and downward step by
step reaches the number of cluster wanted partitioning the existing
clusters.
• Then it uses the iterative relocation technique to improve the partitioning
by moving object from one group to other.
• There are many algorithms that come under partitioning methods
some the popular are: K-means, CLARANS(Clustering Large Application
based upon Randomized Search) etc.
8. K-Mean (A centroid based Technique)
• We are given a data set of items, with certain futures, and values
for these features (Like a vector).
• The tasks to categorize those items into groups. To achieve this,
we will use the k-Means algorithm.
• An unsupervised learning algorithm.
• The algorithms will categorize the items into k groups of
similarity.
• To calculate the similarity, we will use the Euclidean distance as
measurement.
The algorithm works as follows:
1. First we initialize k points, called means, randomly.
9. 1. First we initialize k points, called means, randomly.
2. We categorize each item to its closest mean and we update the
mean’s coordinates, which are the averages of the items
categorized in that mean so far.
3. We repeat the process for a given number of iterations and at the
end, we have our clusters.
The “Points” mentioned above are called means, because they hold
the mean values of the items categorized in it.
10. Hierarchical Methods
In this method starts with single point cluster and
upward step by step merge cluster until desired number of
cluster is reached.
• It is begins by treating every data point as a separate cluster.
• New cluster is formed using the previously formed one.
• It is divided into two category:
Agglomerative (Bottom up approach)
Divisive (Top down approach)
• Example: CURE (Clustering Using Representatives), BIRCH
(Balanced Iterative Reducing Clustering and using Hierarchies)
etc.
11. Basic Concept of CURE Algorithm
CURE(Clustering using Representatives)
It is a hierarchical based clustering technique, that adopts a
middle ground between the centroid based and the all-point
techniques.
It is used for identifying the spherical and non-spherical
clusters.
Pre defined representatives points.
Works with the outliers.
Shrinking the cluster with the factor.
13. Random Sampling
When all data set is considered as input of algorithm,
execution time could be high due to the I/O costs. So,
Random samples are considered as input of algorithm.
Random sampling is fitted in main memory.
Random samples are generated very fast.
The overhead of generating random sample is very small
compared to the time for performing the clustering on the
sample.
14. Partitioning Sample
Random samples are created.
Partitioning helps to speed up the CURE algorithm.
The steps followed are
Partition the data point into different partitions.(n/p).
The advantage of partitioning the input is to reduce the
execution time.
Each n/p group of point fit in the main memory for increasing
performance of partial clustering.
15. Handling Outlier
Random sampling filter out the majority of outliers.
Outliers due to their larger distance from the points tend
to merge with other point, and grow slower.
Number of outliers are less then clusters.
So, first the clusters which are growing very slowly are
identified and eliminated.
Second, at the end of growing process,, very small
cluster are eliminated.
17. Labeling Data on Disk
The process of sampling the initial data set, exclude the
majority of data points. This data point must be assigned to
some cluster created in former phases.
Conclusion
We have see that CURE can detect cluster with non-spherical
shape and wide variance in size using a set of representative
point for each cluster.
CURE can also have a good execution time in presence of large
database using random sampling and partitioning methods.
CURE works well when the database contains outliers. These
are detected and eliminated.