Purpose of clusteranalysis
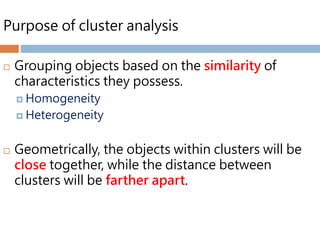
Grouping objects based on the similarity of
characteristics they possess.
Homogeneity
Heterogeneity
Geometrically, the objects within clusters will be
close together, while the distance between
clusters will be farther apart.
8.
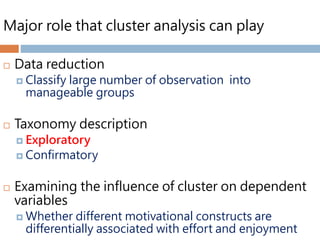
Major role thatcluster analysis can play
Data reduction
Classify large number of observation into
manageable groups
Taxonomy description
Exploratory
Confirmatory
Examining the influence of cluster on dependent
variables
Whether different motivational constructs are
differentially associated with effort and enjoyment
9.
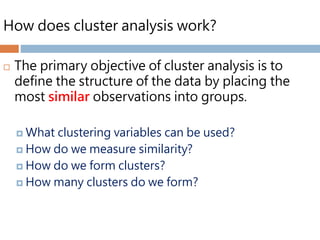
How does clusteranalysis work?
The primary objective of cluster analysis is to
define the structure of the data by placing the
most similar observations into groups.
What clustering variables can be used?
How do we measure similarity?
How do we form clusters?
How many clusters do we form?
10.
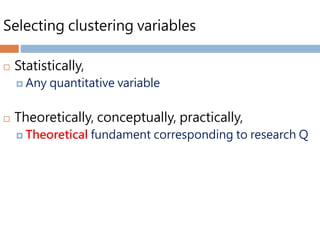
Selecting clustering variables
Statistically,
Any quantitative variable
Theoretically, conceptually, practically,
Theoretical fundament corresponding to research Q
11.
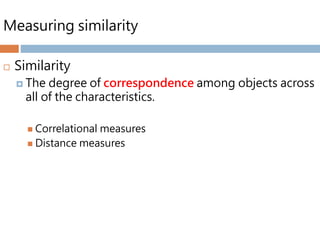
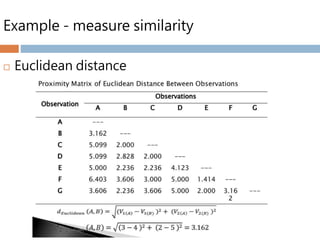
Measuring similarity
Similarity
The degree of correspondence among objects across
all of the characteristics.
Correlational measures
Distance measures
12.
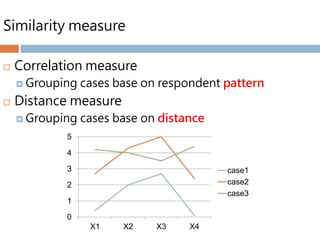
Similarity measure
Correlationmeasure
Grouping cases base on respondent pattern
Distance measure
Grouping cases base on distance
0
1
2
3
4
5
X1 X2 X3 X4
case1
case2
case3
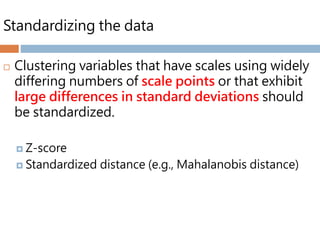
Standardizing the data
Clustering variables that have scales using widely
differing numbers of scale points or that exhibit
large differences in standard deviations should
be standardized.
Z-score
Standardized distance (e.g., Mahalanobis distance)
24.
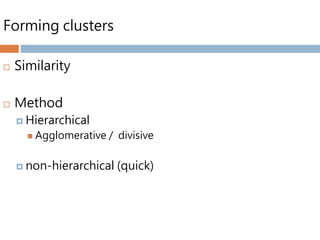
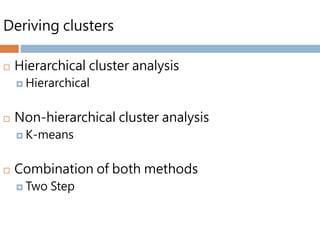
Deriving clusters
Hierarchicalcluster analysis
Hierarchical
Non-hierarchical cluster analysis
K-means
Combination of both methods
Two Step
Hierarchical cluster analysis(HCA)
The stepwise procedure
Agglomerate or divide group step by step
Agglomerative (SPSS selected)
Aggregate object with object / cluster with cluster
N clusters to 1 cluster
Divisive
Separate cluster to object
1 cluster to n clusters
Agglomerative aglorithms
Singlelinkage / neighbor method
Defines similarity between clusters as the shortest
distance from any object in one cluster to any object
in the other.
Pics:
Retrieved from: http://ppt.cc/uKm0
30.
Agglomerative aglorithms
Completelinkage / Farthest – neighbor method
Defines two clusters based on the maximum distance
between any two members in the two clusters.
31.
Agglomerative aglorithms
Centroidmethod
Cluster centroids
Are the mean values of the observation on the variables of
the cluster
The distance between the two clusters equals the
distance between the two centroids
32.
Agglomerative aglorithms
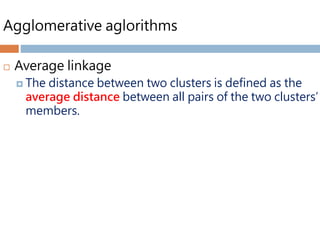
Averagelinkage
The distance between two clusters is defined as the
average distance between all pairs of the two clusters’
members.
33.
Agglomerative aglorithms
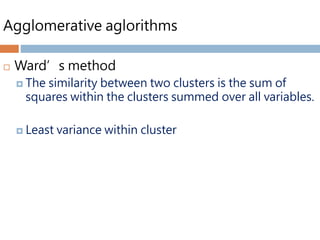
Ward’smethod
The similarity between two clusters is the sum of
squares within the clusters summed over all variables.
Least variance within cluster
34.
Number of clusters
Theoretical specified
Statistical stopping rule
Measures of heterogeneity change
35.
Hierarchical cluster analysis
The hierarchical cluster analysis provides an
excellent framework with which to compare any
set of cluster solutions.
This method helps in judging how many clusters
should be retained or considered.
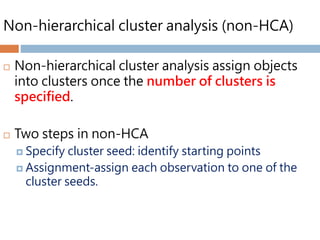
Non-hierarchical cluster analysis(non-HCA)
Non-hierarchical cluster analysis assign objects
into clusters once the number of clusters is
specified.
Two steps in non-HCA
Specify cluster seed: identify starting points
Assignment-assign each observation to one of the
cluster seeds.
38.
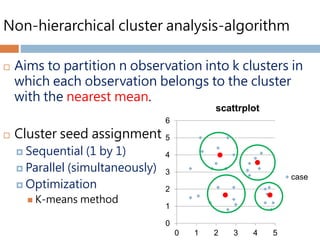
Non-hierarchical cluster analysis-algorithm
Aims to partition n observation into k clusters in
which each observation belongs to the cluster
with the nearest mean.
Cluster seed assignment
Sequential (1 by 1)
Parallel (simultaneously)
Optimization
K-means method
0
1
2
3
4
5
6
0 1 2 3 4 5
scattrplot
case
39.
Pros and Consof HCA
Advantage
Comprehensive information
A wide range of alternative clustering solution
Disadvantage
Outliers
Large samples / large numbers of variable
40.
Pros and Consof non-HCA
Advantage
Less susceptible to outliers
Extremely large data sets
Disadvantage
Less information
Susceptible to initial seed point
41.
Combination of eachmethod
Two step
Hierarchical technique is used to select the number
of clusters and profile clusters centers that serve as
initial cluster seeds in the nonhierarchical procedure.
A nonhierarchical method then clusters all
observations using the seed points to provide more
accurate cluster memberships.
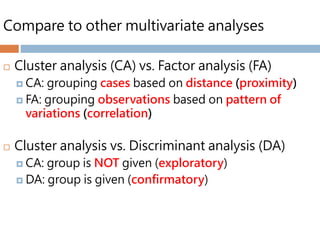
Compare to othermultivariate analyses
Cluster analysis (CA) vs. Factor analysis (FA)
CA: grouping cases based on distance (proximity)
FA: grouping observations based on pattern of
variations (correlation)
Cluster analysis vs. Discriminant analysis (DA)
CA: group is NOT given (exploratory)
DA: group is given (confirmatory)
46.
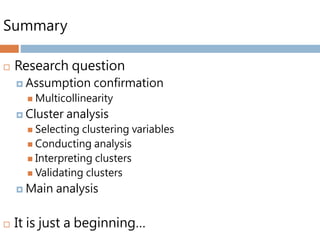
Summary
Research question
Assumption confirmation
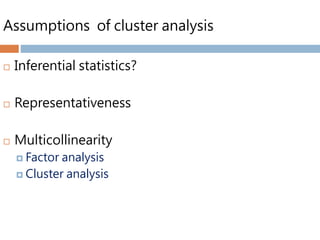
Multicollinearity
Cluster analysis
Selecting clustering variables
Conducting analysis
Interpreting clusters
Validating clusters
Main analysis
It is just a beginning…


![제 23회 보아즈(BOAZ) 빅데이터 컨퍼런스 - [MBOAX] : ABSA를 활용한 소비자 반응 분석 기반 운영 효율화 대시보드 설계](https://cdn.slidesharecdn.com/ss_thumbnails/3-1boaz23rdconferencemboax-260203102709-9d519923-thumbnail.jpg?width=640&height=640&fit=bounds)


