Download to read offline
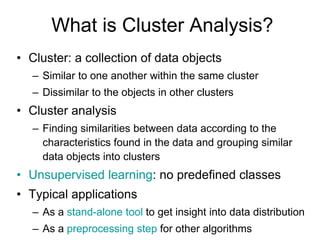

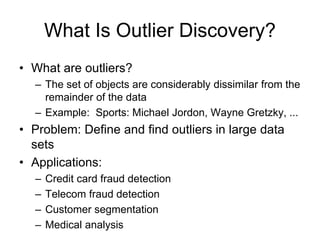

This document discusses cluster analysis and clustering algorithms. It defines a cluster as a collection of similar data objects that are dissimilar from objects in other clusters. Unsupervised learning is used with no predefined classes. Popular clustering algorithms include k-means, hierarchical, density-based, and model-based approaches. Quality clustering produces high intra-class similarity and low inter-class similarity. Outlier detection finds dissimilar objects to identify anomalies.