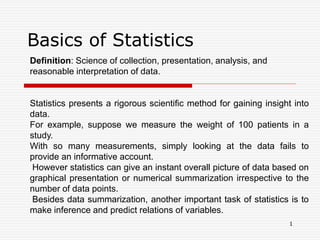
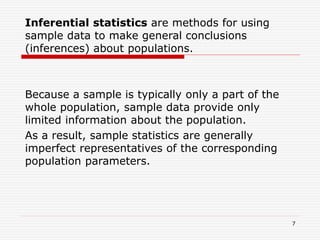
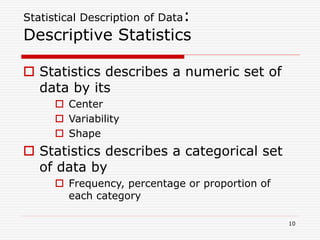
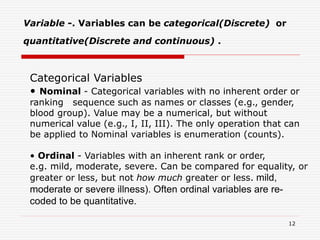
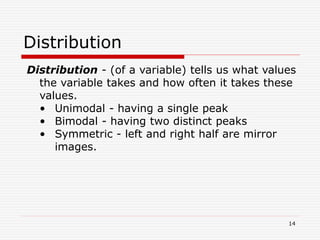
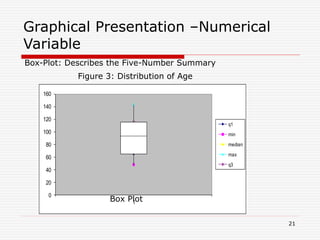
SlideShare a Scribd company logo
Basics of Statistics
Definition: Science of collection, presentation, analysis, and
reasonable interpretation of data.
Statistics presents a rigorous scientific method for gaining insight into
data.
For example, suppose we measure the weight of 100 patients in a
study.
With so many measurements, simply looking at the data fails to
provide an informative account.
However statistics can give an instant overall picture of data based on
graphical presentation or numerical summarization irrespective to the
number of data points.
Besides data summarization, another important task of statistics is to
make inference and predict relations of variables.
1
Data
 The measurements obtained in a
research study are called the data.
 The goal of statistics is to help
researchers organize and interpret
the data.
2
 Descriptive statistics are methods for
organizing and summarizing data.
 For example, tables or graphs are used to
organize data, and descriptive values
such as the average score are used to
summarize data.
 A descriptive value for a population is
called a parameter and a descriptive
value for a sample is called a statistic.
Descriptive Statistics
3
Inferential Statistics
4
5
DataAnalysis
From Data Analysis to
Inference
Population
Samples
Collect data from a
representative
Sample...
Perform Data
Analysis, keeping
probability in mind…
Make an Inference
about the Population.
6
Inferential statistics are methods for using
sample data to make general conclusions
(inferences) about populations.
Because a sample is typically only a part of the
whole population, sample data provide only
limited information about the population.
As a result, sample statistics are generally
imperfect representatives of the corresponding
population parameters.
7
 The discrepancy between a sample
statistic and its population parameter
is called sampling error.
 Defining and measuring sampling error
is a large part of inferential statistics.
Sampling Error
8
A Taxonomy of Statistics
9
Statistical Description of Data:
Descriptive Statistics
 Statistics describes a numeric set of
data by its
 Center
 Variability
 Shape
 Statistics describes a categorical set
of data by
 Frequency, percentage or proportion of
each category
10
Variable
 A variable is a characteristic or condition that
can change or take on different values.
Or any characteristic of an individual or an entity
 Most research begins with a general question
about the relationship between two variables
for a specific group of individuals.
11
Variable -. Variables can be categorical(Discrete) or
quantitative(Discrete and continuous) .
Categorical Variables
• Nominal - Categorical variables with no inherent order or
ranking sequence such as names or classes (e.g., gender,
blood group). Value may be a numerical, but without
numerical value (e.g., I, II, III). The only operation that can
be applied to Nominal variables is enumeration (counts).
• Ordinal - Variables with an inherent rank or order,
e.g. mild, moderate, severe. Can be compared for equality, or
greater or less, but not how much greater or less. mild,
moderate or severe illness). Often ordinal variables are re-
coded to be quantitative.
12
Interval - Values of the variable are ordered as in
Ordinal, and additionally, differences between values
are meaningful, however, the scale is not absolutely
anchored.
Calendar dates and temperatures on the Fahrenheit
scale are examples Addition and subtraction, but not
multiplication and division are meaningful operations.
Ratio - Variables with all properties of Interval plus an
absolute, non-arbitrary zero point, e.g. age, weight,
temperature (Kelvin). Addition, subtraction,
multiplication, and division are all meaningful
operations.
Variables (Contd)
13
Distribution
Distribution - (of a variable) tells us what values
the variable takes and how often it takes these
values.
• Unimodal - having a single peak
• Bimodal - having two distinct peaks
• Symmetric - left and right half are mirror
images.
14
Frequency Distribution
Age 1 2 3 4 5 6
Frequency 5 3 7 5 4 2
Frequency Distribution of Age
Grouped Frequency Distribution of Age:
Age Group 1-2 3-4 5-6
Frequency 8 12 6
Consider a data set of 26 children of ages 1-6 years. Then the
frequency distribution of variable ‘age’ can be tabulated as
follows:
15
Cumulative Frequency
Age Group 1-2 3-4 5-6
Frequency 8 12 6
Cumulative Frequency 8 20 26
Age 1 2 3 4 5 6
Frequency 5 3 7 5 4 2
Cumulative Frequency 5 8 15 20 24 26
Cumulative frequency of data in previous slide
16
Data Presentation
Two types of statistical presentation of data –
Graphical Presentation and Numerical Presentation
Graphical Presentation: We look for the overall pattern and for
striking deviations from that pattern. Over all pattern usually
described by shape, center, and spread of the data.
An individual value that falls outside the overall pattern is called
an Outlier.
Bar diagram and Pie charts - Categorical data.
Two Way Table and Conditional Distribution
Histogram, Stem and Leaf Plot, Box-plot
are used for numerical variable presentation.
17
Data Presentation –Categorical
Variable
Bar Diagram: Lists the categories and presents the percent or count of
individuals who fall in each category.
Eye Color Frequency/
No
of
Obje
cts
Proportion Percent
(%)
1 15 (15/60)=0.25 25.0
2 25 (25/60)=0.333 41.7
3 20 (20/60)=0.417 33.3
Total 60 1.00 100
0
5
10
15
20
25
30
1 2 3
NumberofSubjects
Eye Color
Figure 1:Bar Chart of Subjects in
Treatment Groups
18
Data Presentation –Categorical
Variable
Pie Chart: Lists the categories and presents the percent or count of
individuals who fall in each category.
Figure 2: Pie Chart of
Subjects in Treatment Groups
25%
42%
33% 1
2
3
Color of
Eye
Frequency Proportion Percent
(%)
1 15 (15/60)=0.25 25.0
2 25 (25/60)=0.333 41.7
3 20 (20/60)=0.417 33.3
Total 60 1.00 100
19
Graphical Presentation –Numerical
Variable
Figure 3: Age Distribution
0
2
4
6
8
10
12
14
16
40 60 80 100 120 140 More
Age in Month
NumberofSubjects
Histogram: Overall pattern can be described by its Shape, Center,
and Spread.
The following age distribution is right skewed. The center lies
between 80 to 100. No outliers.
Mean 90.41666667
Standard Error 3.902649518
Median 84
Mode 84
Standard Deviation 30.22979318
Sample Variance 913.8403955
Kurtosis -1.183899591
Skewness 0.389872725
Range 95
Minimum 48
Maximum 143
Sum 5425
Count 60
20
Graphical Presentation –Numerical
Variable
Box-Plot: Describes the Five-Number Summary
0
20
40
60
80
100
120
140
160
1
q1
min
median
max
q3
Figure 3: Distribution of Age
Box Plot
21

More Related Content

What's hot

Introduction to Business Statistics
Introduction to Business StatisticsIntroduction to Business Statistics
Introduction to Business Statistics
SOMASUNDARAM T
 
Statistics
StatisticsStatistics
Statistics
AreehaRana
 
Introduction to Statistics (Part -I)
Introduction to Statistics (Part -I)Introduction to Statistics (Part -I)
Introduction to Statistics (Part -I)
YesAnalytics
 
Sampling , Advantages limitations
Sampling , Advantages limitationsSampling , Advantages limitations
Sampling , Advantages limitations
NamitaPradhan6
 
Math 102- Statistics
Math 102- StatisticsMath 102- Statistics
Math 102- Statistics
Zahra Zulaikha
 
Statistics
StatisticsStatistics
Statisticsitutor
 
Introduction to statistics
Introduction to statisticsIntroduction to statistics
Introduction to statisticsakbhanj
 
Sampling distribution
Sampling distributionSampling distribution
Sampling distribution
Nilanjan Bhaumik
 
Descriptive statistics
Descriptive statisticsDescriptive statistics
Descriptive statisticsAileen Balbido
 
Introduction to Business Statistics
Introduction to Business StatisticsIntroduction to Business Statistics
Introduction to Business StatisticsMegha Mishra
 
Scales of measurement and presentation of data
Scales of measurement and presentation of dataScales of measurement and presentation of data
Scales of measurement and presentation of data
Dr Sithun Kumar Patro
 
Analyzing survey data
Analyzing survey dataAnalyzing survey data
Analyzing survey data
Fatima Sultana
 
Bivariate analysis
Bivariate analysisBivariate analysis
Bivariate analysisariassam
 
Introduction to Descriptive Statistics
Introduction to Descriptive StatisticsIntroduction to Descriptive Statistics
Introduction to Descriptive Statistics
Sanju Rusara Seneviratne
 
Nature, Scope, Functions and Limitations of Statistics
Nature, Scope, Functions and Limitations of StatisticsNature, Scope, Functions and Limitations of Statistics
Nature, Scope, Functions and Limitations of Statistics
Asha Dhilip
 
Sampling distribution
Sampling distributionSampling distribution
Sampling distribution
swarna dey
 
Data
DataData
Chap02 describing data; numerical
Chap02 describing data; numericalChap02 describing data; numerical
Chap02 describing data; numerical
Judianto Nugroho
 
Point Estimation
Point EstimationPoint Estimation
Point Estimation
DataminingTools Inc
 

What's hot (20)

Introduction to Business Statistics
Introduction to Business StatisticsIntroduction to Business Statistics
Introduction to Business Statistics
 
Statistics
StatisticsStatistics
Statistics
 
Introduction to Statistics (Part -I)
Introduction to Statistics (Part -I)Introduction to Statistics (Part -I)
Introduction to Statistics (Part -I)
 
Sampling , Advantages limitations
Sampling , Advantages limitationsSampling , Advantages limitations
Sampling , Advantages limitations
 
Math 102- Statistics
Math 102- StatisticsMath 102- Statistics
Math 102- Statistics
 
Statistics
StatisticsStatistics
Statistics
 
Introduction to statistics
Introduction to statisticsIntroduction to statistics
Introduction to statistics
 
Sampling distribution
Sampling distributionSampling distribution
Sampling distribution
 
Descriptive statistics
Descriptive statisticsDescriptive statistics
Descriptive statistics
 
Introduction to Business Statistics
Introduction to Business StatisticsIntroduction to Business Statistics
Introduction to Business Statistics
 
Scales of measurement and presentation of data
Scales of measurement and presentation of dataScales of measurement and presentation of data
Scales of measurement and presentation of data
 
Data analysis copy
Data analysis   copyData analysis   copy
Data analysis copy
 
Analyzing survey data
Analyzing survey dataAnalyzing survey data
Analyzing survey data
 
Bivariate analysis
Bivariate analysisBivariate analysis
Bivariate analysis
 
Introduction to Descriptive Statistics
Introduction to Descriptive StatisticsIntroduction to Descriptive Statistics
Introduction to Descriptive Statistics
 
Nature, Scope, Functions and Limitations of Statistics
Nature, Scope, Functions and Limitations of StatisticsNature, Scope, Functions and Limitations of Statistics
Nature, Scope, Functions and Limitations of Statistics
 
Sampling distribution
Sampling distributionSampling distribution
Sampling distribution
 
Data
DataData
Data
 
Chap02 describing data; numerical
Chap02 describing data; numericalChap02 describing data; numerical
Chap02 describing data; numerical
 
Point Estimation
Point EstimationPoint Estimation
Point Estimation
 

Similar to Business statistics (Basics)

Student’s presentation
Student’s presentationStudent’s presentation
Student’s presentation
Pwalmiki
 
presentation
presentationpresentation
presentation
Pwalmiki
 
Basics of statistics by Arup Nama Das
Basics of statistics by Arup Nama DasBasics of statistics by Arup Nama Das
Basics of statistics by Arup Nama Das
Arup8
 
Data Presentation and Slide Preparation
Data Presentation and Slide PreparationData Presentation and Slide Preparation
Data Presentation and Slide Preparation
Achu dhan
 
STATISTICAL PROCEDURES (Discriptive Statistics).pptx
STATISTICAL PROCEDURES (Discriptive Statistics).pptxSTATISTICAL PROCEDURES (Discriptive Statistics).pptx
STATISTICAL PROCEDURES (Discriptive Statistics).pptx
MuhammadNafees42
 
General Statistics boa
General Statistics boaGeneral Statistics boa
General Statistics boaraileeanne
 
EDUCATIONAL STATISTICS_Unit_I.ppt
EDUCATIONAL STATISTICS_Unit_I.pptEDUCATIONAL STATISTICS_Unit_I.ppt
EDUCATIONAL STATISTICS_Unit_I.ppt
Sasi Kumar
 
Statistics final seminar
Statistics final seminarStatistics final seminar
Statistics final seminar
Tejas Jagtap
 
Class1.ppt
Class1.pptClass1.ppt
Class1.ppt
Gautam G
 
Class1.ppt
Class1.pptClass1.ppt
Class1.ppt
PerumalPitchandi
 
Class1.ppt
Class1.pptClass1.ppt
Class1.ppt
Sandeepkumar628916
 
Introduction to Statistics - Basics of Data - Class 1
Introduction to Statistics - Basics of Data - Class 1Introduction to Statistics - Basics of Data - Class 1
Introduction to Statistics - Basics of Data - Class 1
RajnishSingh367990
 
Class1.ppt
Class1.pptClass1.ppt
Class1.ppt
hanreaz219
 
STATISTICS BASICS INCLUDING DESCRIPTIVE STATISTICS
STATISTICS BASICS INCLUDING DESCRIPTIVE STATISTICSSTATISTICS BASICS INCLUDING DESCRIPTIVE STATISTICS
STATISTICS BASICS INCLUDING DESCRIPTIVE STATISTICS
nagamani651296
 
Statistics
StatisticsStatistics
Statistics
Deepanshu Sharma
 
Statistics as a discipline
Statistics as a disciplineStatistics as a discipline
Statistics as a discipline
RosalinaTPayumo
 
Statistics
StatisticsStatistics
Statisticspikuoec
 
Standerd Deviation and calculation.pdf
Standerd Deviation and calculation.pdfStanderd Deviation and calculation.pdf
Standerd Deviation and calculation.pdf
NJJAISWALPC
 
presentation of data
presentation of datapresentation of data
presentation of data
Shafeek S
 

Similar to Business statistics (Basics) (20)

Student’s presentation
Student’s presentationStudent’s presentation
Student’s presentation
 
presentation
presentationpresentation
presentation
 
Basics of statistics by Arup Nama Das
Basics of statistics by Arup Nama DasBasics of statistics by Arup Nama Das
Basics of statistics by Arup Nama Das
 
Data Presentation and Slide Preparation
Data Presentation and Slide PreparationData Presentation and Slide Preparation
Data Presentation and Slide Preparation
 
STATISTICAL PROCEDURES (Discriptive Statistics).pptx
STATISTICAL PROCEDURES (Discriptive Statistics).pptxSTATISTICAL PROCEDURES (Discriptive Statistics).pptx
STATISTICAL PROCEDURES (Discriptive Statistics).pptx
 
General Statistics boa
General Statistics boaGeneral Statistics boa
General Statistics boa
 
EDUCATIONAL STATISTICS_Unit_I.ppt
EDUCATIONAL STATISTICS_Unit_I.pptEDUCATIONAL STATISTICS_Unit_I.ppt
EDUCATIONAL STATISTICS_Unit_I.ppt
 
Statistics final seminar
Statistics final seminarStatistics final seminar
Statistics final seminar
 
Class1.ppt
Class1.pptClass1.ppt
Class1.ppt
 
Class1.ppt
Class1.pptClass1.ppt
Class1.ppt
 
Class1.ppt
Class1.pptClass1.ppt
Class1.ppt
 
Introduction to Statistics - Basics of Data - Class 1
Introduction to Statistics - Basics of Data - Class 1Introduction to Statistics - Basics of Data - Class 1
Introduction to Statistics - Basics of Data - Class 1
 
Class1.ppt
Class1.pptClass1.ppt
Class1.ppt
 
STATISTICS BASICS INCLUDING DESCRIPTIVE STATISTICS
STATISTICS BASICS INCLUDING DESCRIPTIVE STATISTICSSTATISTICS BASICS INCLUDING DESCRIPTIVE STATISTICS
STATISTICS BASICS INCLUDING DESCRIPTIVE STATISTICS
 
Statistics
StatisticsStatistics
Statistics
 
Statistics as a discipline
Statistics as a disciplineStatistics as a discipline
Statistics as a discipline
 
Statistics
StatisticsStatistics
Statistics
 
Standerd Deviation and calculation.pdf
Standerd Deviation and calculation.pdfStanderd Deviation and calculation.pdf
Standerd Deviation and calculation.pdf
 
presentation of data
presentation of datapresentation of data
presentation of data
 
Bio stat
Bio statBio stat
Bio stat
 

More from AhmedToheed3

Computer Programming (C++)Pointers and Arrays
Computer Programming (C++)Pointers and ArraysComputer Programming (C++)Pointers and Arrays
Computer Programming (C++)Pointers and Arrays
AhmedToheed3
 
Business statistics (Basic concepts of Index Numbers)
Business statistics (Basic concepts of Index Numbers)Business statistics (Basic concepts of Index Numbers)
Business statistics (Basic concepts of Index Numbers)
AhmedToheed3
 
Business statistics (Shape of data)
Business statistics (Shape of data)Business statistics (Shape of data)
Business statistics (Shape of data)
AhmedToheed3
 
Business statistics ( Methods of variablity measurement))
Business statistics ( Methods of variablity measurement))Business statistics ( Methods of variablity measurement))
Business statistics ( Methods of variablity measurement))
AhmedToheed3
 
Business statistics (Methods of Centre Measurement)
Business statistics (Methods of Centre Measurement)Business statistics (Methods of Centre Measurement)
Business statistics (Methods of Centre Measurement)
AhmedToheed3
 
Business statistics (Introduction)
Business statistics (Introduction)Business statistics (Introduction)
Business statistics (Introduction)
AhmedToheed3
 

More from AhmedToheed3 (6)

Computer Programming (C++)Pointers and Arrays
Computer Programming (C++)Pointers and ArraysComputer Programming (C++)Pointers and Arrays
Computer Programming (C++)Pointers and Arrays
 
Business statistics (Basic concepts of Index Numbers)
Business statistics (Basic concepts of Index Numbers)Business statistics (Basic concepts of Index Numbers)
Business statistics (Basic concepts of Index Numbers)
 
Business statistics (Shape of data)
Business statistics (Shape of data)Business statistics (Shape of data)
Business statistics (Shape of data)
 
Business statistics ( Methods of variablity measurement))
Business statistics ( Methods of variablity measurement))Business statistics ( Methods of variablity measurement))
Business statistics ( Methods of variablity measurement))
 
Business statistics (Methods of Centre Measurement)
Business statistics (Methods of Centre Measurement)Business statistics (Methods of Centre Measurement)
Business statistics (Methods of Centre Measurement)
 
Business statistics (Introduction)
Business statistics (Introduction)Business statistics (Introduction)
Business statistics (Introduction)
 

Recently uploaded

Criminal IP - Threat Hunting Webinar.pdf
Criminal IP - Threat Hunting Webinar.pdfCriminal IP - Threat Hunting Webinar.pdf
Criminal IP - Threat Hunting Webinar.pdf
Criminal IP
 
一比一原版(UofS毕业证书)萨省大学毕业证如何办理
一比一原版(UofS毕业证书)萨省大学毕业证如何办理一比一原版(UofS毕业证书)萨省大学毕业证如何办理
一比一原版(UofS毕业证书)萨省大学毕业证如何办理
v3tuleee
 
FP Growth Algorithm and its Applications
FP Growth Algorithm and its ApplicationsFP Growth Algorithm and its Applications
FP Growth Algorithm and its Applications
MaleehaSheikh2
 
一比一原版(CU毕业证)卡尔顿大学毕业证成绩单
一比一原版(CU毕业证)卡尔顿大学毕业证成绩单一比一原版(CU毕业证)卡尔顿大学毕业证成绩单
一比一原版(CU毕业证)卡尔顿大学毕业证成绩单
yhkoc
 
The affect of service quality and online reviews on customer loyalty in the E...
The affect of service quality and online reviews on customer loyalty in the E...The affect of service quality and online reviews on customer loyalty in the E...
The affect of service quality and online reviews on customer loyalty in the E...
jerlynmaetalle
 
一比一原版(UMich毕业证)密歇根大学|安娜堡分校毕业证成绩单
一比一原版(UMich毕业证)密歇根大学|安娜堡分校毕业证成绩单一比一原版(UMich毕业证)密歇根大学|安娜堡分校毕业证成绩单
一比一原版(UMich毕业证)密歇根大学|安娜堡分校毕业证成绩单
ewymefz
 
一比一原版(ArtEZ毕业证)ArtEZ艺术学院毕业证成绩单
一比一原版(ArtEZ毕业证)ArtEZ艺术学院毕业证成绩单一比一原版(ArtEZ毕业证)ArtEZ艺术学院毕业证成绩单
一比一原版(ArtEZ毕业证)ArtEZ艺术学院毕业证成绩单
vcaxypu
 
做(mqu毕业证书)麦考瑞大学毕业证硕士文凭证书学费发票原版一模一样
做(mqu毕业证书)麦考瑞大学毕业证硕士文凭证书学费发票原版一模一样做(mqu毕业证书)麦考瑞大学毕业证硕士文凭证书学费发票原版一模一样
做(mqu毕业证书)麦考瑞大学毕业证硕士文凭证书学费发票原版一模一样
axoqas
 
一比一原版(Adelaide毕业证书)阿德莱德大学毕业证如何办理
一比一原版(Adelaide毕业证书)阿德莱德大学毕业证如何办理一比一原版(Adelaide毕业证书)阿德莱德大学毕业证如何办理
一比一原版(Adelaide毕业证书)阿德莱德大学毕业证如何办理
slg6lamcq
 
一比一原版(NYU毕业证)纽约大学毕业证成绩单
一比一原版(NYU毕业证)纽约大学毕业证成绩单一比一原版(NYU毕业证)纽约大学毕业证成绩单
一比一原版(NYU毕业证)纽约大学毕业证成绩单
ewymefz
 
哪里卖(usq毕业证书)南昆士兰大学毕业证研究生文凭证书托福证书原版一模一样
哪里卖(usq毕业证书)南昆士兰大学毕业证研究生文凭证书托福证书原版一模一样哪里卖(usq毕业证书)南昆士兰大学毕业证研究生文凭证书托福证书原版一模一样
哪里卖(usq毕业证书)南昆士兰大学毕业证研究生文凭证书托福证书原版一模一样
axoqas
 
Sample_Global Non-invasive Prenatal Testing (NIPT) Market, 2019-2030.pdf
Sample_Global Non-invasive Prenatal Testing (NIPT) Market, 2019-2030.pdfSample_Global Non-invasive Prenatal Testing (NIPT) Market, 2019-2030.pdf
Sample_Global Non-invasive Prenatal Testing (NIPT) Market, 2019-2030.pdf
Linda486226
 
1.Seydhcuxhxyxhccuuxuxyxyxmisolids 2019.pptx
1.Seydhcuxhxyxhccuuxuxyxyxmisolids 2019.pptx1.Seydhcuxhxyxhccuuxuxyxyxmisolids 2019.pptx
1.Seydhcuxhxyxhccuuxuxyxyxmisolids 2019.pptx
Tiktokethiodaily
 
Malana- Gimlet Market Analysis (Portfolio 2)
Malana- Gimlet Market Analysis (Portfolio 2)Malana- Gimlet Market Analysis (Portfolio 2)
Malana- Gimlet Market Analysis (Portfolio 2)
TravisMalana
 
一比一原版(CBU毕业证)卡普顿大学毕业证成绩单
一比一原版(CBU毕业证)卡普顿大学毕业证成绩单一比一原版(CBU毕业证)卡普顿大学毕业证成绩单
一比一原版(CBU毕业证)卡普顿大学毕业证成绩单
nscud
 
一比一原版(UofM毕业证)明尼苏达大学毕业证成绩单
一比一原版(UofM毕业证)明尼苏达大学毕业证成绩单一比一原版(UofM毕业证)明尼苏达大学毕业证成绩单
一比一原版(UofM毕业证)明尼苏达大学毕业证成绩单
ewymefz
 
原版制作(Deakin毕业证书)迪肯大学毕业证学位证一模一样
原版制作(Deakin毕业证书)迪肯大学毕业证学位证一模一样原版制作(Deakin毕业证书)迪肯大学毕业证学位证一模一样
原版制作(Deakin毕业证书)迪肯大学毕业证学位证一模一样
u86oixdj
 
【社内勉強会資料_Octo: An Open-Source Generalist Robot Policy】
【社内勉強会資料_Octo: An Open-Source Generalist Robot Policy】【社内勉強会資料_Octo: An Open-Source Generalist Robot Policy】
【社内勉強会資料_Octo: An Open-Source Generalist Robot Policy】
NABLAS株式会社
 
社内勉強会資料_LLM Agents                              .
社内勉強会資料_LLM Agents                              .社内勉強会資料_LLM Agents                              .
社内勉強会資料_LLM Agents                              .
NABLAS株式会社
 
Ch03-Managing the Object-Oriented Information Systems Project a.pdf
Ch03-Managing the Object-Oriented Information Systems Project a.pdfCh03-Managing the Object-Oriented Information Systems Project a.pdf
Ch03-Managing the Object-Oriented Information Systems Project a.pdf
haila53
 

Recently uploaded (20)

Criminal IP - Threat Hunting Webinar.pdf
Criminal IP - Threat Hunting Webinar.pdfCriminal IP - Threat Hunting Webinar.pdf
Criminal IP - Threat Hunting Webinar.pdf
 
一比一原版(UofS毕业证书)萨省大学毕业证如何办理
一比一原版(UofS毕业证书)萨省大学毕业证如何办理一比一原版(UofS毕业证书)萨省大学毕业证如何办理
一比一原版(UofS毕业证书)萨省大学毕业证如何办理
 
FP Growth Algorithm and its Applications
FP Growth Algorithm and its ApplicationsFP Growth Algorithm and its Applications
FP Growth Algorithm and its Applications
 
一比一原版(CU毕业证)卡尔顿大学毕业证成绩单
一比一原版(CU毕业证)卡尔顿大学毕业证成绩单一比一原版(CU毕业证)卡尔顿大学毕业证成绩单
一比一原版(CU毕业证)卡尔顿大学毕业证成绩单
 
The affect of service quality and online reviews on customer loyalty in the E...
The affect of service quality and online reviews on customer loyalty in the E...The affect of service quality and online reviews on customer loyalty in the E...
The affect of service quality and online reviews on customer loyalty in the E...
 
一比一原版(UMich毕业证)密歇根大学|安娜堡分校毕业证成绩单
一比一原版(UMich毕业证)密歇根大学|安娜堡分校毕业证成绩单一比一原版(UMich毕业证)密歇根大学|安娜堡分校毕业证成绩单
一比一原版(UMich毕业证)密歇根大学|安娜堡分校毕业证成绩单
 
一比一原版(ArtEZ毕业证)ArtEZ艺术学院毕业证成绩单
一比一原版(ArtEZ毕业证)ArtEZ艺术学院毕业证成绩单一比一原版(ArtEZ毕业证)ArtEZ艺术学院毕业证成绩单
一比一原版(ArtEZ毕业证)ArtEZ艺术学院毕业证成绩单
 
做(mqu毕业证书)麦考瑞大学毕业证硕士文凭证书学费发票原版一模一样
做(mqu毕业证书)麦考瑞大学毕业证硕士文凭证书学费发票原版一模一样做(mqu毕业证书)麦考瑞大学毕业证硕士文凭证书学费发票原版一模一样
做(mqu毕业证书)麦考瑞大学毕业证硕士文凭证书学费发票原版一模一样
 
一比一原版(Adelaide毕业证书)阿德莱德大学毕业证如何办理
一比一原版(Adelaide毕业证书)阿德莱德大学毕业证如何办理一比一原版(Adelaide毕业证书)阿德莱德大学毕业证如何办理
一比一原版(Adelaide毕业证书)阿德莱德大学毕业证如何办理
 
一比一原版(NYU毕业证)纽约大学毕业证成绩单
一比一原版(NYU毕业证)纽约大学毕业证成绩单一比一原版(NYU毕业证)纽约大学毕业证成绩单
一比一原版(NYU毕业证)纽约大学毕业证成绩单
 
哪里卖(usq毕业证书)南昆士兰大学毕业证研究生文凭证书托福证书原版一模一样
哪里卖(usq毕业证书)南昆士兰大学毕业证研究生文凭证书托福证书原版一模一样哪里卖(usq毕业证书)南昆士兰大学毕业证研究生文凭证书托福证书原版一模一样
哪里卖(usq毕业证书)南昆士兰大学毕业证研究生文凭证书托福证书原版一模一样
 
Sample_Global Non-invasive Prenatal Testing (NIPT) Market, 2019-2030.pdf
Sample_Global Non-invasive Prenatal Testing (NIPT) Market, 2019-2030.pdfSample_Global Non-invasive Prenatal Testing (NIPT) Market, 2019-2030.pdf
Sample_Global Non-invasive Prenatal Testing (NIPT) Market, 2019-2030.pdf
 
1.Seydhcuxhxyxhccuuxuxyxyxmisolids 2019.pptx
1.Seydhcuxhxyxhccuuxuxyxyxmisolids 2019.pptx1.Seydhcuxhxyxhccuuxuxyxyxmisolids 2019.pptx
1.Seydhcuxhxyxhccuuxuxyxyxmisolids 2019.pptx
 
Malana- Gimlet Market Analysis (Portfolio 2)
Malana- Gimlet Market Analysis (Portfolio 2)Malana- Gimlet Market Analysis (Portfolio 2)
Malana- Gimlet Market Analysis (Portfolio 2)
 
一比一原版(CBU毕业证)卡普顿大学毕业证成绩单
一比一原版(CBU毕业证)卡普顿大学毕业证成绩单一比一原版(CBU毕业证)卡普顿大学毕业证成绩单
一比一原版(CBU毕业证)卡普顿大学毕业证成绩单
 
一比一原版(UofM毕业证)明尼苏达大学毕业证成绩单
一比一原版(UofM毕业证)明尼苏达大学毕业证成绩单一比一原版(UofM毕业证)明尼苏达大学毕业证成绩单
一比一原版(UofM毕业证)明尼苏达大学毕业证成绩单
 
原版制作(Deakin毕业证书)迪肯大学毕业证学位证一模一样
原版制作(Deakin毕业证书)迪肯大学毕业证学位证一模一样原版制作(Deakin毕业证书)迪肯大学毕业证学位证一模一样
原版制作(Deakin毕业证书)迪肯大学毕业证学位证一模一样
 
【社内勉強会資料_Octo: An Open-Source Generalist Robot Policy】
【社内勉強会資料_Octo: An Open-Source Generalist Robot Policy】【社内勉強会資料_Octo: An Open-Source Generalist Robot Policy】
【社内勉強会資料_Octo: An Open-Source Generalist Robot Policy】
 
社内勉強会資料_LLM Agents                              .
社内勉強会資料_LLM Agents                              .社内勉強会資料_LLM Agents                              .
社内勉強会資料_LLM Agents                              .
 
Ch03-Managing the Object-Oriented Information Systems Project a.pdf
Ch03-Managing the Object-Oriented Information Systems Project a.pdfCh03-Managing the Object-Oriented Information Systems Project a.pdf
Ch03-Managing the Object-Oriented Information Systems Project a.pdf
 

Business statistics (Basics)

  • 1. Basics of Statistics Definition: Science of collection, presentation, analysis, and reasonable interpretation of data. Statistics presents a rigorous scientific method for gaining insight into data. For example, suppose we measure the weight of 100 patients in a study. With so many measurements, simply looking at the data fails to provide an informative account. However statistics can give an instant overall picture of data based on graphical presentation or numerical summarization irrespective to the number of data points. Besides data summarization, another important task of statistics is to make inference and predict relations of variables. 1
  • 2. Data  The measurements obtained in a research study are called the data.  The goal of statistics is to help researchers organize and interpret the data. 2
  • 3.  Descriptive statistics are methods for organizing and summarizing data.  For example, tables or graphs are used to organize data, and descriptive values such as the average score are used to summarize data.  A descriptive value for a population is called a parameter and a descriptive value for a sample is called a statistic. Descriptive Statistics 3
  • 5. 5
  • 6. DataAnalysis From Data Analysis to Inference Population Samples Collect data from a representative Sample... Perform Data Analysis, keeping probability in mind… Make an Inference about the Population. 6
  • 7. Inferential statistics are methods for using sample data to make general conclusions (inferences) about populations. Because a sample is typically only a part of the whole population, sample data provide only limited information about the population. As a result, sample statistics are generally imperfect representatives of the corresponding population parameters. 7
  • 8.  The discrepancy between a sample statistic and its population parameter is called sampling error.  Defining and measuring sampling error is a large part of inferential statistics. Sampling Error 8
  • 9. A Taxonomy of Statistics 9
  • 10. Statistical Description of Data: Descriptive Statistics  Statistics describes a numeric set of data by its  Center  Variability  Shape  Statistics describes a categorical set of data by  Frequency, percentage or proportion of each category 10
  • 11. Variable  A variable is a characteristic or condition that can change or take on different values. Or any characteristic of an individual or an entity  Most research begins with a general question about the relationship between two variables for a specific group of individuals. 11
  • 12. Variable -. Variables can be categorical(Discrete) or quantitative(Discrete and continuous) . Categorical Variables • Nominal - Categorical variables with no inherent order or ranking sequence such as names or classes (e.g., gender, blood group). Value may be a numerical, but without numerical value (e.g., I, II, III). The only operation that can be applied to Nominal variables is enumeration (counts). • Ordinal - Variables with an inherent rank or order, e.g. mild, moderate, severe. Can be compared for equality, or greater or less, but not how much greater or less. mild, moderate or severe illness). Often ordinal variables are re- coded to be quantitative. 12
  • 13. Interval - Values of the variable are ordered as in Ordinal, and additionally, differences between values are meaningful, however, the scale is not absolutely anchored. Calendar dates and temperatures on the Fahrenheit scale are examples Addition and subtraction, but not multiplication and division are meaningful operations. Ratio - Variables with all properties of Interval plus an absolute, non-arbitrary zero point, e.g. age, weight, temperature (Kelvin). Addition, subtraction, multiplication, and division are all meaningful operations. Variables (Contd) 13
  • 14. Distribution Distribution - (of a variable) tells us what values the variable takes and how often it takes these values. • Unimodal - having a single peak • Bimodal - having two distinct peaks • Symmetric - left and right half are mirror images. 14
  • 15. Frequency Distribution Age 1 2 3 4 5 6 Frequency 5 3 7 5 4 2 Frequency Distribution of Age Grouped Frequency Distribution of Age: Age Group 1-2 3-4 5-6 Frequency 8 12 6 Consider a data set of 26 children of ages 1-6 years. Then the frequency distribution of variable ‘age’ can be tabulated as follows: 15
  • 16. Cumulative Frequency Age Group 1-2 3-4 5-6 Frequency 8 12 6 Cumulative Frequency 8 20 26 Age 1 2 3 4 5 6 Frequency 5 3 7 5 4 2 Cumulative Frequency 5 8 15 20 24 26 Cumulative frequency of data in previous slide 16
  • 17. Data Presentation Two types of statistical presentation of data – Graphical Presentation and Numerical Presentation Graphical Presentation: We look for the overall pattern and for striking deviations from that pattern. Over all pattern usually described by shape, center, and spread of the data. An individual value that falls outside the overall pattern is called an Outlier. Bar diagram and Pie charts - Categorical data. Two Way Table and Conditional Distribution Histogram, Stem and Leaf Plot, Box-plot are used for numerical variable presentation. 17
  • 18. Data Presentation –Categorical Variable Bar Diagram: Lists the categories and presents the percent or count of individuals who fall in each category. Eye Color Frequency/ No of Obje cts Proportion Percent (%) 1 15 (15/60)=0.25 25.0 2 25 (25/60)=0.333 41.7 3 20 (20/60)=0.417 33.3 Total 60 1.00 100 0 5 10 15 20 25 30 1 2 3 NumberofSubjects Eye Color Figure 1:Bar Chart of Subjects in Treatment Groups 18
  • 19. Data Presentation –Categorical Variable Pie Chart: Lists the categories and presents the percent or count of individuals who fall in each category. Figure 2: Pie Chart of Subjects in Treatment Groups 25% 42% 33% 1 2 3 Color of Eye Frequency Proportion Percent (%) 1 15 (15/60)=0.25 25.0 2 25 (25/60)=0.333 41.7 3 20 (20/60)=0.417 33.3 Total 60 1.00 100 19
  • 20. Graphical Presentation –Numerical Variable Figure 3: Age Distribution 0 2 4 6 8 10 12 14 16 40 60 80 100 120 140 More Age in Month NumberofSubjects Histogram: Overall pattern can be described by its Shape, Center, and Spread. The following age distribution is right skewed. The center lies between 80 to 100. No outliers. Mean 90.41666667 Standard Error 3.902649518 Median 84 Mode 84 Standard Deviation 30.22979318 Sample Variance 913.8403955 Kurtosis -1.183899591 Skewness 0.389872725 Range 95 Minimum 48 Maximum 143 Sum 5425 Count 60 20
  • 21. Graphical Presentation –Numerical Variable Box-Plot: Describes the Five-Number Summary 0 20 40 60 80 100 120 140 160 1 q1 min median max q3 Figure 3: Distribution of Age Box Plot 21