Downloaded 15 times


![• Statistical test that measures the association
between two categorical variables.
• Most commonly applied in questionnaire data
from a survey
– Response is yes, no [nominal or ordinal]
• If the observed χ2test statistic is greater than the
critical value from table null hypothesis is
rejected
– χ2 > critical value at given df and level of significance;
H0 rejected](https://image.slidesharecdn.com/chisquaredtest-190714143440/85/Chi-squared-test-2-320.jpg)
![Degree of Freedom [df]
• df = [C-1][R-1]
– C= number of columns
– R= number of Rows](https://image.slidesharecdn.com/chisquaredtest-190714143440/85/Chi-squared-test-9-320.jpg)
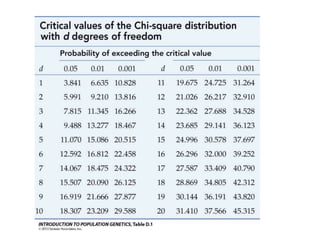
![• Chi square statistic > critical value
But in our observation,
• Chi square statistic (2) < critical value (3.841)
– pN6f]kf] cfof]!
• Null Hypothesis is NOT Rejected.
– Meaning ?](https://image.slidesharecdn.com/chisquaredtest-190714143440/85/Chi-squared-test-11-320.jpg)
![Key Assumptions in χ2
• For 2X2 table [only 2 categories in each variable]
– χ2 test can be used when total sample size is > 40
– if the total sample size is 20-40, and smallest
expected frequency is at least 5 χ2 test can be used
– Otherwise Fisher’s exact test should be used [SPSS
will automatically give this]
• For all other table:
– χ2 can be used if no more than 20% of the expected
frequencies are less than 5 and none is less than 1](https://image.slidesharecdn.com/chisquaredtest-190714143440/85/Chi-squared-test-15-320.jpg)


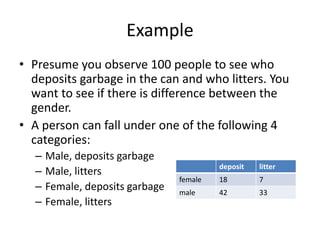
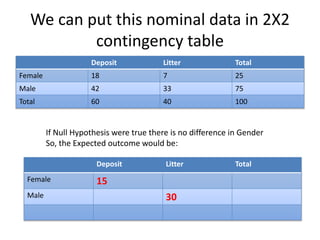
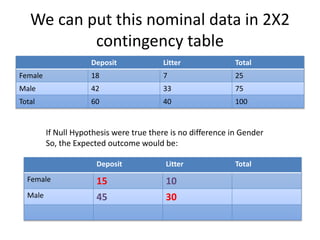
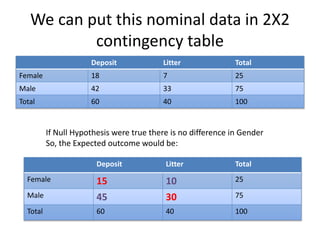
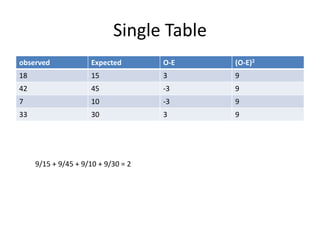
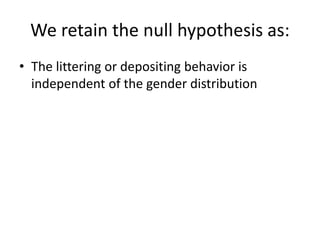
This document provides an overview of the chi-square test, including how to calculate it and interpret the results. It gives an example of using a chi-square test to analyze data from an observational study of 100 people to see if littering behavior differs by gender. A 2x2 contingency table is constructed, expected values are calculated under the null hypothesis of no association, and the chi-square statistic is found to be less than the critical value, so the null hypothesis is not rejected - the data do not provide evidence that gender is associated with littering behavior.