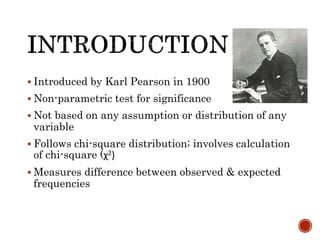
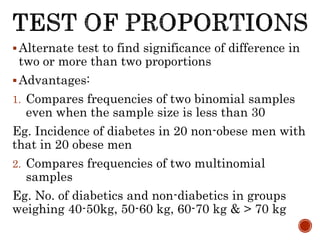
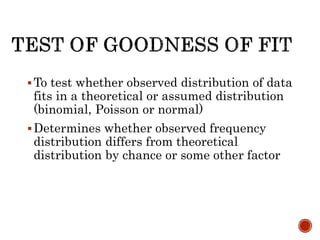
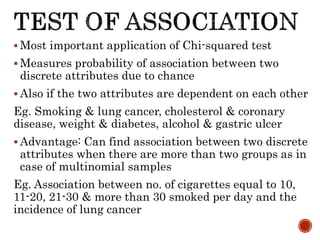
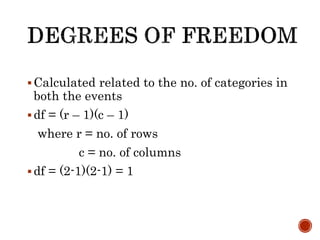
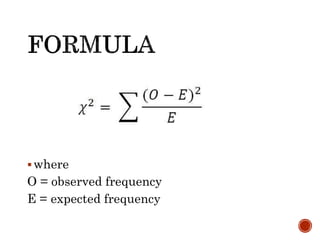
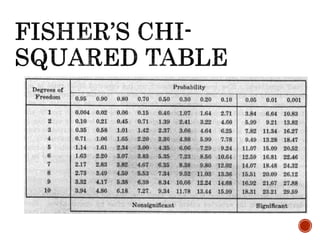
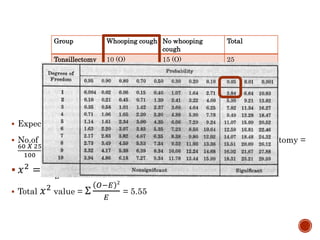
DR. MRUNAL DHOLE
 Introduced by Karl Pearson in 1900
 Non-parametric test for significance
 Not based on any assumption or distribution of any
variable
 Follows chi-square distribution; involves calculation
of chi-square (χ2)
 Measures difference between observed & expected
frequencies
1. Test of Proportion
2. Test of Goodness of Fit
3. Test of Association
Alternate test to find significance of difference in
two or more than two proportions
Advantages:
1. Compares frequencies of two binomial samples
even when the sample size is less than 30
Eg. Incidence of diabetes in 20 non-obese men with
that in 20 obese men
2. Compares frequencies of two multinomial
samples
Eg. No. of diabetics and non-diabetics in groups
weighing 40-50kg, 50-60 kg, 60-70 kg & > 70 kg
To test whether observed distribution of data
fits in a theoretical or assumed distribution
(binomial, Poisson or normal)
Determines whether observed frequency
distribution differs from theoretical
distribution by chance or some other factor
 Most important application of Chi-squared test
 Measures probability of association between two
discrete attributes due to chance
 Also if the two attributes are dependent on each other
Eg. Smoking & lung cancer, cholesterol & coronary
disease, weight & diabetes, alcohol & gastric ulcer
 Advantage: Can find association between two discrete
attributes when there are more than two groups as in
case of multinomial samples
Eg. Association between no. of cigarettes equal to 10,
11-20, 21-30 & more than 30 smoked per day and the
incidence of lung cancer
1. A random sample
2. Qualitative data; in frequencies such as
number of responses in two or more
categories; not percentage or fraction or
mean
3. Lowest expected frequency not < 5
Determine if there is any association between
whooping cough and tonsillectomy when in a
random sample of 100 children of a school, 25
had history of tonsillectomy and 60 of
whooping cough and 10 had both while 25
had none.
 Data is entered into a table → presents joint occurrence of
two sets of events → Contingency table
 Con – together; tangere – touch
 Association Table
 Fourfold Table
RESULT
Group Whooping cough No whooping cough Total
Tonsillectomy 10 15 25
No tonsillectomy 50 25 75
Total 60 40 100
Calculated related to the no. of categories in
both the events
df = (r – 1)(c – 1)
where r = no. of rows
c = no. of columns
df = (2-1)(2-1) = 1
where
O = observed frequency
E = expected frequency
 Calculated χ2 value > Tabulated χ2 value at a
certain level of significance & degrees of
freedom → null hypothesis rejected
 Null hypothesis → Hypothesis of no difference
between two proportions; independence of two
characters; no difference between observed &
theoretical frequency
 Expected value (E) =
𝑪𝒐𝒍𝒖𝒎𝒏 𝒐𝒓 𝒗𝒆𝒓𝒕𝒊𝒄𝒂𝒍 𝒕𝒐𝒕𝒂𝒍 𝑿 𝑹𝒐𝒘 𝒐𝒓 𝒉𝒐𝒓𝒊𝒛𝒐𝒏𝒕𝒂𝒍 𝒕𝒐𝒕𝒂𝒍
𝑺𝒂𝒎𝒑𝒍𝒆 𝒕𝒐𝒕𝒂𝒍
 No.of students expected with history of whooping cough & tonsillectomy =
60 𝑋 25
100
=
1500
100
= 15
 𝑥2
=
𝑂−𝐸 2
𝐸
=
10−15
2
15
=
25
15
= 1.67
 Total 𝑥2
value = Σ
𝑂−𝐸 2
𝐸
= 5.55
Group Whooping cough No whooping
cough
Total
Tonsillectomy 10 (O)
15 (E)
15 (O)
10 (E)
25
No
tonsillectomy
50 (O)
45 (E)
25 (O)
30 (E)
75
Total 60 40 100
Expected value < 5 in any cell in a four-fold
table → No reliable result
Yates correction; cannot be
applied to tables larger than 2*2
Does not measure strength of association
between two events, only its presence or
absence
Does not indicate the cause & effect; only
probability (p) of occurrence of association by
chance
Dakhale GN, Hiware SK , Shinde AT,
Mahatme MS. Basic biostatistics for post
graduate students. Indian J Pharmacol.
2012; 44(4):435-42.
Mahajan BK. The Chi-Square Test. In:
Khanal AB, editor. Mahajan’s Method in
Biostatistics for Medical Students and
Research workers. 8
th
ed. Jaypee Brothers
Medical Publishers (P) Ltd; 2016.

Chi square test

  • 1.
  • 2.
     Introduced byKarl Pearson in 1900  Non-parametric test for significance  Not based on any assumption or distribution of any variable  Follows chi-square distribution; involves calculation of chi-square (χ2)  Measures difference between observed & expected frequencies
  • 3.
    1. Test ofProportion 2. Test of Goodness of Fit 3. Test of Association
  • 4.
    Alternate test tofind significance of difference in two or more than two proportions Advantages: 1. Compares frequencies of two binomial samples even when the sample size is less than 30 Eg. Incidence of diabetes in 20 non-obese men with that in 20 obese men 2. Compares frequencies of two multinomial samples Eg. No. of diabetics and non-diabetics in groups weighing 40-50kg, 50-60 kg, 60-70 kg & > 70 kg
  • 5.
    To test whetherobserved distribution of data fits in a theoretical or assumed distribution (binomial, Poisson or normal) Determines whether observed frequency distribution differs from theoretical distribution by chance or some other factor
  • 6.
     Most importantapplication of Chi-squared test  Measures probability of association between two discrete attributes due to chance  Also if the two attributes are dependent on each other Eg. Smoking & lung cancer, cholesterol & coronary disease, weight & diabetes, alcohol & gastric ulcer  Advantage: Can find association between two discrete attributes when there are more than two groups as in case of multinomial samples Eg. Association between no. of cigarettes equal to 10, 11-20, 21-30 & more than 30 smoked per day and the incidence of lung cancer
  • 7.
    1. A randomsample 2. Qualitative data; in frequencies such as number of responses in two or more categories; not percentage or fraction or mean 3. Lowest expected frequency not < 5
  • 8.
    Determine if thereis any association between whooping cough and tonsillectomy when in a random sample of 100 children of a school, 25 had history of tonsillectomy and 60 of whooping cough and 10 had both while 25 had none.
  • 9.
     Data isentered into a table → presents joint occurrence of two sets of events → Contingency table  Con – together; tangere – touch  Association Table  Fourfold Table RESULT Group Whooping cough No whooping cough Total Tonsillectomy 10 15 25 No tonsillectomy 50 25 75 Total 60 40 100
  • 10.
    Calculated related tothe no. of categories in both the events df = (r – 1)(c – 1) where r = no. of rows c = no. of columns df = (2-1)(2-1) = 1
  • 11.
    where O = observedfrequency E = expected frequency
  • 12.
     Calculated χ2value > Tabulated χ2 value at a certain level of significance & degrees of freedom → null hypothesis rejected  Null hypothesis → Hypothesis of no difference between two proportions; independence of two characters; no difference between observed & theoretical frequency
  • 13.
     Expected value(E) = 𝑪𝒐𝒍𝒖𝒎𝒏 𝒐𝒓 𝒗𝒆𝒓𝒕𝒊𝒄𝒂𝒍 𝒕𝒐𝒕𝒂𝒍 𝑿 𝑹𝒐𝒘 𝒐𝒓 𝒉𝒐𝒓𝒊𝒛𝒐𝒏𝒕𝒂𝒍 𝒕𝒐𝒕𝒂𝒍 𝑺𝒂𝒎𝒑𝒍𝒆 𝒕𝒐𝒕𝒂𝒍  No.of students expected with history of whooping cough & tonsillectomy = 60 𝑋 25 100 = 1500 100 = 15  𝑥2 = 𝑂−𝐸 2 𝐸 = 10−15 2 15 = 25 15 = 1.67  Total 𝑥2 value = Σ 𝑂−𝐸 2 𝐸 = 5.55 Group Whooping cough No whooping cough Total Tonsillectomy 10 (O) 15 (E) 15 (O) 10 (E) 25 No tonsillectomy 50 (O) 45 (E) 25 (O) 30 (E) 75 Total 60 40 100
  • 14.
    Expected value <5 in any cell in a four-fold table → No reliable result Yates correction; cannot be applied to tables larger than 2*2 Does not measure strength of association between two events, only its presence or absence Does not indicate the cause & effect; only probability (p) of occurrence of association by chance
  • 16.
    Dakhale GN, HiwareSK , Shinde AT, Mahatme MS. Basic biostatistics for post graduate students. Indian J Pharmacol. 2012; 44(4):435-42. Mahajan BK. The Chi-Square Test. In: Khanal AB, editor. Mahajan’s Method in Biostatistics for Medical Students and Research workers. 8 th ed. Jaypee Brothers Medical Publishers (P) Ltd; 2016.

Editor's Notes

  • #10 Association table: want to know association between two sets of events Fourfold: Only two samples; divided into two classes
  • #12 Χ is a greek letter
  • #13 Provides highest values of χ2 attainable by chance at different df under different p P = probability of occurrence by chance
  • #18 Yates correction – reduction of O - E to half