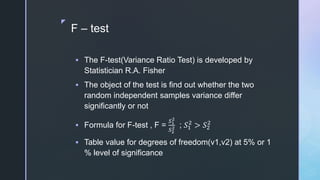
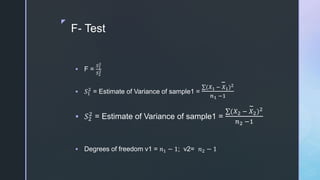
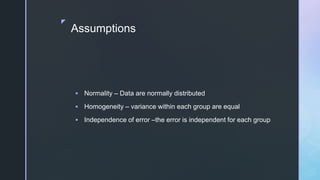
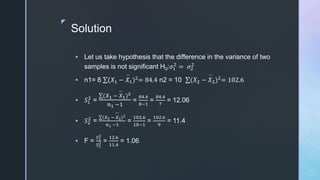
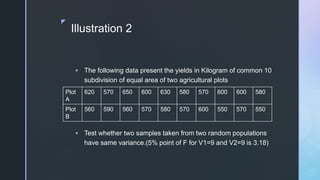
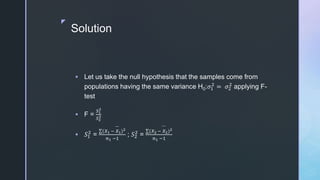
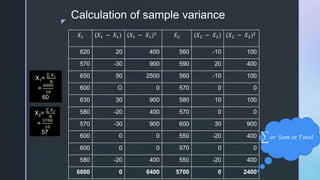
SlideShare a Scribd company logo
z
F - test
Dr. R. MUTHUKRISHNAVENI
SAIVA BHANU KSHATRIYA COLLEGE,
ARUPPUKOTTAI
z
F – test
 The F-test(Variance Ratio Test) is developed by
Statistician R.A. Fisher
 The object of the test is find out whether the two
random independent samples variance differ
significantly or not
 Formula for F-test , F =
𝑆1
2
𝑆2
2 ; 𝑆1
2
> 𝑆2
2
 Table value for degrees of freedom(v1,v2) at 5% or 1
% level of significance
z
F- Test
 F =
𝑆1
2
𝑆2
2
 𝑆1
2
= Estimate of Variance of sample1 =
(𝑋1 − 𝑋1)2
𝑛1 −1
 𝑆2
2
= Estimate of Variance of sample1 =
(𝑋2 − 𝑋2)2
𝑛2 −1
 Degrees of freedom v1 = 𝑛1 − 1; v2= 𝑛2 − 1
z
Assumptions
 Normality – Data are normally distributed
 Homogeneity – variance within each group are equal
 Independence of error –the error is independent for each group
z
Illustration - 1
 In a sample of 8 observations, the sum of squared deviations of
items from the mean was 84.4. In another samples of 10
observations, the value was found to be 102.6. Test whether the
difference is significant at 5% level.
V1 = 7 & V2 = 9 degrees of
freedom at 5% level of
significance F0.05 = 3.29
z
Solution
 Let us take hypothesis that the difference in the variance of two
samples is not significant H0:𝜎1
2
= 𝜎2
2
 n1= 8 (𝑋1 − 𝑋1)2
= 84.4 n2 = 10 (𝑋2 − 𝑋2)2
= 102.6
 𝑆1
2
=
(𝑋1 − 𝑋1)2
𝑛1 −1
=
84.4
8−1
=
84.4
7
= 12.06
 𝑆2
2
=
(𝑋2 − 𝑋2)2
𝑛1 −1
=
102.6
10−1
=
102.6
9
= 11.4
 F =
𝑆1
2
𝑆2
2 =
12.6
11.4
= 1.06
z
Solution - continue
 Calculated value of F = 1.06
 Table value of F = 3.29 (v1 = 7
and v2 = 9 at 5% level of
significance)
 Inference
 CV < TV, hence we accept the
null hypothesis and conclude
that the difference in the
variance of two samples is not
significant at 5%
z
Illustration 2
 The following data present the yields in Kilogram of common 10
subdivision of equal area of two agricultural plots
 Test whether two samples taken from two random populations
have same variance.(5% point of F for V1=9 and V2=9 is 3.18)
Plot
A
620 570 650 600 630 580 570 600 600 580
Plot
B
560 590 560 570 580 570 600 550 570 550
z
Solution
 Let us take the null hypothesis that the samples come from
populations having the same variance H0:𝜎1
2
= 𝜎2
2
applying F-
test
 F =
𝑆1
2
𝑆2
2
 𝑆1
2
=
(𝑋1 − 𝑋1)2
𝑛1 −1
; 𝑆2
2
=
(𝑋2 − 𝑋2)2
𝑛1 −1
z
Calculation of sample variance
𝑋1 (𝑋1 − 𝑋1) (𝑋1 − 𝑋1)2 𝑋2 (𝑋2 − 𝑋2) (𝑋2 − 𝑋2)2
620 20 400 560 -10 100
570 -30 900 590 20 400
650 50 2500 560 -10 100
600 O 0 570 0 0
630 30 900 580 10 100
580 -20 400 570 0 0
570 -30 900 600 30 900
600 0 0 550 -20 400
600 0 0 570 0 0
580 -20 400 550 -20 400
6000 0 6400 5700 0 2400
X1=
𝑋1
𝑁
=
6000
10
60
X2=
𝑋2
𝑁
=
5700
10
57
𝑜𝑟 𝑆𝑢𝑚 𝑜𝑟 𝑇𝑜𝑡𝑎𝑙
z
Solution - Continue
 𝑆1
2
=
(𝑋1 − 𝑋1)2
𝑛1 −1
=
6400
10−1
= 711.11
 𝑆2
2
=
(𝑋2 − 𝑋2)2
𝑛1 −1
=
2400
10 −1
= 266.67
 F =
𝑆1
2
𝑆2
2 =
711.11
266.27
= 2.67
z
Solution - continue
 Calculated value of F = 2. 67
 Table value of F = 3.18 (v1 = 9
and v2 = 9 at 5% level of
significance)
 Inference
 CV < TV, hence we accept the
null hypothesis and conclude
that the samples come from
populations having the same
variance at 5%

More Related Content

Similar to f-test-200513110014 (1).pdf

regression analysis .ppt
regression analysis .pptregression analysis .ppt
regression analysis .pptTapanKumarDash3
 
13. single factor ANOVA crop.pptx
13. single factor ANOVA crop.pptx13. single factor ANOVA crop.pptx
13. single factor ANOVA crop.pptxdawitg2
 
BIOSTATISTICS ANOVA .BEST WAYS TO SOLVE ONE WAY AND TWO WAY ANOVA.SHORTCUT ME...
BIOSTATISTICS ANOVA .BEST WAYS TO SOLVE ONE WAY AND TWO WAY ANOVA.SHORTCUT ME...BIOSTATISTICS ANOVA .BEST WAYS TO SOLVE ONE WAY AND TWO WAY ANOVA.SHORTCUT ME...
BIOSTATISTICS ANOVA .BEST WAYS TO SOLVE ONE WAY AND TWO WAY ANOVA.SHORTCUT ME...Payaamvohra1
 
Test of hypothesis test of significance
Test of hypothesis test of significanceTest of hypothesis test of significance
Test of hypothesis test of significanceDr. Jayesh Vyas
 
F Distribution
F DistributionF Distribution
F Distributionjravish
 
F Distribution
F  DistributionF  Distribution
F Distributionjravish
 
Analysis of variance (ANOVA)
Analysis of variance (ANOVA)Analysis of variance (ANOVA)
Analysis of variance (ANOVA)Sneh Kumari
 
t-z-chi-square tests of sig.pdf
t-z-chi-square tests of sig.pdft-z-chi-square tests of sig.pdf
t-z-chi-square tests of sig.pdfAmoghLavania1
 
Analysis of variance
Analysis of varianceAnalysis of variance
Analysis of varianceAya Christeen
 
Descriptive Statistics Formula Sheet Sample Populatio.docx
Descriptive Statistics Formula Sheet    Sample Populatio.docxDescriptive Statistics Formula Sheet    Sample Populatio.docx
Descriptive Statistics Formula Sheet Sample Populatio.docxsimonithomas47935
 
Genetics Homework Problem 1 You are mapping genes in a species of f.pdf
Genetics Homework Problem 1 You are mapping genes in a species of f.pdfGenetics Homework Problem 1 You are mapping genes in a species of f.pdf
Genetics Homework Problem 1 You are mapping genes in a species of f.pdfarpaqindia
 
ANOVA TEST by shafeek
ANOVA TEST by shafeekANOVA TEST by shafeek
ANOVA TEST by shafeekShafeek S
 
Lesson06_new
Lesson06_newLesson06_new
Lesson06_newshengvn
 
Function of a random variable lect5a.ppt
Function of a random variable lect5a.pptFunction of a random variable lect5a.ppt
Function of a random variable lect5a.pptsadafshahbaz7777
 

Similar to f-test-200513110014 (1).pdf (19)

regression analysis .ppt
regression analysis .pptregression analysis .ppt
regression analysis .ppt
 
13. single factor ANOVA crop.pptx
13. single factor ANOVA crop.pptx13. single factor ANOVA crop.pptx
13. single factor ANOVA crop.pptx
 
Chapter_5.pdf
Chapter_5.pdfChapter_5.pdf
Chapter_5.pdf
 
BIOSTATISTICS ANOVA .BEST WAYS TO SOLVE ONE WAY AND TWO WAY ANOVA.SHORTCUT ME...
BIOSTATISTICS ANOVA .BEST WAYS TO SOLVE ONE WAY AND TWO WAY ANOVA.SHORTCUT ME...BIOSTATISTICS ANOVA .BEST WAYS TO SOLVE ONE WAY AND TWO WAY ANOVA.SHORTCUT ME...
BIOSTATISTICS ANOVA .BEST WAYS TO SOLVE ONE WAY AND TWO WAY ANOVA.SHORTCUT ME...
 
Statistical analysis by iswar
Statistical analysis by iswarStatistical analysis by iswar
Statistical analysis by iswar
 
Test of hypothesis test of significance
Test of hypothesis test of significanceTest of hypothesis test of significance
Test of hypothesis test of significance
 
F Distribution
F DistributionF Distribution
F Distribution
 
F Distribution
F  DistributionF  Distribution
F Distribution
 
Anova statistics
Anova statisticsAnova statistics
Anova statistics
 
Analysis of variance (ANOVA)
Analysis of variance (ANOVA)Analysis of variance (ANOVA)
Analysis of variance (ANOVA)
 
K.A.Sindhura-t,z,f tests
K.A.Sindhura-t,z,f testsK.A.Sindhura-t,z,f tests
K.A.Sindhura-t,z,f tests
 
t-z-chi-square tests of sig.pdf
t-z-chi-square tests of sig.pdft-z-chi-square tests of sig.pdf
t-z-chi-square tests of sig.pdf
 
f and t test
f and t testf and t test
f and t test
 
Analysis of variance
Analysis of varianceAnalysis of variance
Analysis of variance
 
Descriptive Statistics Formula Sheet Sample Populatio.docx
Descriptive Statistics Formula Sheet    Sample Populatio.docxDescriptive Statistics Formula Sheet    Sample Populatio.docx
Descriptive Statistics Formula Sheet Sample Populatio.docx
 
Genetics Homework Problem 1 You are mapping genes in a species of f.pdf
Genetics Homework Problem 1 You are mapping genes in a species of f.pdfGenetics Homework Problem 1 You are mapping genes in a species of f.pdf
Genetics Homework Problem 1 You are mapping genes in a species of f.pdf
 
ANOVA TEST by shafeek
ANOVA TEST by shafeekANOVA TEST by shafeek
ANOVA TEST by shafeek
 
Lesson06_new
Lesson06_newLesson06_new
Lesson06_new
 
Function of a random variable lect5a.ppt
Function of a random variable lect5a.pptFunction of a random variable lect5a.ppt
Function of a random variable lect5a.ppt
 

More from UMAIRASHFAQ20

jhghgjhgjhgjhfhcgjfjhvjhjgjkggjhgjhgjhfjgjgfgfhgfhg
jhghgjhgjhgjhfhcgjfjhvjhjgjkggjhgjhgjhfjgjgfgfhgfhgjhghgjhgjhgjhfhcgjfjhvjhjgjkggjhgjhgjhfjgjgfgfhgfhg
jhghgjhgjhgjhfhcgjfjhvjhjgjkggjhgjhgjhfjgjgfgfhgfhgUMAIRASHFAQ20
 
CHEMISTRY OF F-BLOCK ELEMENTS BY K.N.S.SWAMI..pdf473.pdf.pdf
CHEMISTRY OF F-BLOCK ELEMENTS BY K.N.S.SWAMI..pdf473.pdf.pdfCHEMISTRY OF F-BLOCK ELEMENTS BY K.N.S.SWAMI..pdf473.pdf.pdf
CHEMISTRY OF F-BLOCK ELEMENTS BY K.N.S.SWAMI..pdf473.pdf.pdfUMAIRASHFAQ20
 
bentrule-200416181539.pdf
bentrule-200416181539.pdfbentrule-200416181539.pdf
bentrule-200416181539.pdfUMAIRASHFAQ20
 
3center4electronsbond-150331130400-conversion-gate01.pdf
3center4electronsbond-150331130400-conversion-gate01.pdf3center4electronsbond-150331130400-conversion-gate01.pdf
3center4electronsbond-150331130400-conversion-gate01.pdfUMAIRASHFAQ20
 
columnchromatography-131008023940-phpapp02.pdf
columnchromatography-131008023940-phpapp02.pdfcolumnchromatography-131008023940-phpapp02.pdf
columnchromatography-131008023940-phpapp02.pdfUMAIRASHFAQ20
 
physics114_lecture11.ppt
physics114_lecture11.pptphysics114_lecture11.ppt
physics114_lecture11.pptUMAIRASHFAQ20
 
physics114_lecture11 (1).ppt
physics114_lecture11 (1).pptphysics114_lecture11 (1).ppt
physics114_lecture11 (1).pptUMAIRASHFAQ20
 
M.Sc. Part I QUALITY IN ANALYTICAL CHEMISTRY PPT.ppsx
M.Sc. Part I QUALITY IN ANALYTICAL CHEMISTRY PPT.ppsxM.Sc. Part I QUALITY IN ANALYTICAL CHEMISTRY PPT.ppsx
M.Sc. Part I QUALITY IN ANALYTICAL CHEMISTRY PPT.ppsxUMAIRASHFAQ20
 
1133611095_375749.pptx
1133611095_375749.pptx1133611095_375749.pptx
1133611095_375749.pptxUMAIRASHFAQ20
 
2_2019_03_04!02_26_12_PM.ppt
2_2019_03_04!02_26_12_PM.ppt2_2019_03_04!02_26_12_PM.ppt
2_2019_03_04!02_26_12_PM.pptUMAIRASHFAQ20
 

More from UMAIRASHFAQ20 (20)

jhghgjhgjhgjhfhcgjfjhvjhjgjkggjhgjhgjhfjgjgfgfhgfhg
jhghgjhgjhgjhfhcgjfjhvjhjgjkggjhgjhgjhfjgjgfgfhgfhgjhghgjhgjhgjhfhcgjfjhvjhjgjkggjhgjhgjhfjgjgfgfhgfhg
jhghgjhgjhgjhfhcgjfjhvjhjgjkggjhgjhgjhfjgjgfgfhgfhg
 
9618821.ppt
9618821.ppt9618821.ppt
9618821.ppt
 
CHEMISTRY OF F-BLOCK ELEMENTS BY K.N.S.SWAMI..pdf473.pdf.pdf
CHEMISTRY OF F-BLOCK ELEMENTS BY K.N.S.SWAMI..pdf473.pdf.pdfCHEMISTRY OF F-BLOCK ELEMENTS BY K.N.S.SWAMI..pdf473.pdf.pdf
CHEMISTRY OF F-BLOCK ELEMENTS BY K.N.S.SWAMI..pdf473.pdf.pdf
 
bentrule-200416181539.pdf
bentrule-200416181539.pdfbentrule-200416181539.pdf
bentrule-200416181539.pdf
 
9-LFER.pdf
9-LFER.pdf9-LFER.pdf
9-LFER.pdf
 
9-LFER(U).pptx.pdf
9-LFER(U).pptx.pdf9-LFER(U).pptx.pdf
9-LFER(U).pptx.pdf
 
h-bonding.pdf
h-bonding.pdfh-bonding.pdf
h-bonding.pdf
 
11553.pdf
11553.pdf11553.pdf
11553.pdf
 
3center4electronsbond-150331130400-conversion-gate01.pdf
3center4electronsbond-150331130400-conversion-gate01.pdf3center4electronsbond-150331130400-conversion-gate01.pdf
3center4electronsbond-150331130400-conversion-gate01.pdf
 
SMT1105-1.pdf
SMT1105-1.pdfSMT1105-1.pdf
SMT1105-1.pdf
 
columnchromatography-131008023940-phpapp02.pdf
columnchromatography-131008023940-phpapp02.pdfcolumnchromatography-131008023940-phpapp02.pdf
columnchromatography-131008023940-phpapp02.pdf
 
ttest_intro.pdf
ttest_intro.pdfttest_intro.pdf
ttest_intro.pdf
 
BSC 821 Ch 1.pdf
BSC 821 Ch 1.pdfBSC 821 Ch 1.pdf
BSC 821 Ch 1.pdf
 
9618821.pdf
9618821.pdf9618821.pdf
9618821.pdf
 
physics114_lecture11.ppt
physics114_lecture11.pptphysics114_lecture11.ppt
physics114_lecture11.ppt
 
9773985.pdf
9773985.pdf9773985.pdf
9773985.pdf
 
physics114_lecture11 (1).ppt
physics114_lecture11 (1).pptphysics114_lecture11 (1).ppt
physics114_lecture11 (1).ppt
 
M.Sc. Part I QUALITY IN ANALYTICAL CHEMISTRY PPT.ppsx
M.Sc. Part I QUALITY IN ANALYTICAL CHEMISTRY PPT.ppsxM.Sc. Part I QUALITY IN ANALYTICAL CHEMISTRY PPT.ppsx
M.Sc. Part I QUALITY IN ANALYTICAL CHEMISTRY PPT.ppsx
 
1133611095_375749.pptx
1133611095_375749.pptx1133611095_375749.pptx
1133611095_375749.pptx
 
2_2019_03_04!02_26_12_PM.ppt
2_2019_03_04!02_26_12_PM.ppt2_2019_03_04!02_26_12_PM.ppt
2_2019_03_04!02_26_12_PM.ppt
 

Recently uploaded

Pre-ProductionImproveddsfjgndflghtgg.pptx
Pre-ProductionImproveddsfjgndflghtgg.pptxPre-ProductionImproveddsfjgndflghtgg.pptx
Pre-ProductionImproveddsfjgndflghtgg.pptxStephen266013
 
Innovative Methods in Media and Communication Research by Sebastian Kubitschk...
Innovative Methods in Media and Communication Research by Sebastian Kubitschk...Innovative Methods in Media and Communication Research by Sebastian Kubitschk...
Innovative Methods in Media and Communication Research by Sebastian Kubitschk...correoyaya
 
社内勉強会資料_LLM Agents                              .
社内勉強会資料_LLM Agents                              .社内勉強会資料_LLM Agents                              .
社内勉強会資料_LLM Agents                              .NABLAS株式会社
 
Opendatabay - Open Data Marketplace.pptx
Opendatabay - Open Data Marketplace.pptxOpendatabay - Open Data Marketplace.pptx
Opendatabay - Open Data Marketplace.pptxOpendatabay
 
Using PDB Relocation to Move a Single PDB to Another Existing CDB
Using PDB Relocation to Move a Single PDB to Another Existing CDBUsing PDB Relocation to Move a Single PDB to Another Existing CDB
Using PDB Relocation to Move a Single PDB to Another Existing CDBAlireza Kamrani
 
一比一原版(QU毕业证)皇后大学毕业证成绩单
一比一原版(QU毕业证)皇后大学毕业证成绩单一比一原版(QU毕业证)皇后大学毕业证成绩单
一比一原版(QU毕业证)皇后大学毕业证成绩单enxupq
 
Webinar One View, Multiple Systems No-Code Integration of Salesforce and ERPs
Webinar One View, Multiple Systems No-Code Integration of Salesforce and ERPsWebinar One View, Multiple Systems No-Code Integration of Salesforce and ERPs
Webinar One View, Multiple Systems No-Code Integration of Salesforce and ERPsCEPTES Software Inc
 
Tabula.io Cheatsheet: automate your data workflows
Tabula.io Cheatsheet: automate your data workflowsTabula.io Cheatsheet: automate your data workflows
Tabula.io Cheatsheet: automate your data workflowsalex933524
 
Jpolillo Amazon PPC - Bid Optimization Sample
Jpolillo Amazon PPC - Bid Optimization SampleJpolillo Amazon PPC - Bid Optimization Sample
Jpolillo Amazon PPC - Bid Optimization SampleJames Polillo
 
Business update Q1 2024 Lar España Real Estate SOCIMI
Business update Q1 2024 Lar España Real Estate SOCIMIBusiness update Q1 2024 Lar España Real Estate SOCIMI
Business update Q1 2024 Lar España Real Estate SOCIMIAlejandraGmez176757
 
Exploratory Data Analysis - Dilip S.pptx
Exploratory Data Analysis - Dilip S.pptxExploratory Data Analysis - Dilip S.pptx
Exploratory Data Analysis - Dilip S.pptxDilipVasan
 
2024-05-14 - Tableau User Group - TC24 Hot Topics - Tableau Pulse and Einstei...
2024-05-14 - Tableau User Group - TC24 Hot Topics - Tableau Pulse and Einstei...2024-05-14 - Tableau User Group - TC24 Hot Topics - Tableau Pulse and Einstei...
2024-05-14 - Tableau User Group - TC24 Hot Topics - Tableau Pulse and Einstei...elinavihriala
 
Computer Presentation.pptx ecommerce advantage s
Computer Presentation.pptx ecommerce advantage sComputer Presentation.pptx ecommerce advantage s
Computer Presentation.pptx ecommerce advantage sMAQIB18
 
Supply chain analytics to combat the effects of Ukraine-Russia-conflict
Supply chain analytics to combat the effects of Ukraine-Russia-conflictSupply chain analytics to combat the effects of Ukraine-Russia-conflict
Supply chain analytics to combat the effects of Ukraine-Russia-conflictJack Cole
 
Investigate & Recover / StarCompliance.io / Crypto_Crimes
Investigate & Recover / StarCompliance.io / Crypto_CrimesInvestigate & Recover / StarCompliance.io / Crypto_Crimes
Investigate & Recover / StarCompliance.io / Crypto_CrimesStarCompliance.io
 
一比一原版(IIT毕业证)伊利诺伊理工大学毕业证成绩单
一比一原版(IIT毕业证)伊利诺伊理工大学毕业证成绩单一比一原版(IIT毕业证)伊利诺伊理工大学毕业证成绩单
一比一原版(IIT毕业证)伊利诺伊理工大学毕业证成绩单ewymefz
 
Q1’2024 Update: MYCI’s Leap Year Rebound
Q1’2024 Update: MYCI’s Leap Year ReboundQ1’2024 Update: MYCI’s Leap Year Rebound
Q1’2024 Update: MYCI’s Leap Year ReboundOppotus
 
一比一原版(UPenn毕业证)宾夕法尼亚大学毕业证成绩单
一比一原版(UPenn毕业证)宾夕法尼亚大学毕业证成绩单一比一原版(UPenn毕业证)宾夕法尼亚大学毕业证成绩单
一比一原版(UPenn毕业证)宾夕法尼亚大学毕业证成绩单ewymefz
 
How can I successfully sell my pi coins in Philippines?
How can I successfully sell my pi coins in Philippines?How can I successfully sell my pi coins in Philippines?
How can I successfully sell my pi coins in Philippines?DOT TECH
 

Recently uploaded (20)

Pre-ProductionImproveddsfjgndflghtgg.pptx
Pre-ProductionImproveddsfjgndflghtgg.pptxPre-ProductionImproveddsfjgndflghtgg.pptx
Pre-ProductionImproveddsfjgndflghtgg.pptx
 
Innovative Methods in Media and Communication Research by Sebastian Kubitschk...
Innovative Methods in Media and Communication Research by Sebastian Kubitschk...Innovative Methods in Media and Communication Research by Sebastian Kubitschk...
Innovative Methods in Media and Communication Research by Sebastian Kubitschk...
 
社内勉強会資料_LLM Agents                              .
社内勉強会資料_LLM Agents                              .社内勉強会資料_LLM Agents                              .
社内勉強会資料_LLM Agents                              .
 
Opendatabay - Open Data Marketplace.pptx
Opendatabay - Open Data Marketplace.pptxOpendatabay - Open Data Marketplace.pptx
Opendatabay - Open Data Marketplace.pptx
 
Using PDB Relocation to Move a Single PDB to Another Existing CDB
Using PDB Relocation to Move a Single PDB to Another Existing CDBUsing PDB Relocation to Move a Single PDB to Another Existing CDB
Using PDB Relocation to Move a Single PDB to Another Existing CDB
 
一比一原版(QU毕业证)皇后大学毕业证成绩单
一比一原版(QU毕业证)皇后大学毕业证成绩单一比一原版(QU毕业证)皇后大学毕业证成绩单
一比一原版(QU毕业证)皇后大学毕业证成绩单
 
Webinar One View, Multiple Systems No-Code Integration of Salesforce and ERPs
Webinar One View, Multiple Systems No-Code Integration of Salesforce and ERPsWebinar One View, Multiple Systems No-Code Integration of Salesforce and ERPs
Webinar One View, Multiple Systems No-Code Integration of Salesforce and ERPs
 
Tabula.io Cheatsheet: automate your data workflows
Tabula.io Cheatsheet: automate your data workflowsTabula.io Cheatsheet: automate your data workflows
Tabula.io Cheatsheet: automate your data workflows
 
Jpolillo Amazon PPC - Bid Optimization Sample
Jpolillo Amazon PPC - Bid Optimization SampleJpolillo Amazon PPC - Bid Optimization Sample
Jpolillo Amazon PPC - Bid Optimization Sample
 
Slip-and-fall Injuries: Top Workers' Comp Claims
Slip-and-fall Injuries: Top Workers' Comp ClaimsSlip-and-fall Injuries: Top Workers' Comp Claims
Slip-and-fall Injuries: Top Workers' Comp Claims
 
Business update Q1 2024 Lar España Real Estate SOCIMI
Business update Q1 2024 Lar España Real Estate SOCIMIBusiness update Q1 2024 Lar España Real Estate SOCIMI
Business update Q1 2024 Lar España Real Estate SOCIMI
 
Exploratory Data Analysis - Dilip S.pptx
Exploratory Data Analysis - Dilip S.pptxExploratory Data Analysis - Dilip S.pptx
Exploratory Data Analysis - Dilip S.pptx
 
2024-05-14 - Tableau User Group - TC24 Hot Topics - Tableau Pulse and Einstei...
2024-05-14 - Tableau User Group - TC24 Hot Topics - Tableau Pulse and Einstei...2024-05-14 - Tableau User Group - TC24 Hot Topics - Tableau Pulse and Einstei...
2024-05-14 - Tableau User Group - TC24 Hot Topics - Tableau Pulse and Einstei...
 
Computer Presentation.pptx ecommerce advantage s
Computer Presentation.pptx ecommerce advantage sComputer Presentation.pptx ecommerce advantage s
Computer Presentation.pptx ecommerce advantage s
 
Supply chain analytics to combat the effects of Ukraine-Russia-conflict
Supply chain analytics to combat the effects of Ukraine-Russia-conflictSupply chain analytics to combat the effects of Ukraine-Russia-conflict
Supply chain analytics to combat the effects of Ukraine-Russia-conflict
 
Investigate & Recover / StarCompliance.io / Crypto_Crimes
Investigate & Recover / StarCompliance.io / Crypto_CrimesInvestigate & Recover / StarCompliance.io / Crypto_Crimes
Investigate & Recover / StarCompliance.io / Crypto_Crimes
 
一比一原版(IIT毕业证)伊利诺伊理工大学毕业证成绩单
一比一原版(IIT毕业证)伊利诺伊理工大学毕业证成绩单一比一原版(IIT毕业证)伊利诺伊理工大学毕业证成绩单
一比一原版(IIT毕业证)伊利诺伊理工大学毕业证成绩单
 
Q1’2024 Update: MYCI’s Leap Year Rebound
Q1’2024 Update: MYCI’s Leap Year ReboundQ1’2024 Update: MYCI’s Leap Year Rebound
Q1’2024 Update: MYCI’s Leap Year Rebound
 
一比一原版(UPenn毕业证)宾夕法尼亚大学毕业证成绩单
一比一原版(UPenn毕业证)宾夕法尼亚大学毕业证成绩单一比一原版(UPenn毕业证)宾夕法尼亚大学毕业证成绩单
一比一原版(UPenn毕业证)宾夕法尼亚大学毕业证成绩单
 
How can I successfully sell my pi coins in Philippines?
How can I successfully sell my pi coins in Philippines?How can I successfully sell my pi coins in Philippines?
How can I successfully sell my pi coins in Philippines?
 

f-test-200513110014 (1).pdf

  • 1. z F - test Dr. R. MUTHUKRISHNAVENI SAIVA BHANU KSHATRIYA COLLEGE, ARUPPUKOTTAI
  • 2. z F – test  The F-test(Variance Ratio Test) is developed by Statistician R.A. Fisher  The object of the test is find out whether the two random independent samples variance differ significantly or not  Formula for F-test , F = 𝑆1 2 𝑆2 2 ; 𝑆1 2 > 𝑆2 2  Table value for degrees of freedom(v1,v2) at 5% or 1 % level of significance
  • 3. z F- Test  F = 𝑆1 2 𝑆2 2  𝑆1 2 = Estimate of Variance of sample1 = (𝑋1 − 𝑋1)2 𝑛1 −1  𝑆2 2 = Estimate of Variance of sample1 = (𝑋2 − 𝑋2)2 𝑛2 −1  Degrees of freedom v1 = 𝑛1 − 1; v2= 𝑛2 − 1
  • 4. z Assumptions  Normality – Data are normally distributed  Homogeneity – variance within each group are equal  Independence of error –the error is independent for each group
  • 5. z Illustration - 1  In a sample of 8 observations, the sum of squared deviations of items from the mean was 84.4. In another samples of 10 observations, the value was found to be 102.6. Test whether the difference is significant at 5% level. V1 = 7 & V2 = 9 degrees of freedom at 5% level of significance F0.05 = 3.29
  • 6. z Solution  Let us take hypothesis that the difference in the variance of two samples is not significant H0:𝜎1 2 = 𝜎2 2  n1= 8 (𝑋1 − 𝑋1)2 = 84.4 n2 = 10 (𝑋2 − 𝑋2)2 = 102.6  𝑆1 2 = (𝑋1 − 𝑋1)2 𝑛1 −1 = 84.4 8−1 = 84.4 7 = 12.06  𝑆2 2 = (𝑋2 − 𝑋2)2 𝑛1 −1 = 102.6 10−1 = 102.6 9 = 11.4  F = 𝑆1 2 𝑆2 2 = 12.6 11.4 = 1.06
  • 7. z Solution - continue  Calculated value of F = 1.06  Table value of F = 3.29 (v1 = 7 and v2 = 9 at 5% level of significance)  Inference  CV < TV, hence we accept the null hypothesis and conclude that the difference in the variance of two samples is not significant at 5%
  • 8. z Illustration 2  The following data present the yields in Kilogram of common 10 subdivision of equal area of two agricultural plots  Test whether two samples taken from two random populations have same variance.(5% point of F for V1=9 and V2=9 is 3.18) Plot A 620 570 650 600 630 580 570 600 600 580 Plot B 560 590 560 570 580 570 600 550 570 550
  • 9. z Solution  Let us take the null hypothesis that the samples come from populations having the same variance H0:𝜎1 2 = 𝜎2 2 applying F- test  F = 𝑆1 2 𝑆2 2  𝑆1 2 = (𝑋1 − 𝑋1)2 𝑛1 −1 ; 𝑆2 2 = (𝑋2 − 𝑋2)2 𝑛1 −1
  • 10. z Calculation of sample variance 𝑋1 (𝑋1 − 𝑋1) (𝑋1 − 𝑋1)2 𝑋2 (𝑋2 − 𝑋2) (𝑋2 − 𝑋2)2 620 20 400 560 -10 100 570 -30 900 590 20 400 650 50 2500 560 -10 100 600 O 0 570 0 0 630 30 900 580 10 100 580 -20 400 570 0 0 570 -30 900 600 30 900 600 0 0 550 -20 400 600 0 0 570 0 0 580 -20 400 550 -20 400 6000 0 6400 5700 0 2400 X1= 𝑋1 𝑁 = 6000 10 60 X2= 𝑋2 𝑁 = 5700 10 57 𝑜𝑟 𝑆𝑢𝑚 𝑜𝑟 𝑇𝑜𝑡𝑎𝑙
  • 11. z Solution - Continue  𝑆1 2 = (𝑋1 − 𝑋1)2 𝑛1 −1 = 6400 10−1 = 711.11  𝑆2 2 = (𝑋2 − 𝑋2)2 𝑛1 −1 = 2400 10 −1 = 266.67  F = 𝑆1 2 𝑆2 2 = 711.11 266.27 = 2.67
  • 12. z Solution - continue  Calculated value of F = 2. 67  Table value of F = 3.18 (v1 = 9 and v2 = 9 at 5% level of significance)  Inference  CV < TV, hence we accept the null hypothesis and conclude that the samples come from populations having the same variance at 5%