Download to read offline


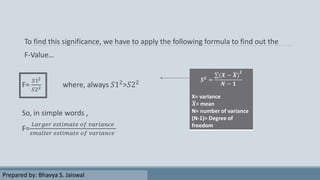
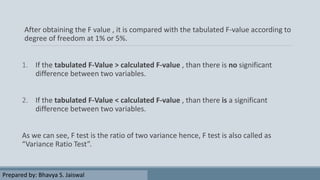


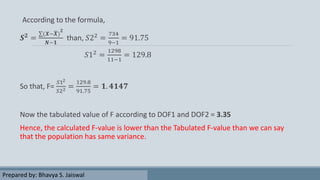
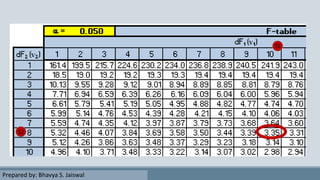


The document discusses the F-test, which is used to determine if the variances of two populations are significantly different. It explains that the F-test involves calculating the F-value, which is the ratio of the larger sample variance to the smaller sample variance. This F-value is then compared to a critical value from the F-distribution table based on the degrees of freedom. If the F-value is less than the critical value, there is no significant difference between the population variances. The document provides an example calculation to demonstrate how to perform an F-test on two samples and determine if their variances are significantly different or not.


