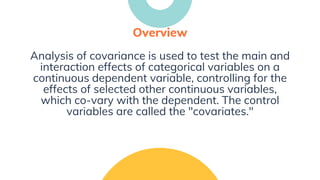
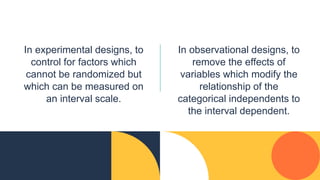
ANCOVA (Analysis of Covariance) is a statistical method used to test the effects of categorical variables on a continuous dependent variable while controlling for continuous covariate variables. It extends ANOVA and regression by allowing comparison of regression lines or means between groups. ANCOVA makes several key assumptions, including that covariates are measured without error, have a linear relationship with the dependent variable, and do not influence the independent variables. It is used in experimental and observational research designs to reduce effects of non-randomized or confounding variables.
This slide is about Analysis of Covariance. Analysis of covariance provides a way of statistically controlling the (linear) effect of variables one does not want to examine in a study.
ANCOVA is the statistical technique that combines regression and ANOVA.
This slide is about Analysis of Covariance. Analysis of covariance provides a way of statistically controlling the (linear) effect of variables one does not want to examine in a study.
ANCOVA is the statistical technique that combines regression and ANOVA.
Explaining correlation, assumptions,coefficients of correlation, coefficient of determination, variate, partial correlation, assumption, order and hypothesis of partial correlation with example, checking significance and graphical representation of partial correlation.
Today’s overwhelming number of techniques applicable to data analysis makes it extremely difficult to define the most beneficial approach while considering all the significant variables.
The analysis of variance has been studied from several approaches, the most common of which uses a linear model that relates the response to the treatments and blocks. Note that the model is linear in parameters but may be nonlinear across factor levels. Interpretation is easy when data is balanced across factors but much deeper understanding is needed for unbalanced data.
Analysis of variance (ANOVA) is a collection of statistical models and their associated estimation procedures (such as the "variation" among and between groups) used to analyze the differences among means. ANOVA was developed by the statistician Ronald Fisher. ANOVA is based on the law of total variance, where the observed variance in a particular variable is partitioned into components attributable to different sources of variation. In its simplest form, ANOVA provides a statistical test of whether two or more population means are equal, and therefore generalizes the t-test beyond two means. In other words, the ANOVA is used to test the difference between two or more means.Analysis of variance (ANOVA) is an analysis tool used in statistics that splits an observed aggregate variability found inside a data set into two parts: systematic factors and random factors. The systematic factors have a statistical influence on the given data set, while the random factors do not. Analysts use the ANOVA test to determine the influence that independent variables have on the dependent variable in a regression study.
Sir Ronald Fisher pioneered the development of ANOVA for analyzing results of agricultural experiments.1 Today, ANOVA is included in almost every statistical package, which makes it accessible to investigators in all experimental sciences. It is easy to input a data set and run a simple ANOVA, but it is challenging to choose the appropriate ANOVA for different experimental designs, to examine whether data adhere to the modeling assumptions, and to interpret the results correctly. The purpose of this report, together with the next 2 articles in the Statistical Primer for Cardiovascular Research series, is to enhance understanding of ANVOA and to promote its successful use in experimental cardiovascular research. My colleagues and I attempt to accomplish those goals through examples and explanation, while keeping within reason the burden of notation, technical jargon, and mathematical equations.
Experimental design is inferential procedure or scientific method in Statistics wherein cause and effect relationship is studied by planning an experiment. In Experimental Design methodology, proper experiments are planned in order to achieve desired objective. Copy the link given below and paste it in new browser window to get more information on Experimental Design:- www.transtutors.com/homework-help/statistics/experimental-design.aspx
A brief description of F Test and ANOVA for Msc Life Science students. I have taken the example slides from youtube where an excellent explanation is available.
Here is the link : https://www.youtube.com/watch?v=-yQb_ZJnFXw
a full lecture presentation on ANOVA .
areas covered include;
a. definition and purpose of anova
b. one-way anova
c. factorial anova
d. mutiple anova
e MANOVA
f. POST-HOC TESTS - types
f. easy step by step process of calculating post hoc test.
The ppt gives an idea about basic concept of Estimation. point and interval. Properties of good estimate is also covered. Confidence interval for single means, difference between two means, proportion and difference of two proportion for different sample sizes are included along with case studies.
Analysis of variance (ANOVA) everything you need to knowStat Analytica
Most of the students may struggle with the analysis of variance (ANOVA). Here in this presentation you can clear all your doubts in analysis of variance with suitable examples.
Multiple Linear Regression II and ANOVA IJames Neill
Explains advanced use of multiple linear regression, including residuals, interactions and analysis of change, then introduces the principles of ANOVA starting with explanation of t-tests.
Discriminant analysis is a technique that is used by the researcher to analyze the research data when the criterion or the dependent variable is categorical and the predictor or the independent variable is the interval in nature. The term categorical variable means that the predictor variable is divided into a number of categories.
DA is typically used when the groups are already defined prior to the study.
The end result of DA is a model that can be used for the prediction of group memberships. This model allows us to understand the relationship between the set of selected variables and the observations. Furthermore, this model will enable one to assess the contributions of different variables.
Honest Reviews of Tim Han LMA Course Program.pptxtimhan337
Personal development courses are widely available today, with each one promising life-changing outcomes. Tim Han’s Life Mastery Achievers (LMA) Course has drawn a lot of interest. In addition to offering my frank assessment of Success Insider’s LMA Course, this piece examines the course’s effects via a variety of Tim Han LMA course reviews and Success Insider comments.
Read| The latest issue of The Challenger is here! We are thrilled to announce that our school paper has qualified for the NATIONAL SCHOOLS PRESS CONFERENCE (NSPC) 2024. Thank you for your unwavering support and trust. Dive into the stories that made us stand out!
Biological screening of herbal drugs: Introduction and Need for
Phyto-Pharmacological Screening, New Strategies for evaluating
Natural Products, In vitro evaluation techniques for Antioxidants, Antimicrobial and Anticancer drugs. In vivo evaluation techniques
for Anti-inflammatory, Antiulcer, Anticancer, Wound healing, Antidiabetic, Hepatoprotective, Cardio protective, Diuretics and
Antifertility, Toxicity studies as per OECD guidelines
A Strategic Approach: GenAI in EducationPeter Windle
Artificial Intelligence (AI) technologies such as Generative AI, Image Generators and Large Language Models have had a dramatic impact on teaching, learning and assessment over the past 18 months. The most immediate threat AI posed was to Academic Integrity with Higher Education Institutes (HEIs) focusing their efforts on combating the use of GenAI in assessment. Guidelines were developed for staff and students, policies put in place too. Innovative educators have forged paths in the use of Generative AI for teaching, learning and assessments leading to pockets of transformation springing up across HEIs, often with little or no top-down guidance, support or direction.
This Gasta posits a strategic approach to integrating AI into HEIs to prepare staff, students and the curriculum for an evolving world and workplace. We will highlight the advantages of working with these technologies beyond the realm of teaching, learning and assessment by considering prompt engineering skills, industry impact, curriculum changes, and the need for staff upskilling. In contrast, not engaging strategically with Generative AI poses risks, including falling behind peers, missed opportunities and failing to ensure our graduates remain employable. The rapid evolution of AI technologies necessitates a proactive and strategic approach if we are to remain relevant.
Francesca Gottschalk - How can education support child empowerment.pptxEduSkills OECD
Francesca Gottschalk from the OECD’s Centre for Educational Research and Innovation presents at the Ask an Expert Webinar: How can education support child empowerment?
2024.06.01 Introducing a competency framework for languag learning materials ...Sandy Millin
http://sandymillin.wordpress.com/iateflwebinar2024
Published classroom materials form the basis of syllabuses, drive teacher professional development, and have a potentially huge influence on learners, teachers and education systems. All teachers also create their own materials, whether a few sentences on a blackboard, a highly-structured fully-realised online course, or anything in between. Despite this, the knowledge and skills needed to create effective language learning materials are rarely part of teacher training, and are mostly learnt by trial and error.
Knowledge and skills frameworks, generally called competency frameworks, for ELT teachers, trainers and managers have existed for a few years now. However, until I created one for my MA dissertation, there wasn’t one drawing together what we need to know and do to be able to effectively produce language learning materials.
This webinar will introduce you to my framework, highlighting the key competencies I identified from my research. It will also show how anybody involved in language teaching (any language, not just English!), teacher training, managing schools or developing language learning materials can benefit from using the framework.
The French Revolution, which began in 1789, was a period of radical social and political upheaval in France. It marked the decline of absolute monarchies, the rise of secular and democratic republics, and the eventual rise of Napoleon Bonaparte. This revolutionary period is crucial in understanding the transition from feudalism to modernity in Europe.
For more information, visit-www.vavaclasses.com
Macroeconomics- Movie Location
This will be used as part of your Personal Professional Portfolio once graded.
Objective:
Prepare a presentation or a paper using research, basic comparative analysis, data organization and application of economic information. You will make an informed assessment of an economic climate outside of the United States to accomplish an entertainment industry objective.
Welcome to TechSoup New Member Orientation and Q&A (May 2024).pdfTechSoup
In this webinar you will learn how your organization can access TechSoup's wide variety of product discount and donation programs. From hardware to software, we'll give you a tour of the tools available to help your nonprofit with productivity, collaboration, financial management, donor tracking, security, and more.
Introduction to AI for Nonprofits with Tapp NetworkTechSoup
Dive into the world of AI! Experts Jon Hill and Tareq Monaur will guide you through AI's role in enhancing nonprofit websites and basic marketing strategies, making it easy to understand and apply.
June 3, 2024 Anti-Semitism Letter Sent to MIT President Kornbluth and MIT Cor...Levi Shapiro
Letter from the Congress of the United States regarding Anti-Semitism sent June 3rd to MIT President Sally Kornbluth, MIT Corp Chair, Mark Gorenberg
Dear Dr. Kornbluth and Mr. Gorenberg,
The US House of Representatives is deeply concerned by ongoing and pervasive acts of antisemitic
harassment and intimidation at the Massachusetts Institute of Technology (MIT). Failing to act decisively to ensure a safe learning environment for all students would be a grave dereliction of your responsibilities as President of MIT and Chair of the MIT Corporation.
This Congress will not stand idly by and allow an environment hostile to Jewish students to persist. The House believes that your institution is in violation of Title VI of the Civil Rights Act, and the inability or
unwillingness to rectify this violation through action requires accountability.
Postsecondary education is a unique opportunity for students to learn and have their ideas and beliefs challenged. However, universities receiving hundreds of millions of federal funds annually have denied
students that opportunity and have been hijacked to become venues for the promotion of terrorism, antisemitic harassment and intimidation, unlawful encampments, and in some cases, assaults and riots.
The House of Representatives will not countenance the use of federal funds to indoctrinate students into hateful, antisemitic, anti-American supporters of terrorism. Investigations into campus antisemitism by the Committee on Education and the Workforce and the Committee on Ways and Means have been expanded into a Congress-wide probe across all relevant jurisdictions to address this national crisis. The undersigned Committees will conduct oversight into the use of federal funds at MIT and its learning environment under authorities granted to each Committee.
• The Committee on Education and the Workforce has been investigating your institution since December 7, 2023. The Committee has broad jurisdiction over postsecondary education, including its compliance with Title VI of the Civil Rights Act, campus safety concerns over disruptions to the learning environment, and the awarding of federal student aid under the Higher Education Act.
• The Committee on Oversight and Accountability is investigating the sources of funding and other support flowing to groups espousing pro-Hamas propaganda and engaged in antisemitic harassment and intimidation of students. The Committee on Oversight and Accountability is the principal oversight committee of the US House of Representatives and has broad authority to investigate “any matter” at “any time” under House Rule X.
• The Committee on Ways and Means has been investigating several universities since November 15, 2023, when the Committee held a hearing entitled From Ivory Towers to Dark Corners: Investigating the Nexus Between Antisemitism, Tax-Exempt Universities, and Terror Financing. The Committee followed the hearing with letters to those institutions on January 10, 202
3. Analysis of covariance is used to test the main and
interaction effects of categorical variables on a
continuous dependent variable, controlling for the
effects of selected other continuous variables,
which co-vary with the dependent. The control
variables are called the "covariates."
Overview
5. In experimental designs, to
control for factors which
cannot be randomized but
which can be measured on
an interval scale.
In observational designs, to
remove the effects of
variables which modify the
relationship of the
categorical independents to
the interval dependent.
6. In regression models, to fit
regressions where there are
both categorical and interval
independents. (This third
purpose has become displaced
by logistic regression and other
methods.
7. ANCOVA is a blend of analysis of
variance (ANOVA) and regression. It is
similar to factorial ANOVA, in that it
can tell you what additional
information you can get by
considering one independent variable
(factor) at a time, without the influence
of the others. It can be used as:
8. ·An extension of multiple
regression to compare
multiple regression lines,
·An extension of analysis of
variance.
9. Although ANCOVA is usually used when there are
differences between your baseline groups (Senn,
1994; Overall, 1993), it can also be used in
pretest/posttest analysis when regression to the
mean affects your posttest measurement (Bonate,
2000). The technique is also common in non-
experimental research (e.g. surveys) and for quasi-
experiments (when study participants can’t be
assigned randomly). However, this particular
application of ANCOVA is not always
recommended (Vogt, 1999).
10. Key Concepts and
Terms
Covariate
An interval-level (i.e.
continuous) independent
variable. If there are no
covariates, ANOVA must be
used instead of ANCOVA, and
if there are covariates,
ANCOVA is used instead of
ANOVA. Covariates are
commonly used as control
variables.
For instance, use of a baseline
pre-test score can be used as a
covariate to control for initial
group differences on math
ability or whatever is being
assessed in the ANCOVA
study.
That is, in ANCOVA we look at
the effects of the categorical
independents on an interval
dependent (i.e. response)
variable, after effects of interval
covariates are controlled. (This
is similar to regression, where
the beta weights of categorical
independents represented as
dummy variables entered after
interval independents reflect
the control effect of these
independents).
11. Key Concepts and
Terms
F-test
The F-test of significance is
used to test each main and
interaction effect, for the case
of a single interval dependent
and multiple (>2) groups
formed by a categorical
independent. F is between-
groups variance divided by
within-groups variance. If the
computed p-value is small, then
significant relationships exist.
Adjusted means are usually
part of ANCOVA output and
are examined if the F-test
demonstrates significant
relationships exist. Comparison
of the original and adjusted
group means can provide
insight into the role of the
covariates. For k groups formed
by categories of the categorical
independents and measured on
the dependent variable, the
adjustment shows how these k
means were altered to control
for the covariates.
12. Key Concepts and
Terms
t-test
: A test of significance of the
difference in the means of a
single interval dependent, for
the case of two groups formed
by a categorical independent.
13. Can ANCOVA be
modeled using
regression?
Yes, if dummy variables are used for the categorical
independents. When creating dummy variables, one must use one
less category than there are values of each independent. For full
ANCOVA one would also add the interaction cross-product terms
for each pair of independents included in the
equation, including the dummies. Then one computes multiple
regression. The resulting F tests will be the same as in classical
ANCOVA. F ratio can also be computed through the extra sum of
squares using Full-Reduced Model approach.
14. Assumptions
(At least one categorical and at
least one interval independent) The
independent variable(s) may be
categorical, except at least one must
be a covariate (interval level).
Likewise, at least one independent
must be categorical.
16. Assumptions
(Low measurement error of the
covariate) The covariate variables
are continuous and interval level,
and are assumed to be measured
without error.
17. (Covariate linearly or in known
relationship to the dependent) The
form of the relationship between the
covariate and the dependent must
be known and most computer
programs assume this relationship is
linear, adjusting the dependent mean
based on linear regression.
Scatterplots of the covariate and the
dependent for each of the k groups
formed by the independents is one
way to assess violations of this
assumption.
Assumptions
18. (Homogeneity of covariate regression
coefficients; i.e. “parallel lines model”)
The covariate coefficients (the slopes of
the regression lines) are the same for
each group formed by the categorical
variables and measured on the
dependent. The more this assumption is
violated, the more conservative
ANCOVA becomes (the more likely it is
to make Type I errors - accepting a false
null hypothesis). There is a statistical
test of the assumption of homogeneity
of regression coefficients.
Assumptions
19. (Additivity) The values of the dependent
are an additive combination of its overall
mean, the effect of the categorical
independents, the covariate effect, and an
error term. ANCOVA is robust against
violations of additivity but in severe
violations the researcher may transform the
data, as by using a logarithmic
transformation to change a multiplicative
model into an additive model. Note,
however, that ANCOVA automatically
handles interaction effects and thus is not
an additive procedure in the sense of
regression models without interaction terms.
Assumptions
20. (Independence of the error term) The
error term is independent of the
covariates and the categorical
independents. Randomization in
experimental designs assures this
assumption will be met.
Assumptions
21. (Independent variables orthogonal to
covariates) The independents are
orthogonal. If the covariate is influenced
by the categorical independents, then
the control adjustment ANCOVA makes
on the dependent variable prior to
assessing the effects of the categorical
independents will be biased since some
indirect effects of the independents will
be removed from the dependent.
Assumptions
22. (Homogeneity of variances) There is
homogeneity of variances in the cells
formed by the independent categorical
variable Heteroscedasticity is lack of
homogeneity of variances, in violation of
this assumption.
Assumptions
23. (Multivariate normality) For purposes
of significance testing, variables follow
multivariate normal distributions.
Assumptions
24. (Compound sphericity) The groups
display sphericity (the variance of the
difference between the estimated
means for any two different groups is
the same) A more restrictive
assumption, called compound
symmetry, is that the correlations
between any two different groups are
the same value. If compound symmetry
exists, sphericity exists. Tests or
adjustments for lack of sphericity are
usually actually based on possible lack
of compound symmetry.
Assumptions
25. References
BOOKS AND ARTICLES
Bonate, P. (2000). Analysis of Pretest-Posttest Designs.
CRC Press.
Horn, R. (n.d.). Understanding Analysis of Covariance.
Retrieved October 26, 2017 from:
http://oak.ucc.nau.edu/rh232/courses/eps625/
Leech, N. et. al (2005). SPSS for Intermediate Statistics:
Use and Interpretation. Psychology Press.
Overall, J. (1993). Letter to the editor: The use of
inadequate correlations for baseline imbalance remains
a serious problem. J.Biopharm. Stat. 3, 271.
Senn, S. (1994). Testing for baseline balance in clinical
trials. Statistics in Medicine. Volume 13, Issue 17.
Vogt, W. P. (1999). Dictionary of Statistics and
Methodology: A Nontechnical Guide for the Social
Sciences (2nd ed.). Thousand Oaks, CA: Sage
Publications.
https://statistics.laerd.com/spss-tutorials/ancova-using-
spss-statistics.php