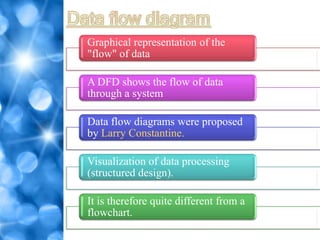
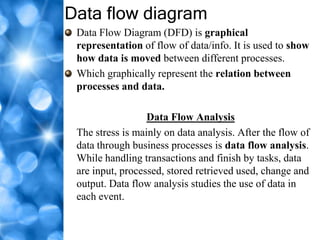
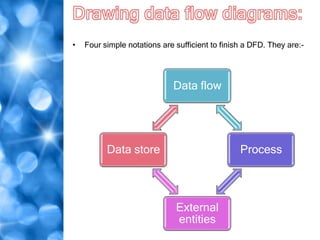
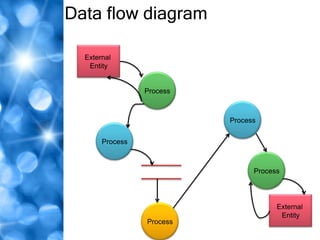
Graphical representation of the
"flow" of data

A DFD shows the flow of data
through a system

Data flow diagrams were proposed
by Larry Constantine.

Visualization of data processing
(structured design).

It is therefore quite different from a
flowchart.
Data flow diagram
 Data Flow Diagram (DFD) is graphical
 representation of flow of data/info. It is used to show
 how data is moved between different processes.
 Which graphically represent the relation between
 processes and data.

                  Data Flow Analysis
 The stress is mainly on data analysis. After the flow of
 data through business processes is data flow analysis.
 While handling transactions and finish by tasks, data
 are input, processed, stored retrieved used, change and
 output. Data flow analysis studies the use of data in
 each event.
Physical Data flow diagram
•   Physical characteristics include
         - Names of people
         - Forms and document Name
         - Names of department
         - Master and transaction files
         - Equipments and devices used
         - Locations
•   Most comprehensive and useful approach to developing an accurate
    and complete description of current system begins with the development
    of a physical DFD
Data flow diagram
 Data Flow Diagram (DFD) is graphical
 representation of flow of data/info. It is used to show
 how data is moved between different processes.
 Which graphically represent the relation between
 processes and data.

                  Data Flow Analysis
 The stress is mainly on data analysis. After the flow of
 data through business processes is data flow analysis.
 While handling transactions and finish by tasks, data
 are input, processed, stored retrieved used, change and
 output. Data flow analysis studies the use of data in
 each event.
•   Four simple notations are sufficient to finish a DFD. They are:-


                             Data flow


          Data store                             Process


                              External
                              entities
Data flow diagram

  External
   Entity


                 Process


                           Process


       Process


                                 Process


                                       External
                                        Entity
                 Process
Simple graphic technique


Helps in defining the
boundaries

Communicating current
system

As a part of system
documentation file

Explains the logic behind the
DF within the system
Physical consideration
are left out

Confusion about the
system

Different DFDs model
have different symbols


Process is slow

Feasibility study and data flow diagram

  • 3.
    Graphical representation ofthe "flow" of data A DFD shows the flow of data through a system Data flow diagrams were proposed by Larry Constantine. Visualization of data processing (structured design). It is therefore quite different from a flowchart.
  • 4.
    Data flow diagram Data Flow Diagram (DFD) is graphical representation of flow of data/info. It is used to show how data is moved between different processes. Which graphically represent the relation between processes and data. Data Flow Analysis The stress is mainly on data analysis. After the flow of data through business processes is data flow analysis. While handling transactions and finish by tasks, data are input, processed, stored retrieved used, change and output. Data flow analysis studies the use of data in each event.
  • 6.
    Physical Data flowdiagram • Physical characteristics include - Names of people - Forms and document Name - Names of department - Master and transaction files - Equipments and devices used - Locations • Most comprehensive and useful approach to developing an accurate and complete description of current system begins with the development of a physical DFD
  • 7.
    Data flow diagram Data Flow Diagram (DFD) is graphical representation of flow of data/info. It is used to show how data is moved between different processes. Which graphically represent the relation between processes and data. Data Flow Analysis The stress is mainly on data analysis. After the flow of data through business processes is data flow analysis. While handling transactions and finish by tasks, data are input, processed, stored retrieved used, change and output. Data flow analysis studies the use of data in each event.
  • 8.
    Four simple notations are sufficient to finish a DFD. They are:- Data flow Data store Process External entities
  • 9.
    Data flow diagram External Entity Process Process Process Process External Entity Process
  • 10.
    Simple graphic technique Helpsin defining the boundaries Communicating current system As a part of system documentation file Explains the logic behind the DF within the system
  • 11.
    Physical consideration are leftout Confusion about the system Different DFDs model have different symbols Process is slow