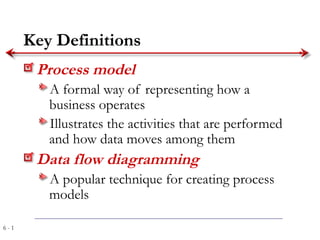
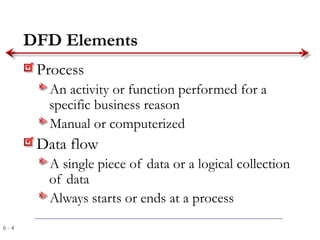
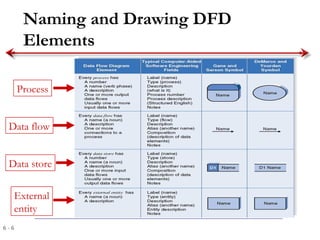
6 - 1
Key Definitions
Process model
A formal way of representing how a
business operates
Illustrates the activities that are performed
and how data moves among them
Data flow diagramming
A popular technique for creating process
models
6 - 2
Key Definitions
Logical process models describe
processes without suggesting how they
are conducted
Physical process models include process
implementation information
6 - 3
DATA FLOW DIAGRAMSDATA FLOW DIAGRAMS
6 - 4
DFD Elements
Process
An activity or function performed for a
specific business reason
Manual or computerized
Data flow
A single piece of data or a logical collection
of data
Always starts or ends at a process
6 - 5
DFD Elements
Data Store
A collection of data that is stored in some way
Data flowing out is retrieved from the data store
Data flowing in updates or is added to the data
store
External entity
A person, organization, or system that is external
to the system but interacts with it.
6 - 6
Naming and Drawing DFD
Elements
Process
Data flow
Data store
External
entity
6 - 7
Key Definition
Balancing involves insuring that
information presented at one level of a
DFD is accurately represented in the next
level DFD.
6 - 8
Relationship Among DFD levels
Context diagram
Level 0 diagram
Level 1 diagram
Level 2 diagram
6 - 9
Context Diagram
First DFD in every business process
Shows the context into which the business
process fits
Shows the overall business process as just one
process (process 0)
Shows all the external entities that receive
information from or contribute information to
the system
6 - 10
Level 0 Diagram
Shows all the major processes that comprise
the overall system – the internal components
of process 0
Shows how the major processes are
interrelated by data flows
Shows external entities and the major
processes with which they interact
Adds data stores
6 - 11
Level 1 Diagrams
Generally, one level 1 diagram is created for every
major process on the level 0 diagram
Shows all the internal processes that comprise a single
process on the level 0 diagram
Shows how information moves from and to each of
these processes
If a parent process is decomposed into, for example,
three child processes, these three child processes
wholly and completely make up the parent process
6 - 12
Level 2 Diagrams
Shows all processes that comprise a single process on
the level 1 diagram
Shows how information moves from and to each of
these processes
Level 2 diagrams may not be needed for all level 1
processes
Correctly numbering each process helps the user
understand where the process fits into the overall
system
6 - 13
Summary
The Data Flow Diagram (DFD) is an essential
tool for creating formal descriptions of business
processes.
Use cases record the input, transformation, and
output of business processes and are the basis for
process models.
Eliciting use cases and modeling business
processes are critically important skills for the
systems analyst to master.

Dfd 3

  • 1.
    6 - 1 KeyDefinitions Process model A formal way of representing how a business operates Illustrates the activities that are performed and how data moves among them Data flow diagramming A popular technique for creating process models
  • 2.
    6 - 2 KeyDefinitions Logical process models describe processes without suggesting how they are conducted Physical process models include process implementation information
  • 3.
    6 - 3 DATAFLOW DIAGRAMSDATA FLOW DIAGRAMS
  • 4.
    6 - 4 DFDElements Process An activity or function performed for a specific business reason Manual or computerized Data flow A single piece of data or a logical collection of data Always starts or ends at a process
  • 5.
    6 - 5 DFDElements Data Store A collection of data that is stored in some way Data flowing out is retrieved from the data store Data flowing in updates or is added to the data store External entity A person, organization, or system that is external to the system but interacts with it.
  • 6.
    6 - 6 Namingand Drawing DFD Elements Process Data flow Data store External entity
  • 7.
    6 - 7 KeyDefinition Balancing involves insuring that information presented at one level of a DFD is accurately represented in the next level DFD.
  • 8.
    6 - 8 RelationshipAmong DFD levels Context diagram Level 0 diagram Level 1 diagram Level 2 diagram
  • 9.
    6 - 9 ContextDiagram First DFD in every business process Shows the context into which the business process fits Shows the overall business process as just one process (process 0) Shows all the external entities that receive information from or contribute information to the system
  • 10.
    6 - 10 Level0 Diagram Shows all the major processes that comprise the overall system – the internal components of process 0 Shows how the major processes are interrelated by data flows Shows external entities and the major processes with which they interact Adds data stores
  • 11.
    6 - 11 Level1 Diagrams Generally, one level 1 diagram is created for every major process on the level 0 diagram Shows all the internal processes that comprise a single process on the level 0 diagram Shows how information moves from and to each of these processes If a parent process is decomposed into, for example, three child processes, these three child processes wholly and completely make up the parent process
  • 12.
    6 - 12 Level2 Diagrams Shows all processes that comprise a single process on the level 1 diagram Shows how information moves from and to each of these processes Level 2 diagrams may not be needed for all level 1 processes Correctly numbering each process helps the user understand where the process fits into the overall system
  • 13.
    6 - 13 Summary TheData Flow Diagram (DFD) is an essential tool for creating formal descriptions of business processes. Use cases record the input, transformation, and output of business processes and are the basis for process models. Eliciting use cases and modeling business processes are critically important skills for the systems analyst to master.