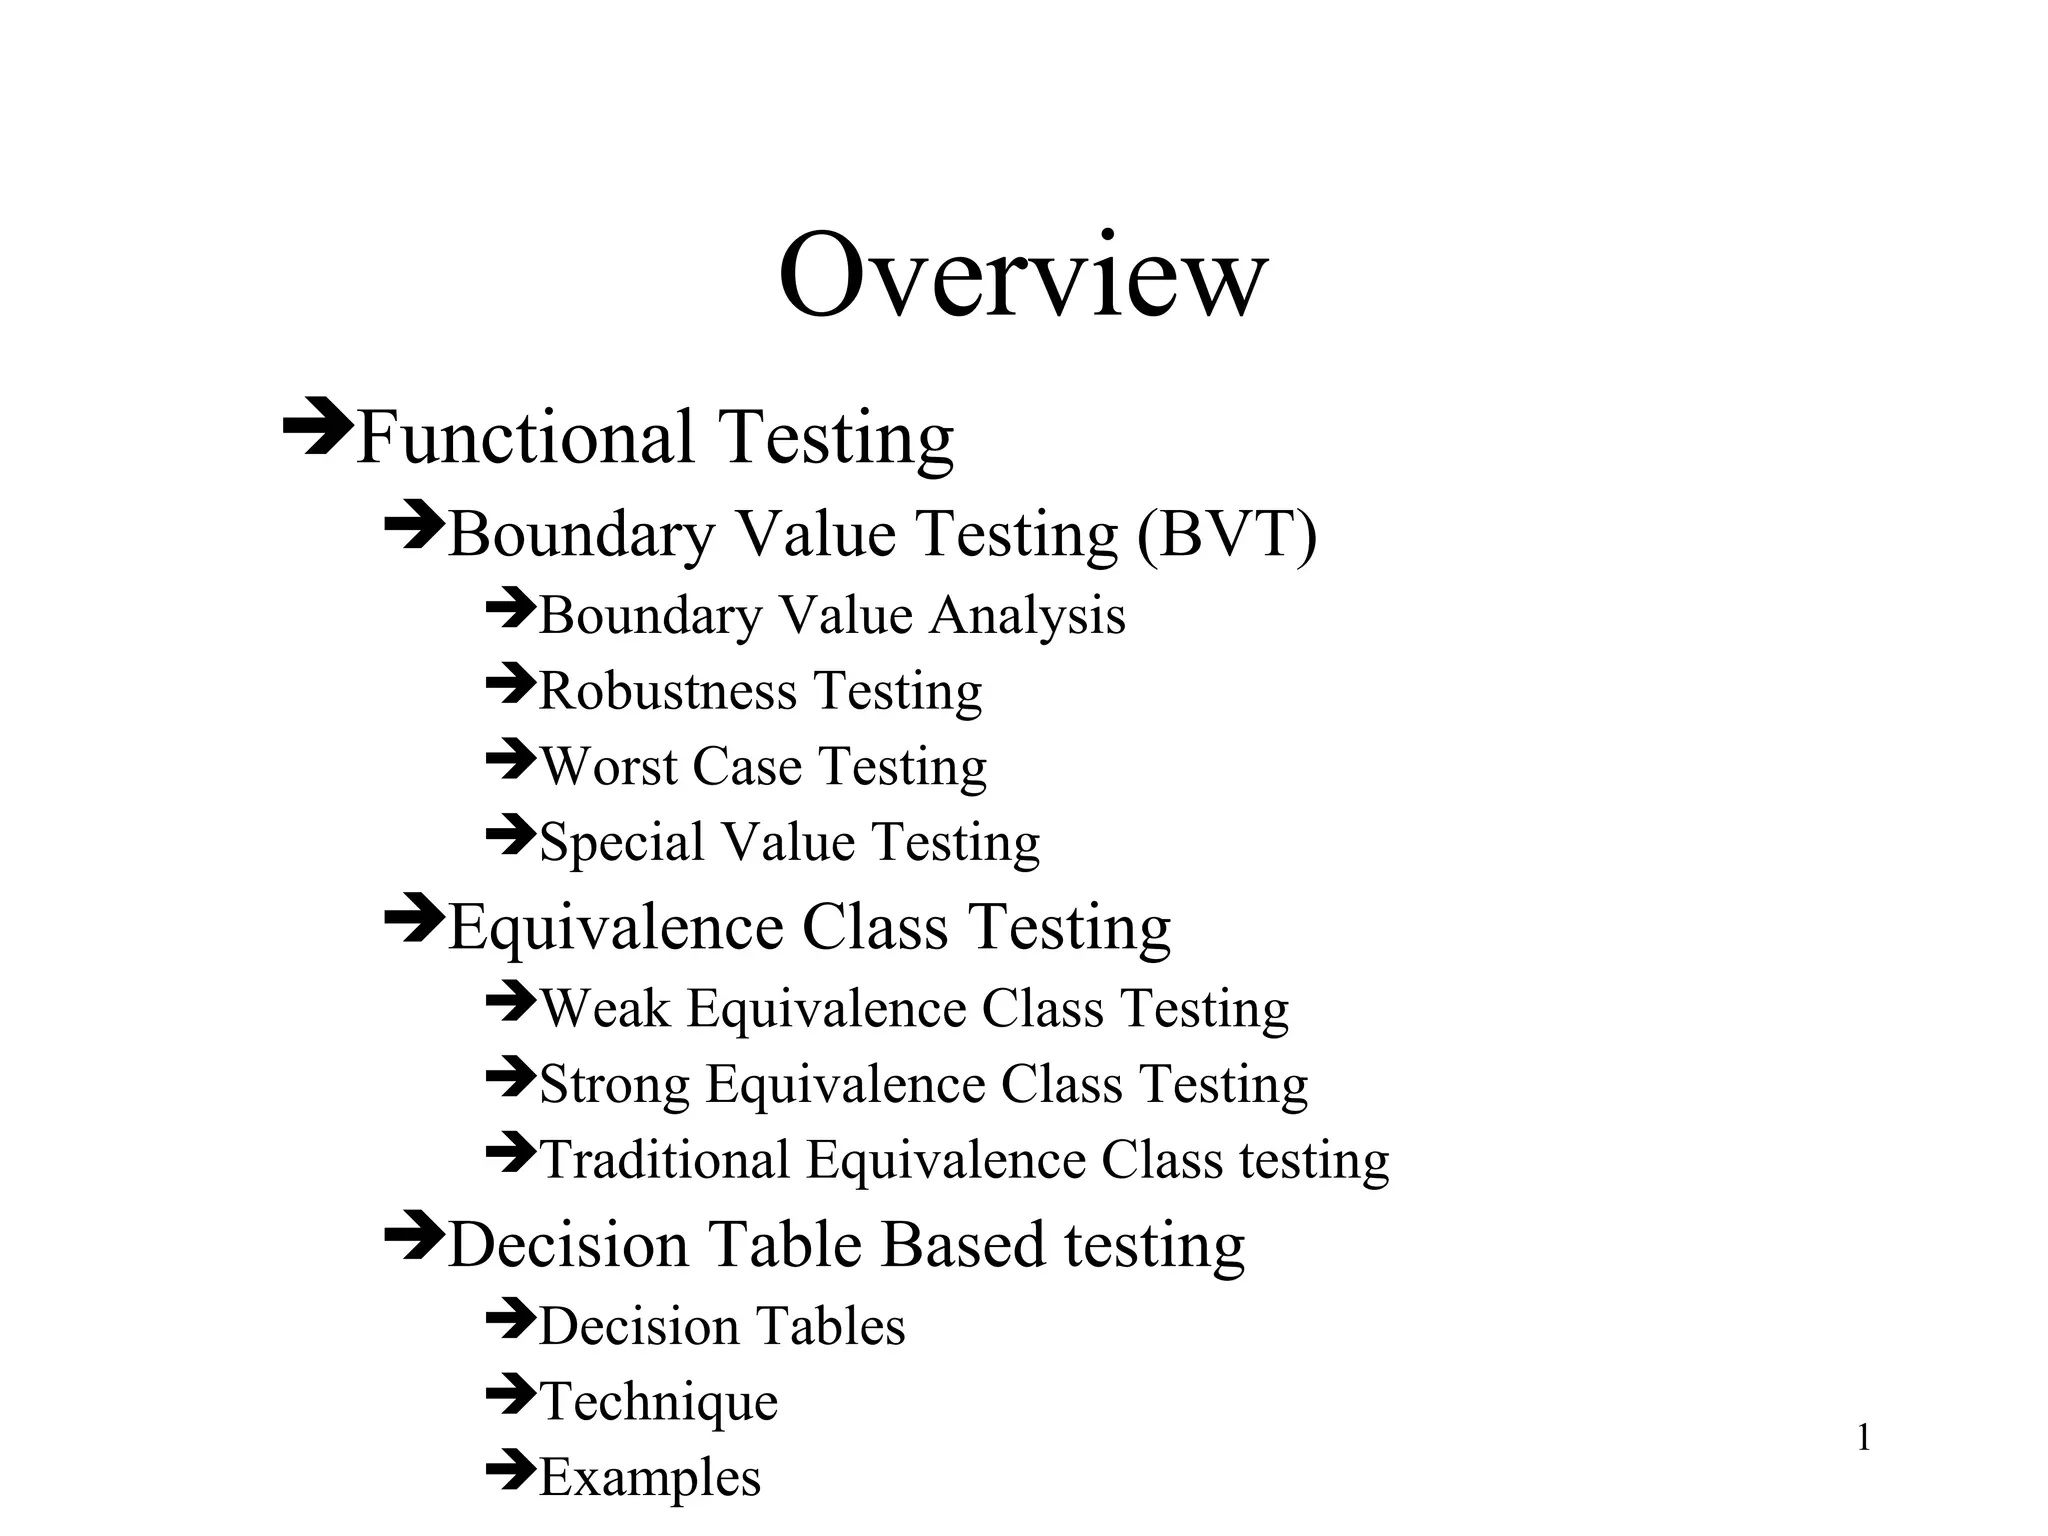
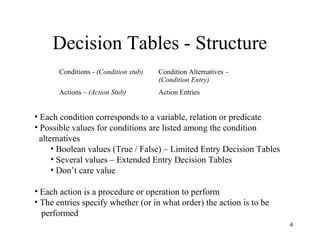
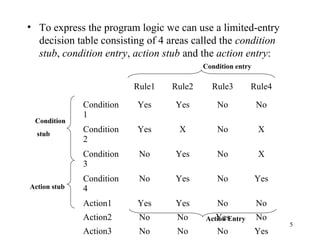
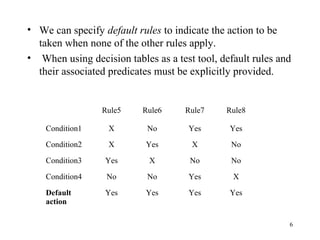
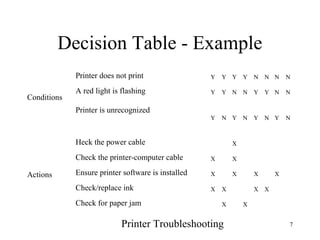
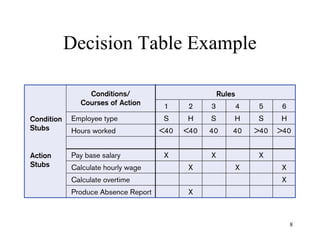
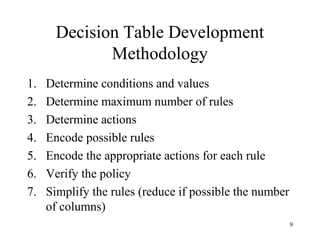
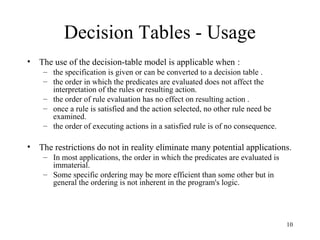
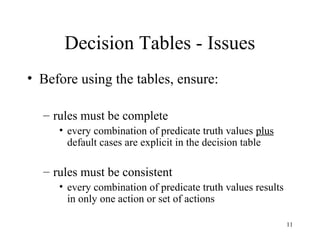
1
Overview
Functional Testing
Boundary Value Testing (BVT)
Boundary Value Analysis
Robustness Testing
Worst Case Testing
Special Value Testing
Equivalence Class Testing
Weak Equivalence Class Testing
Strong Equivalence Class Testing
Traditional Equivalence Class testing
Decision Table Based testing
Decision Tables
Technique
Examples
2
Decision Tables - General
Decision tables are a precise yet compact way to
model complicated logic. Decision tables, like if-
then-else and switch-case statements, associate
conditions with actions to perform. But, unlike the
control structures found in traditional
programming languages, decision tables can
associate many independent conditions with
several actions in an elegant way.
“http://en.wikipedia.org/wiki/Decision_table”
3
Decision Tables - Usage
• Decision tables make it easy to observe that all possible
conditions are accounted for.
• Decision tables can be used for:
– Specifying complex program logic
– Generating test cases (Also known as logic-based testing)
• Logic-based testing is considered as:
– structural testing when applied to structure (i.e. control flowgraph
of an implementation).
– functional testing when applied to a specification.
4
Decision Tables - Structure
Conditions - (Condition stub) Condition Alternatives –
(Condition Entry)
Actions – (Action Stub) Action Entries
• Each condition corresponds to a variable, relation or predicate
• Possible values for conditions are listed among the condition
alternatives
• Boolean values (True / False) – Limited Entry Decision Tables
• Several values – Extended Entry Decision Tables
• Don’t care value
• Each action is a procedure or operation to perform
• The entries specify whether (or in what order) the action is to be
performed
5
• To express the program logic we can use a limited-entry
decision table consisting of 4 areas called the condition
stub, condition entry, action stub and the action entry:
Rule1 Rule2 Rule3 Rule4
Condition
1
Yes Yes No No
Condition
2
Yes X No X
Condition
3
No Yes No X
Condition
4
No Yes No Yes
Action1 Yes Yes No No
Action2 No No Yes No
Action3 No No No Yes
Condition
stub
Action stub
Action Entry
Condition entry
6
• We can specify default rules to indicate the action to be
taken when none of the other rules apply.
• When using decision tables as a test tool, default rules and
their associated predicates must be explicitly provided.
Rule5 Rule6 Rule7 Rule8
Condition1 X No Yes Yes
Condition2 X Yes X No
Condition3 Yes X No No
Condition4 No No Yes X
Default
action
Yes Yes Yes Yes
7
Decision Table - Example
Conditions
Printer does not print Y Y Y Y N N N N
A red light is flashing Y Y N N Y Y N N
Printer is unrecognized
Y N Y N Y N Y N
Actions
Heck the power cable X
Check the printer-computer cable X X
Ensure printer software is installed X X X X
Check/replace ink X X X X
Check for paper jam X X
Printer Troubleshooting
8
Decision Table Example
9
Decision Table Development
Methodology
1. Determine conditions and values
2. Determine maximum number of rules
3. Determine actions
4. Encode possible rules
5. Encode the appropriate actions for each rule
6. Verify the policy
7. Simplify the rules (reduce if possible the number
of columns)
10
Decision Tables - Usage
• The use of the decision-table model is applicable when :
– the specification is given or can be converted to a decision table .
– the order in which the predicates are evaluated does not affect the
interpretation of the rules or resulting action.
– the order of rule evaluation has no effect on resulting action .
– once a rule is satisfied and the action selected, no other rule need be
examined.
– the order of executing actions in a satisfied rule is of no consequence.
• The restrictions do not in reality eliminate many potential applications.
– In most applications, the order in which the predicates are evaluated is
immaterial.
– Some specific ordering may be more efficient than some other but in
general the ordering is not inherent in the program's logic.
11
Decision Tables - Issues
• Before using the tables, ensure:
– rules must be complete
• every combination of predicate truth values plus
default cases are explicit in the decision table
– rules must be consistent
• every combination of predicate truth values results
in only one action or set of actions
12
Processes
• These lectures all relate to processes:
– Describing, analyzing, developing, modifying,
documenting,…
• Types of processes include:
– Decision processes
– Data flow & manipulation processes, …
• Specific approaches depend on internal
needs & practices, standards
• “A process model is a formal way of
representing how a business operates”
13
Flow charts
• There are several standards – just be
consistent
• Manual methods vs. automated tools
– Visio, PowerPoint, etc.
• Waves of fashion / variety of uses
– Programming
– Documenting processes
– Multi-user settings
– General documentation of all sorts
14
Flow chart techniques
• Basic symbols
– Terminator
– Process
– Decision
– Predefined process
– On-page connector
– Connector
T e r m in a t o r
P r o c e s s
D e c is io n
P r e d e f in e d
P r o c e s s
1
Y e s
N o
T h is c a llo u t
p o in t s t o a
c o n n e c t o r
15
Flowchart guidelines
1. Top to bottom, left to right on the page
2. Activity being flowcharted should be defined
carefully and made clear to reader
3. Identity start and end
4. Use “one-verb” (verb-noun) descriptions
– Examples: “prepare statement,” “file record”
1. Keep steps in proper sequence
2. Observe scope & range of activity; branches
should be on separate pages
3. Use standard symbols; lines should NOT cross
– Use cross-overs only if necessary; keep lines straight
1. No blind alleys or endless loops
What is UML and Why we use UML?
1997: UML 1.0, 1.1
1996: UML 0.9 & 0.91
1995: Unified Method 0.8
Other methods
Booch ‘91
Booch ‘93 OMT - 2
OMT - 1
Year Version
2003: UML 2.0
2001: UML 1.4
1999: UML 1.3
How to use UML diagrams to
design software system?
• Types of UML Diagrams:
 Use Case Diagram
 Class Diagram
 Sequence Diagram
 Collaboration Diagram
 State Diagram
This is only a subset of diagrams … but are most widely used
Use-Case Diagrams
• A use-case diagram is a set of use cases
• A use case is a model of the interaction between
 External users of a software product (actors) and
 The software product itself
 More precisely, an actor is a user playing a specific role
• describing a set of user scenarios
• capturing user requirements
• contract between end user and software developers
Use-Case Diagrams
Library System
Borrow
Order Title
Fine Remittance
Client
Employee
Supervisor
Boundary
Actor
Use Case
Use-Case Diagrams
• Actors: A role that a user plays with respect to the system, including human
users and other systems. e.g., inanimate physical objects (e.g. robot); an
external system that needs some information from the current system.
• Use case: A set of scenarios that describing an interaction between a user
and a system, including alternatives.
• System boundary: rectangle diagram representing the boundary between
the actors and the system.
Use-Case Diagrams
• Association:
communication between an actor and a use case; Represented by a solid line.
• Generalization: relationship between one general use case and a special use
case (used for defining special alternatives) Represented by a line with a
triangular arrow head toward the parent use case.
Use-Case Diagrams
Extend: a dotted line labeled <<extend>> with
an arrow toward the base case. The extending
use case may add behavior to the base use
case. The base class declares “extension
points”.
Include: a dotted line labeled <<include>>
beginning at base use case and ending with an
arrows pointing to the include use case. The
include relationship occurs when a chunk of
behavior is similar across more than one use
case. Use “include” in stead of copying the
description of that behavior.
<<include>>
Use-Case Diagrams
Figure 16.12
The McGraw-Hill Companies, 2005
Use-Case Diagrams
• Both Make Appointment
and Request Medication
include Check Patient
Record as a subtask
(include)
• The extension point is
written inside the base
case Pay bill; the
extending class Defer
payment adds the
behavior of this extension
point. (extend)
• Pay Bill is a parent use
case and Bill Insurance
is the child use case.
(generalization)
(TogetherSoft, Inc)
Instances and Schemas
• Similar to types and variables in
programming languages
• Schema – the logical structure of the
database (e.g., set of customers and
accounts and the relationship between
them)
• Instance – the actual content of the database
at a particular point in time
Data Independence
• Ability to modify a schema definition in
one level without affecting a schema
definition in the other levels.
• The interfaces between the various levels
and components should be well defined so
that changes in some parts do not seriously
influence others.
• Two levels of data independence
– Physical data independence
– Logical data independence
Data Models
• A collection of tools for describing:
– Data
– Data relationships
– Data semantics
– Data constraints
• Object-based logical models
– Entity-relationship model
– Object-oriented model
– Semantic model
– Functional model
• Record-based logical models
– Relational model (e.g., SQL/DS, DB2)
– Network model
– Hierarchical model (e.g., IMS)
Entity-Relationship Model
Example of entity-relationship model
customer accountdepositor
social-security customer-street
customer-name
account-number
balancecustomer-city
Relational Model
Example of tabular data in the relational model:
name ssn street city account-number
Johnson 192-83-7465 Alma Palo Alto A-101
Smith 019-28-3746 North Rye A-215
Johnson 192-83-7465 Alma Palo Alto A-201
Jones 321-12-3123 Main Harrison A-217
Smith 019-28-3746 North Rye A-201
account-number balance
A-101 500
A-201 900
A-215 700
A-217 750

Decision table

  • 1.
    1 Overview Functional Testing Boundary ValueTesting (BVT) Boundary Value Analysis Robustness Testing Worst Case Testing Special Value Testing Equivalence Class Testing Weak Equivalence Class Testing Strong Equivalence Class Testing Traditional Equivalence Class testing Decision Table Based testing Decision Tables Technique Examples
  • 2.
    2 Decision Tables -General Decision tables are a precise yet compact way to model complicated logic. Decision tables, like if- then-else and switch-case statements, associate conditions with actions to perform. But, unlike the control structures found in traditional programming languages, decision tables can associate many independent conditions with several actions in an elegant way. “http://en.wikipedia.org/wiki/Decision_table”
  • 3.
    3 Decision Tables -Usage • Decision tables make it easy to observe that all possible conditions are accounted for. • Decision tables can be used for: – Specifying complex program logic – Generating test cases (Also known as logic-based testing) • Logic-based testing is considered as: – structural testing when applied to structure (i.e. control flowgraph of an implementation). – functional testing when applied to a specification.
  • 4.
    4 Decision Tables -Structure Conditions - (Condition stub) Condition Alternatives – (Condition Entry) Actions – (Action Stub) Action Entries • Each condition corresponds to a variable, relation or predicate • Possible values for conditions are listed among the condition alternatives • Boolean values (True / False) – Limited Entry Decision Tables • Several values – Extended Entry Decision Tables • Don’t care value • Each action is a procedure or operation to perform • The entries specify whether (or in what order) the action is to be performed
  • 5.
    5 • To expressthe program logic we can use a limited-entry decision table consisting of 4 areas called the condition stub, condition entry, action stub and the action entry: Rule1 Rule2 Rule3 Rule4 Condition 1 Yes Yes No No Condition 2 Yes X No X Condition 3 No Yes No X Condition 4 No Yes No Yes Action1 Yes Yes No No Action2 No No Yes No Action3 No No No Yes Condition stub Action stub Action Entry Condition entry
  • 6.
    6 • We canspecify default rules to indicate the action to be taken when none of the other rules apply. • When using decision tables as a test tool, default rules and their associated predicates must be explicitly provided. Rule5 Rule6 Rule7 Rule8 Condition1 X No Yes Yes Condition2 X Yes X No Condition3 Yes X No No Condition4 No No Yes X Default action Yes Yes Yes Yes
  • 7.
    7 Decision Table -Example Conditions Printer does not print Y Y Y Y N N N N A red light is flashing Y Y N N Y Y N N Printer is unrecognized Y N Y N Y N Y N Actions Heck the power cable X Check the printer-computer cable X X Ensure printer software is installed X X X X Check/replace ink X X X X Check for paper jam X X Printer Troubleshooting
  • 8.
  • 9.
    9 Decision Table Development Methodology 1.Determine conditions and values 2. Determine maximum number of rules 3. Determine actions 4. Encode possible rules 5. Encode the appropriate actions for each rule 6. Verify the policy 7. Simplify the rules (reduce if possible the number of columns)
  • 10.
    10 Decision Tables -Usage • The use of the decision-table model is applicable when : – the specification is given or can be converted to a decision table . – the order in which the predicates are evaluated does not affect the interpretation of the rules or resulting action. – the order of rule evaluation has no effect on resulting action . – once a rule is satisfied and the action selected, no other rule need be examined. – the order of executing actions in a satisfied rule is of no consequence. • The restrictions do not in reality eliminate many potential applications. – In most applications, the order in which the predicates are evaluated is immaterial. – Some specific ordering may be more efficient than some other but in general the ordering is not inherent in the program's logic.
  • 11.
    11 Decision Tables -Issues • Before using the tables, ensure: – rules must be complete • every combination of predicate truth values plus default cases are explicit in the decision table – rules must be consistent • every combination of predicate truth values results in only one action or set of actions
  • 12.
    12 Processes • These lecturesall relate to processes: – Describing, analyzing, developing, modifying, documenting,… • Types of processes include: – Decision processes – Data flow & manipulation processes, … • Specific approaches depend on internal needs & practices, standards • “A process model is a formal way of representing how a business operates”
  • 13.
    13 Flow charts • Thereare several standards – just be consistent • Manual methods vs. automated tools – Visio, PowerPoint, etc. • Waves of fashion / variety of uses – Programming – Documenting processes – Multi-user settings – General documentation of all sorts
  • 14.
    14 Flow chart techniques •Basic symbols – Terminator – Process – Decision – Predefined process – On-page connector – Connector T e r m in a t o r P r o c e s s D e c is io n P r e d e f in e d P r o c e s s 1 Y e s N o T h is c a llo u t p o in t s t o a c o n n e c t o r
  • 15.
    15 Flowchart guidelines 1. Topto bottom, left to right on the page 2. Activity being flowcharted should be defined carefully and made clear to reader 3. Identity start and end 4. Use “one-verb” (verb-noun) descriptions – Examples: “prepare statement,” “file record” 1. Keep steps in proper sequence 2. Observe scope & range of activity; branches should be on separate pages 3. Use standard symbols; lines should NOT cross – Use cross-overs only if necessary; keep lines straight 1. No blind alleys or endless loops
  • 16.
    What is UMLand Why we use UML? 1997: UML 1.0, 1.1 1996: UML 0.9 & 0.91 1995: Unified Method 0.8 Other methods Booch ‘91 Booch ‘93 OMT - 2 OMT - 1 Year Version 2003: UML 2.0 2001: UML 1.4 1999: UML 1.3
  • 17.
    How to useUML diagrams to design software system? • Types of UML Diagrams:  Use Case Diagram  Class Diagram  Sequence Diagram  Collaboration Diagram  State Diagram This is only a subset of diagrams … but are most widely used
  • 18.
    Use-Case Diagrams • Ause-case diagram is a set of use cases • A use case is a model of the interaction between  External users of a software product (actors) and  The software product itself  More precisely, an actor is a user playing a specific role • describing a set of user scenarios • capturing user requirements • contract between end user and software developers
  • 19.
    Use-Case Diagrams Library System Borrow OrderTitle Fine Remittance Client Employee Supervisor Boundary Actor Use Case
  • 20.
    Use-Case Diagrams • Actors:A role that a user plays with respect to the system, including human users and other systems. e.g., inanimate physical objects (e.g. robot); an external system that needs some information from the current system. • Use case: A set of scenarios that describing an interaction between a user and a system, including alternatives. • System boundary: rectangle diagram representing the boundary between the actors and the system.
  • 21.
    Use-Case Diagrams • Association: communicationbetween an actor and a use case; Represented by a solid line. • Generalization: relationship between one general use case and a special use case (used for defining special alternatives) Represented by a line with a triangular arrow head toward the parent use case.
  • 22.
    Use-Case Diagrams Extend: adotted line labeled <<extend>> with an arrow toward the base case. The extending use case may add behavior to the base use case. The base class declares “extension points”. Include: a dotted line labeled <<include>> beginning at base use case and ending with an arrows pointing to the include use case. The include relationship occurs when a chunk of behavior is similar across more than one use case. Use “include” in stead of copying the description of that behavior. <<include>>
  • 23.
    Use-Case Diagrams Figure 16.12 TheMcGraw-Hill Companies, 2005
  • 24.
    Use-Case Diagrams • BothMake Appointment and Request Medication include Check Patient Record as a subtask (include) • The extension point is written inside the base case Pay bill; the extending class Defer payment adds the behavior of this extension point. (extend) • Pay Bill is a parent use case and Bill Insurance is the child use case. (generalization) (TogetherSoft, Inc)
  • 25.
    Instances and Schemas •Similar to types and variables in programming languages • Schema – the logical structure of the database (e.g., set of customers and accounts and the relationship between them) • Instance – the actual content of the database at a particular point in time
  • 26.
    Data Independence • Abilityto modify a schema definition in one level without affecting a schema definition in the other levels. • The interfaces between the various levels and components should be well defined so that changes in some parts do not seriously influence others. • Two levels of data independence – Physical data independence – Logical data independence
  • 27.
    Data Models • Acollection of tools for describing: – Data – Data relationships – Data semantics – Data constraints • Object-based logical models – Entity-relationship model – Object-oriented model – Semantic model – Functional model • Record-based logical models – Relational model (e.g., SQL/DS, DB2) – Network model – Hierarchical model (e.g., IMS)
  • 28.
    Entity-Relationship Model Example ofentity-relationship model customer accountdepositor social-security customer-street customer-name account-number balancecustomer-city
  • 29.
    Relational Model Example oftabular data in the relational model: name ssn street city account-number Johnson 192-83-7465 Alma Palo Alto A-101 Smith 019-28-3746 North Rye A-215 Johnson 192-83-7465 Alma Palo Alto A-201 Jones 321-12-3123 Main Harrison A-217 Smith 019-28-3746 North Rye A-201 account-number balance A-101 500 A-201 900 A-215 700 A-217 750