Downloaded 32 times


![Class Diagram
A class diagram shows classes, interfaces, and their
relationships
It shows the classes in a system, attributes and operations of
each class and the relationship between each class.
In most modeling tools a class has three parts, name at the top,
attributes in the middle and operations or methods at the
bottom
Name of the class
Variables [optional]
Methods](https://image.slidesharecdn.com/umlwithdetail-141122014509-conversion-gate02/85/Uml-with-detail-6-320.jpg)
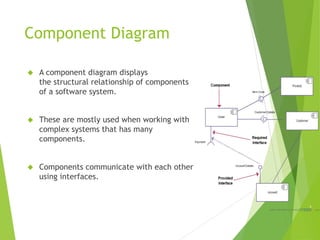
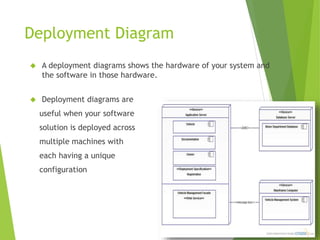
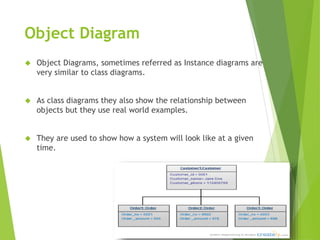
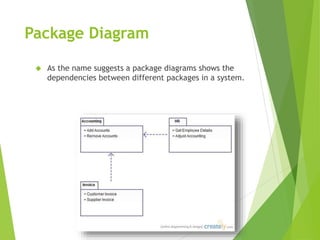


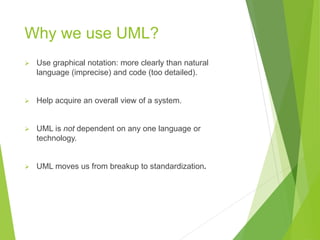
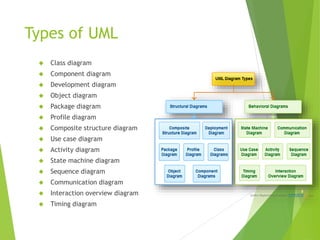
UML (Unified Modeling Language) is a diagramming language used for object-oriented programming. It can be used to describe the organization, execution, use, and deployment of a program. UML uses graphical notation to provide an overall view of a system, and is not dependent on any one programming language. There are several types of UML diagrams including class, component, deployment, object, package, and use case diagrams. Structure diagrams show objects in a system, while behavioral diagrams show how objects interact. Common diagrams include class, use case, activity, state machine, sequence, and communication diagrams.