Download to read offline

![white noise model. More precisely, as the number of photon
counts increases, the noise variance in a square-root image
tends to a constant, independent of the signal intensity. The
inverse Anscombe’s transformation is easily obtained by
manipulating Equation 2. In order to have a more tractable
problem, in this work we are considering that the images are
corrupted only by additive Poisson noise. Other sources of
noise, including electronic noise normally present in digital
radiographic systems, were not taken into account.
Dual-Tree Complex Wavelet
Compared with the DWT, the dual-tree complex wavelet
transform is a very attractive technique for medical image
denoising because it performs as well as the undecimated
DWT, in the context of shift invariance, and with significantly
lower computational cost.8
The nearly shift invariant property is obtained with a real
biorthogonal transform having double the sampling rate at each
scale and by computing parallel wavelet trees as illustrated in
Figure 3, which are differently subsampled. The DT-CWT
presents perfect shift invariance at level 1, and approximate
shift invariance, beyond this level. The DT-CWT also presents
limited redundancy in the representation (4:1 for the 2D case—
independent of the number of scales), good directional
selectivity (six oriented subbands: T15-, T45-, T75-), and it
permits perfect image reconstruction.
Hidden Markov Tree Model in the
Wavelet Domain
The HMT model, applied in the wavelet context,1
is a
statistical model that can be used to capture statistical
correlations between the magnitudes of wavelet coefficients
across consecutive scales of resolution. The HMT works by
modeling the following three important properties of the
wavelet coefficients:
Non-Gaussian distribution: The marginal distribution of
the magnitude of the complex wavelet coefficients can be
well modeled by using a mixture of two-state Rayleigh
distributions. The choice for using the Rayleigh mixture
model instead of the Gaussian mixture model was based
upon the fact that the real and imaginary parts of the
complex wavelet coefficients may be slightly correlated,
and therefore only the magnitudes of the complex wavelet
coefficients will present a nearly shift-invariant property,
but not the phase.9
Persistency: Large/small wavelet coefficients related to
pixels in the image tend to propagate through scales of the
quad trees. Therefore, a state variable is defined for each
wavelet coefficient that associates the coefficient with one
of the two Rayleigh marginal distributions [one with small
(S) and the other with large (L) variance]. The HMT model
is then constructed by connecting the state variables (L and
S) across scales using the ExpectationYMaximization
(EM) algorithm. Figure 4 shows the 1D structure of the
HMT model.
Clustering: Adjacent wavelet coefficients of a particular
large/small coefficient are very likely to share the same
state (large/small).
The HMT model is parameterized1
by the conditional
probability stating that the variable Sj is in state m given S jð Þ
is in state n, or, m;n
j ; jð Þ ¼ p Sj ¼ m S jð Þ ¼ n
À Á
m,n = 1,...,2.
The state probability of the root J is indicated by pSJ (m) =
p(Sj = m) and the Rayleigh mixture parameters as mj,m and sj,m
2
.
The value of mj,m is set to zero because the real and imaginary
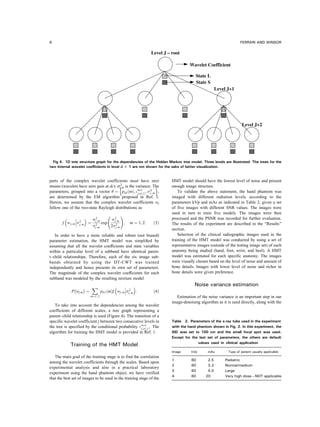
Fig 3. Schematic of the dual-tree complex wavelet transform. (Figure provided by Dr. Kingsbury.8
)
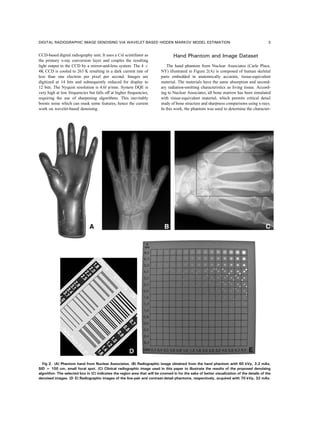
DIGITAL RADIOGRAPHIC IMAGE DENOISING VIA WAVELET-BASED HIDDEN MARKOV MODEL ESTIMATION 5](https://image.slidesharecdn.com/020f63e1-a3ae-4d1c-a342-d5cbcbab49d5-161115132743/85/W6P3622650776P65-5-320.jpg)
![HMT parameters, in our wavelet-based filtering procedure. In
the present work, the noise variance was estimated as
'2
n ¼
ffiffiffiffiffiffiffiffiffiffiffiffiffiffiffiffiffiffiffiffiffiffiffiffiffiffiffiffiffiffiffiffi
'2
real  '2
imaginary
q
; ð5Þ
where sreal
2
and simaginary
2
are, respectively, the noise variance
of the real and imaginary parts of the wavelet coefficients
computed by using the median absolute deviation (MAD,13
)
algorithm.
Denoising Using the HMT
The denoising procedure proposed in this work is composed
of two shrinkage procedures: one is used for levels 1 and 2, and
the other for the subsequent levels. The rationality of this
strategy is related to the fact that the DT-CWT provides perfect
shift invariance only at level 1, and approximate shift
invariance for the other levels. Because of that, the capture of
the inter-scale dependencies among the wavelet coefficients
using the HMT model starts to become unreliable beyond level
2 or 3, due to the considerable image energy variation.
For the first two levels of decomposition, the conditional
mean estimation of the noise-free wavelet coefficient was
obtained using
^wwj ¼ E wj j
 Ã
¼
X
j
p Sj ¼ m wj;
À Á '2
j;m
'2
j;m þ '2
n
wj; ð6Þ
where p(Sj = m|wj,q) is the probability of state m given the
noise wavelet coefficient wj and the model parameters q
computed by the EM algorithm. sn
2
is the variance of the
additive white Gaussian noise and E[] is the expectation
operator.
As the estimation of the subband variances sj,m
2
in the HMT
model is performed using noise wavelet coefficients, their
values are biased and should be corrected. The corrected
estimation is then obtained by
'2
j;m ¼
'2
j;m À '2
n; if '2
j;m '2
n
0; otherwise
(
ð7Þ
After level 2, a modified version of the soft-threshold
procedure proposed in Ref. 14 was used to find the shrinkage
factor
cj ¼
sigm S wj
À T
À ÁÂ Ã
Àsigm ÀS wj
þ T
À ÁÂ Ã
sigm S max wj
À Á
À T
 ÃÈ É
Àsigm ÀS max wj
À Á
þ T
 ÃÈ É
ð8Þ
which is applied to the real and imaginary parts of the complex
wavelet coefficient wj. In the above equation, sigm yð Þ ¼ 1
1þeÀy
is the sigma function, S is an enhancement factor, and
T ¼ 'n= is a threshold value. b is considered as a smoothing
parameter. In the present work the default values of S and b
were set to 1.3 and 0.9, respectively.
RESULTS AND DISCUSSIONS
Figure 5 shows the results of the experiment
carried out to determine the relation between the
radiation dose and the algorithm performance, in0
terms of PSNR. The results were used to confirm
that a high-quality image (the one obtained with a
high x-ray dose, 60 kVp and 20 mAs) is in fact the
best option to be used in the training of the HMT
model. By analyzing the average PSNR values, we
noticed that image 3 (obtained with 60 kVp and
4.0 mAs) provides the second best average result.
The worst choice would be image 1, acquired with
60 kVp and 2.5 mAs. Despite the difference in the
average values shown in Figure 5, and except for
image 4, the PSNR values obtained by using
different training images were very similar. The x-
ray tube parameters used in the experiment are
shown in Table 2.
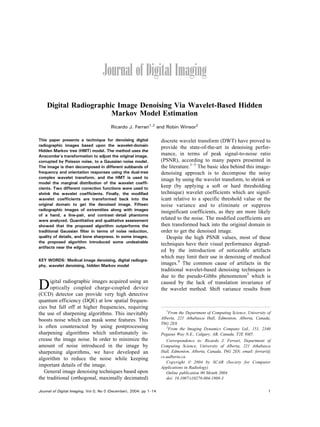
Figure 6 shows the results of the two-state
Rayleigh mixture model fitting the marginal
distribution of the wavelet coefficients for the
first four consecutive levels (1 to 4) of the image
in Figure 2(C). Visual inspection indicates the
good curve fitting provided by the Rayleigh
function. Due to the high image energy concen-
tration around magnitude 0.25 in Figure 6(A)Y(B),
application of a simple threshold technique to
differentiate large/small values of wavelet coef-
ficients, probably would not produce good results.
Indeed, HMT-based denoising algorithms usually
outperform standard thresholding techniques be-
cause the degree of coefficient shrinkage is
determined based not only upon the value of the
coefficient but also upon its relationship with its
neighbors across scales (quad-tree relationship).
Figure 7 shows the line-pair phantom images
denoised by using our proposed algorithm with
Fig 5. PSNR values resulting from the processing of the four
phantom images acquired using different exposure levels. Each
image was used in turn to train a HMT model. Afterwards, the
estimated HMT models were used in the denoising algorithm.
The PSNR average values from columns 1 to 4 in the attached
table are 25.59, 22.64, 22.59, and 22.65, respectively.
DIGITAL RADIOGRAPHIC IMAGE DENOISING VIA WAVELET-BASED HIDDEN MARKOV MODEL ESTIMATION 7](https://image.slidesharecdn.com/020f63e1-a3ae-4d1c-a342-d5cbcbab49d5-161115132743/85/W6P3622650776P65-7-320.jpg)
![two levels of denoising and by using a Gaussian
filter with radius size of two pixels. In the original
image [Fig 2(D)], the sharpness of the edges can
be visually assessed up to 3.4 or 3.7 lp/mm. In
fact, visual inspection of this line-pair phantom
image in a computer monitor can provide up to
4.6 lp/mm using the system described in the
BDigital Radiographic System^ subsection. How-
ever, a noticeable amount of quantum noise can
be observed through the whole image. Figure 7(A)
shows the processed image using our proposed
algorithm. The amount of noise present in the
original line-pair phantom image was reduced
significantly. A noticeable improvement in sharp-
ness can also be visually assessed which is
confirmed by the high PSNR value (Table 3). In
this case, visual differences between the small
edges can be noticed only up to 3.1 lp/mm due to
the blurring effect caused by noise removal.
Visible structured artifacts can be seen closer to
the strong edges of the phantom. Because of the
regular pattern characteristic of the artifacts
introduced in the image, we argue that they may
be acceptable in visual analysis of radiographic
images providing a significant reduction in quan-
tum noise and improvement in sharpness. The
image resulting from the Gaussian filtering is
shown in Figure 7(C). Although the noise level
was considerably reduced without creating any
visible artifact, all the small edge details were
smoothed out. The visual differences between the
edges can only be seen up to 2.2 or 2.5 lp/mm. In
this case, the computed PSNR values were 32.23
and 31.58, respectively. Figures 7(B) and (D) show
the image differences resulting from the subtrac-
tion of the original image and the denoised image.
Fig 6. Example of two-state Rayleigh mixture marginal distributions used to model the wavelet coefficients. The densities summation
and the histograms of the wavelet coefficients are also shown. Plots were obtained for the first four levels (AYD); subbands with
orientation 0-.
8 FERRARI AND WINSOR](https://image.slidesharecdn.com/020f63e1-a3ae-4d1c-a342-d5cbcbab49d5-161115132743/85/W6P3622650776P65-8-320.jpg)


![Comparing these two images, we can easily
confirm that our proposed algorithm can keep
much more of the fine details from the original
image than the Gaussian smoothing method.
Modification in the visual contrast was also
assessed by using the contrastYdetail phantom
image illustrated in Figure 2(E). The denoised
images resulting from applying our proposed
algorithm and the Gaussian smoothing to the
contrastYdetail phantom were visually evaluated
and the respective contrast curves were obtained
as illustrated in Figure 8(A)Y(C). All three plots
[Fig 8(A)Y(C)] show a slight improvement in the
image contrast using the proposed algorithm.
Herein, we would like to mention that the
proposed technique was not designed to improve
the contrast of the image but only reduce the
quantum noise. We believe that introducing small
changes in the algorithm can improve even more
the image contrast. The best result in terms of
contrast improvement was obtained by using the
proposed technique with four levels of denoising
[see Figure 8(C)].
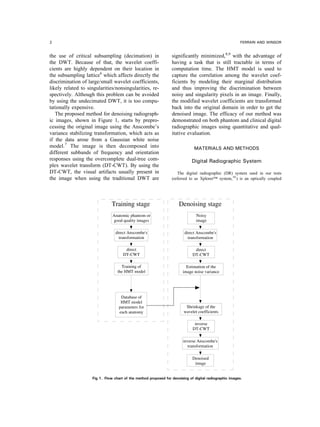
For the sake of comparison, Figures 9 and 11
show examples of the radiographic hand image in
Figure 2(C) denoised by using the proposed
technique with different levels of denoising and
the Gaussian filter with different kernel sizes. The
granular appearance of the images in Figures 9(A)
and 11(A) is typical of images corrupted by
quantum noise. In these cases, the Gaussian filter
and the proposed algorithm using two levels of
Fig 9. Radiographic hand image shown in Figure 2(C)
denoised by using the proposed technique with different levels:
(A) two levels, (B) three levels, and (C) four levels of denoising.
Fig 10. Radiographic hand image shown in Figure 2(C)
denoised by using the isotropic Gaussian filter with different
radius sizes: (AYC) radius sizes equal to 2, 3, and 4 pixels,
respectively.
DIGITAL RADIOGRAPHIC IMAGE DENOISING VIA WAVELET-BASED HIDDEN MARKOV MODEL ESTIMATION 11](https://image.slidesharecdn.com/020f63e1-a3ae-4d1c-a342-d5cbcbab49d5-161115132743/85/W6P3622650776P65-11-320.jpg)
![denoising were not efficient in removing the
noise. A huge improvement in reducing the
quantum noise, however, is demonstrated in
Figures 9(B) and (C). The soft tissue is very clean
and smooth compared to the results of the
Gaussian filter in Figures 11(B) and (C). On the
other hand, the amount of artifacts introduced
close to the strong edges (especially in the
boundaries of the metacarpals hand long bones)
becomes more noticeable, compared to the results
of the Gaussian filter. In general, the edge details
are clearer and crisper in the images processed
using the proposed technique and an improvement
in the overall perceived image sharpness can also
be noticed [see Figures 9(B) and (C) and Figures
11(B) and (C) for comparison]. The improvement
in image sharpness is due to the fact that our
proposed method treats differently soft tissue
regions and regions presenting fine bone details.
This fact can be noticed by comparing Figures
10(A)Y(C) and 12(A)Y(C). These image differ-
ences show that the proposed method can remove
the noise without removing the small bone details
from the image which are of great importance for
diagnostic purposes.
The results obtained from the denoising of the
15 clinical digital radiographs were analyzed
according to the protocol described in the
BProtocol for the Evaluation of Results^ subsec-
tion and are shown in Figure 13. In Figure 13(A),
Fig 11. Image differences computed between the original and
the denoised images using the proposed technique with differ-
ent levels: (A) two levels, (B) three levels, and (C) four levels of
denoising.
Fig 12. Image differences computed between the original and
the denoised images using the isotropic Gaussian filter with
different radius sizes: (AYC) radius sizes equal to 2, 3, and 4
pixels, respectively.
12 FERRARI AND WINSOR](https://image.slidesharecdn.com/020f63e1-a3ae-4d1c-a342-d5cbcbab49d5-161115132743/85/W6P3622650776P65-12-320.jpg)


This paper presents a technique for denoising digital radiographic images using a wavelet-based hidden Markov model. The method first applies the Anscombe transformation to adjust for Poisson noise, then uses the dual-tree complex wavelet transform for decomposition. A hidden Markov tree model is used to capture correlations between wavelet coefficients across scales. Two correction functions are applied to shrink coefficients before inverse transformation. Evaluation on phantom and clinical images showed the method outperforms Gaussian filtering in terms of noise reduction, detail quality and bone sharpness, though some edges had artifacts.