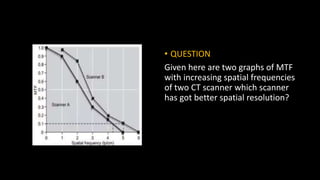
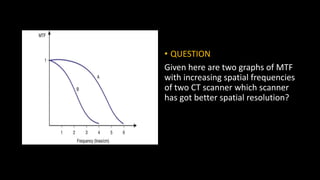
Scanner B has a higher MTF curve across all spatial frequencies compared to Scanner A. This indicates that Scanner B is able to resolve higher spatial frequencies more accurately, meaning it has better spatial resolution than Scanner A.
CT IMAGE QUALITY
DR.Pradeep Patil
Prof. Department of Radio-diagnosis,
DY Patil medical college, hospital & research institute Kolhapur
9.
MODULATION TRANSFER FUNCTION
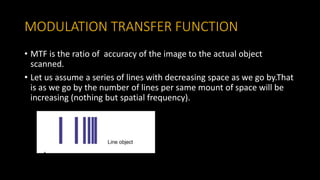
•MTF is the ratio of accuracy of the image to the actual object
scanned.
• Let us assume a series of lines with decreasing space as we go by.That
is as we go by the number of lines per same mount of space will be
increasing (nothing but spatial frequency).
10.
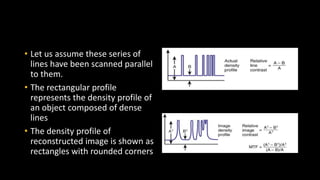
• Let usassume these series of
lines have been scanned parallel
to them.
• The rectangular profile
represents the density profile of
an object composed of dense
lines
• The density profile of
reconstructed image is shown as
rectangles with rounded corners
11.
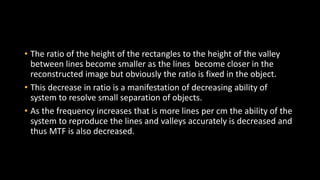
• The ratioof the height of the rectangles to the height of the valley
between lines become smaller as the lines become closer in the
reconstructed image but obviously the ratio is fixed in the object.
• This decrease in ratio is a manifestation of decreasing ability of
system to resolve small separation of objects.
• As the frequency increases that is more lines per cm the ability of the
system to reproduce the lines and valleys accurately is decreased and
thus MTF is also decreased.
13.
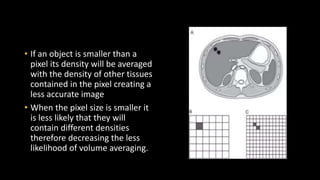
• If anobject is smaller than a
pixel its density will be averaged
with the density of other tissues
contained in the pixel creating a
less accurate image
• When the pixel size is smaller it
is less likely that they will
contain different densities
therefore decreasing the less
likelihood of volume averaging.
14.
NYQUIST SAMPLING THEOREM
•Because an object may not entirely lie
within a pixel ,so the pixel size should
be half the size of the object to
increase the likelihood of object being
resolved.
• In (A),(B),(C) the object to be
displayed is the same as the pixel.The
three figures show different scenarios
as to how the object could be
reconstructed each resulting in a
different level of volume averaging.
• In (D),(E) a smaller pixel size is used
and the scenarios regarding the
likelihood of volume averaging
improve.
21.
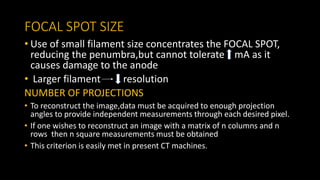
FOCAL SPOT SIZE
•Use of small filament size concentrates the FOCAL SPOT,
reducing the penumbra,but cannot tolerate mA as it
causes damage to the anode
• Larger filament resolution
NUMBER OF PROJECTIONS
• To reconstruct the image,data must be acquired to enough projection
angles to provide independent measurements through each desired pixel.
• If one wishes to reconstruct an image with a matrix of n columns and n
rows then n square measurements must be obtained
• This criterion is easily met in present CT machines.
26.
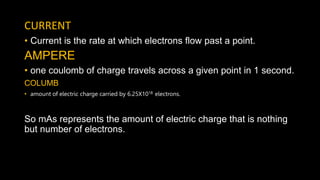
CURRENT
• Current isthe rate at which electrons flow past a point.
AMPERE
• one coulomb of charge travels across a given point in 1 second.
COLUMB
• amount of electric charge carried by 6.25X10¹⁸ electrons.
So mAs represents the amount of electric charge that is nothing
but number of electrons.
27.
VOLTAGE
• Potential differencebetween two points in an electric circuit.
• If we increase potential difference between two points the flow of
electrons is increased from one point to the other.
• So the flow of electrons will have a much higher energy.
• Hence the x rays produced by higher voltage will have higher energy.
28.
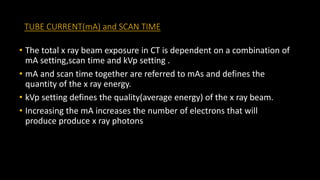
TUBE CURRENT(mA) andSCAN TIME
• The total x ray beam exposure in CT is dependent on a combination of
mA setting,scan time and kVp setting .
• mA and scan time together are referred to mAs and defines the
quantity of the x ray energy.
• kVp setting defines the quality(average energy) of the x ray beam.
• Increasing the mA increases the number of electrons that will
produce produce x ray photons
30.
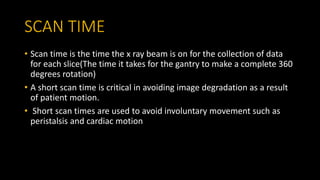
SCAN TIME
• Scantime is the time the x ray beam is on for the collection of data
for each slice(The time it takes for the gantry to make a complete 360
degrees rotation)
• A short scan time is critical in avoiding image degradation as a result
of patient motion.
• Short scan times are used to avoid involuntary movement such as
peristalsis and cardiac motion
31.
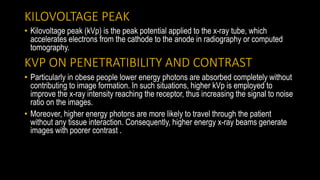
KILOVOLTAGE PEAK
• Kilovoltagepeak (kVp) is the peak potential applied to the x-ray tube, which
accelerates electrons from the cathode to the anode in radiography or computed
tomography.
KVP ON PENETRATIBILITY AND CONTRAST
• Particularly in obese people lower energy photons are absorbed completely without
contributing to image formation. In such situations, higher kVp is employed to
improve the x-ray intensity reaching the receptor, thus increasing the signal to noise
ratio on the images.
• Moreover, higher energy photons are more likely to travel through the patient
without any tissue interaction. Consequently, higher energy x-ray beams generate
images with poorer contrast .
32.
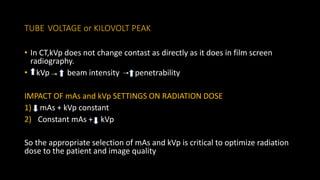
TUBE VOLTAGE orKILOVOLT PEAK
• In CT,kVp does not change contast as directly as it does in film screen
radiography.
• kVp beam intensity penetrability
IMPACT OF mAs and kVp SETTINGS ON RADIATION DOSE
1) mAs + kVp constant
2) Constant mAs + kVp
So the appropriate selection of mAs and kVp is critical to optimize radiation
dose to the patient and image quality
33.
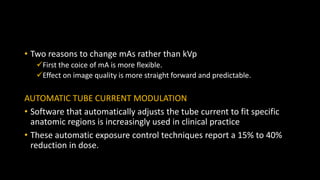
• Two reasonsto change mAs rather than kVp
First the coice of mA is more flexible.
Effect on image quality is more straight forward and predictable.
AUTOMATIC TUBE CURRENT MODULATION
• Software that automatically adjusts the tube current to fit specific
anatomic regions is increasingly used in clinical practice
• These automatic exposure control techniques report a 15% to 40%
reduction in dose.
34.
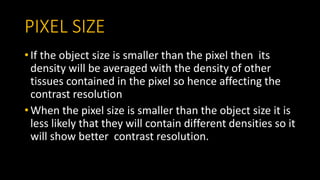
PIXEL SIZE
• Ifthe object size is smaller than the pixel then its
density will be averaged with the density of other
tissues contained in the pixel so hence affecting the
contrast resolution
• When the pixel size is smaller than the object size it is
less likely that they will contain different densities so it
will show better contrast resolution.
37.
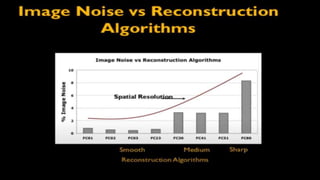
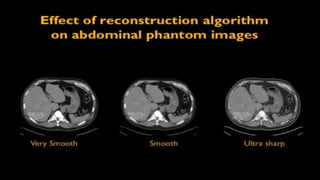
• The appropriatereconstruction algorithm depends on which parts of
the data should be enhanced or suppressed to optimize the image for
diagnosis.
• For example – the temporal bone in which tiny of inner ear are
displayed the image can be reconstructed for spatial rather than
contrast fidelity.
42.
• QUESTION
Given hereare two graphs of MTF
with increasing spatial frequencies
of two CT scanner which scanner
has got better spatial resolution?
43.
• QUESTION
Given hereare two graphs of MTF
with increasing spatial frequencies
of two CT scanner which scanner
has got better spatial resolution?
Editor's Notes
#3 Under CT image quality 2 topics which I am going to discuss are spatial resolution and contrast resolution
These 2 are important iamge quality parameters
And we are going to discuss various factors which are going to affect these two important parameters
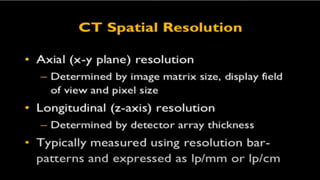
#4 In CT spatial resolution can be examined in 2 different ways
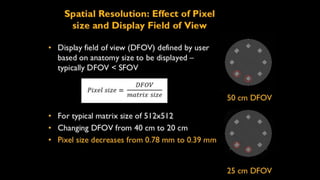
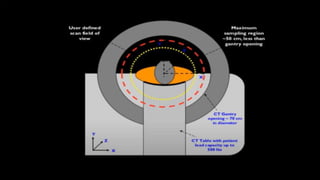
#6 Normal gantry diameter is around 70 cm
Maximum sampling region is around 50 cm
So the user defined scan field of view can go all the way upto sampling region but cant go beyond that
The user defined scan field of view is selected by the user depending on the body part to be scanned
This ultimately influences how the images are displayed called as display field of view
#8 DFOV can not be larger than the scan field of view
The axial spatial resolution is influenced by pixel size and display field of view
Smaller the pixel size better is the spatial resolution
Spatial resolution reconstructed at 2 different display field of view
This discussion is about axial spatial resolution
#9 Normal gantry diameter is around 70 cm
Maximum sampling region is around 50 cm
So the user defined scan field of view can go all the way upto sampling region but cant go beyond that
The user defined scan field of view is selected by the user depending on the body part to be scanned
This ultimately influences how the images are displayed called as display field of view
#10 Modulation transfer function is the ability of a ct scanner how accuirately it can represent different spatial frequencies
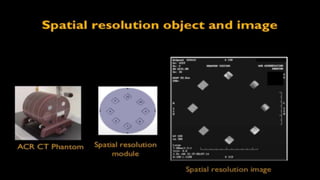
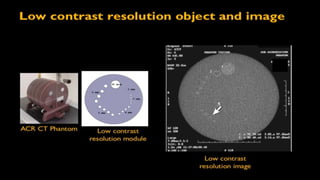
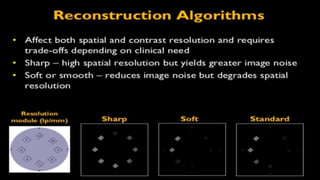
#13 Phantoms are used to evaluate various image quality factors
It contains different modules
One of the module has embeeded spatial reolution pattrens by scanning these pattern one can visually inspect the capability of imaging system what is the resolution it can resolve
#16 Focal spot size of the x ray tube
Number of projections used
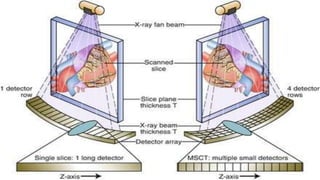
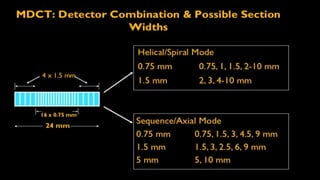
#18 Here is an example of multidetector 16 slice CT
The possible configuration of detector combination and possible slice width
In this particular ct machine user can acquire the data either 4 by 1.5mm slices or 16 of 0.75mm slices
If were acquiring at a thinner slices one can reconstruct images of various slice thickness of 0.75,,1,1.5,2-10mm by combining the data of various detector elements
Secondly if data is acquired by 4 by 1.5mm slice thickness can be reconstructed into 1.5,2,3,4-10 mm
One rule of thumb is like reconstructed slice thickness can not be smaller than the acquired slice thickness
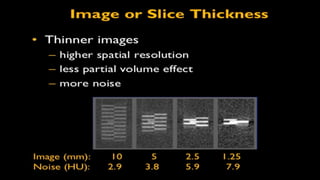
#19 That is the reason why we tried to get thinner and thinner detector size because thinner the acquisition we have the more possibility to reconstruct into thinner or thicker slices
The thinner slices images have
#20 Image noise can be decreased by reconstructing into thicker slices
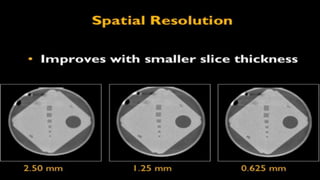
#21 Another images showing that in thinner slices spatial resolution is way better
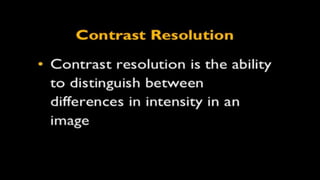
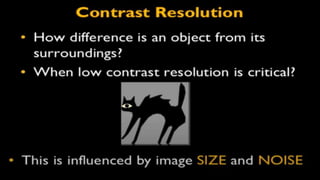
#24 the object becomes more clear and visible when the difference between the onject and the background becomes larger
Contrast resolution is influenced by size of object and image noise in the background
#25 It is a phantom ,showing contrast resolution is better as the size of the object increases
Here we can also see that as the noise in this image is more comparatively the contrast resolution is less overall.
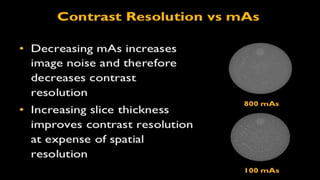
#30 less photons are used for creating the image hence the image noise is greater therefore it diminishes the contrast resolution
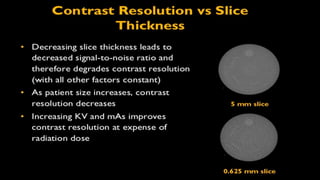
#36 Because at 0.625 mm slice less photons are used for creating the image the image noise is greater therefore it diminishes the contrast resolution
However if it is reconstructed at 5 mm slice thickness more no of photons are contributing for the image so the noise is lesser and contrast resolution is better
As the patient size increases there is lot of noise so contrast resolution decreases
#41 Reconstruction interval - the spacing between adjacent slices
The effect of reconstruction interval does not effect the axial spatial resolution however longitudinal reconstruction such as saggital and coronal reconstruction the reconstruction interval plays a significant role
If the reconstruction interval is higher the spatial resolution is lesser
Again the effect of reconstruction interval was significant in the past when computing power was less and it would take longer time to reconstruct
Howeever withthge faster computing systems this is irrelevant as one can reconstruct withnwhatever reconstruction interval with very rapid pace