Chapter 9 -1
ISSUES TO ADDRESS...
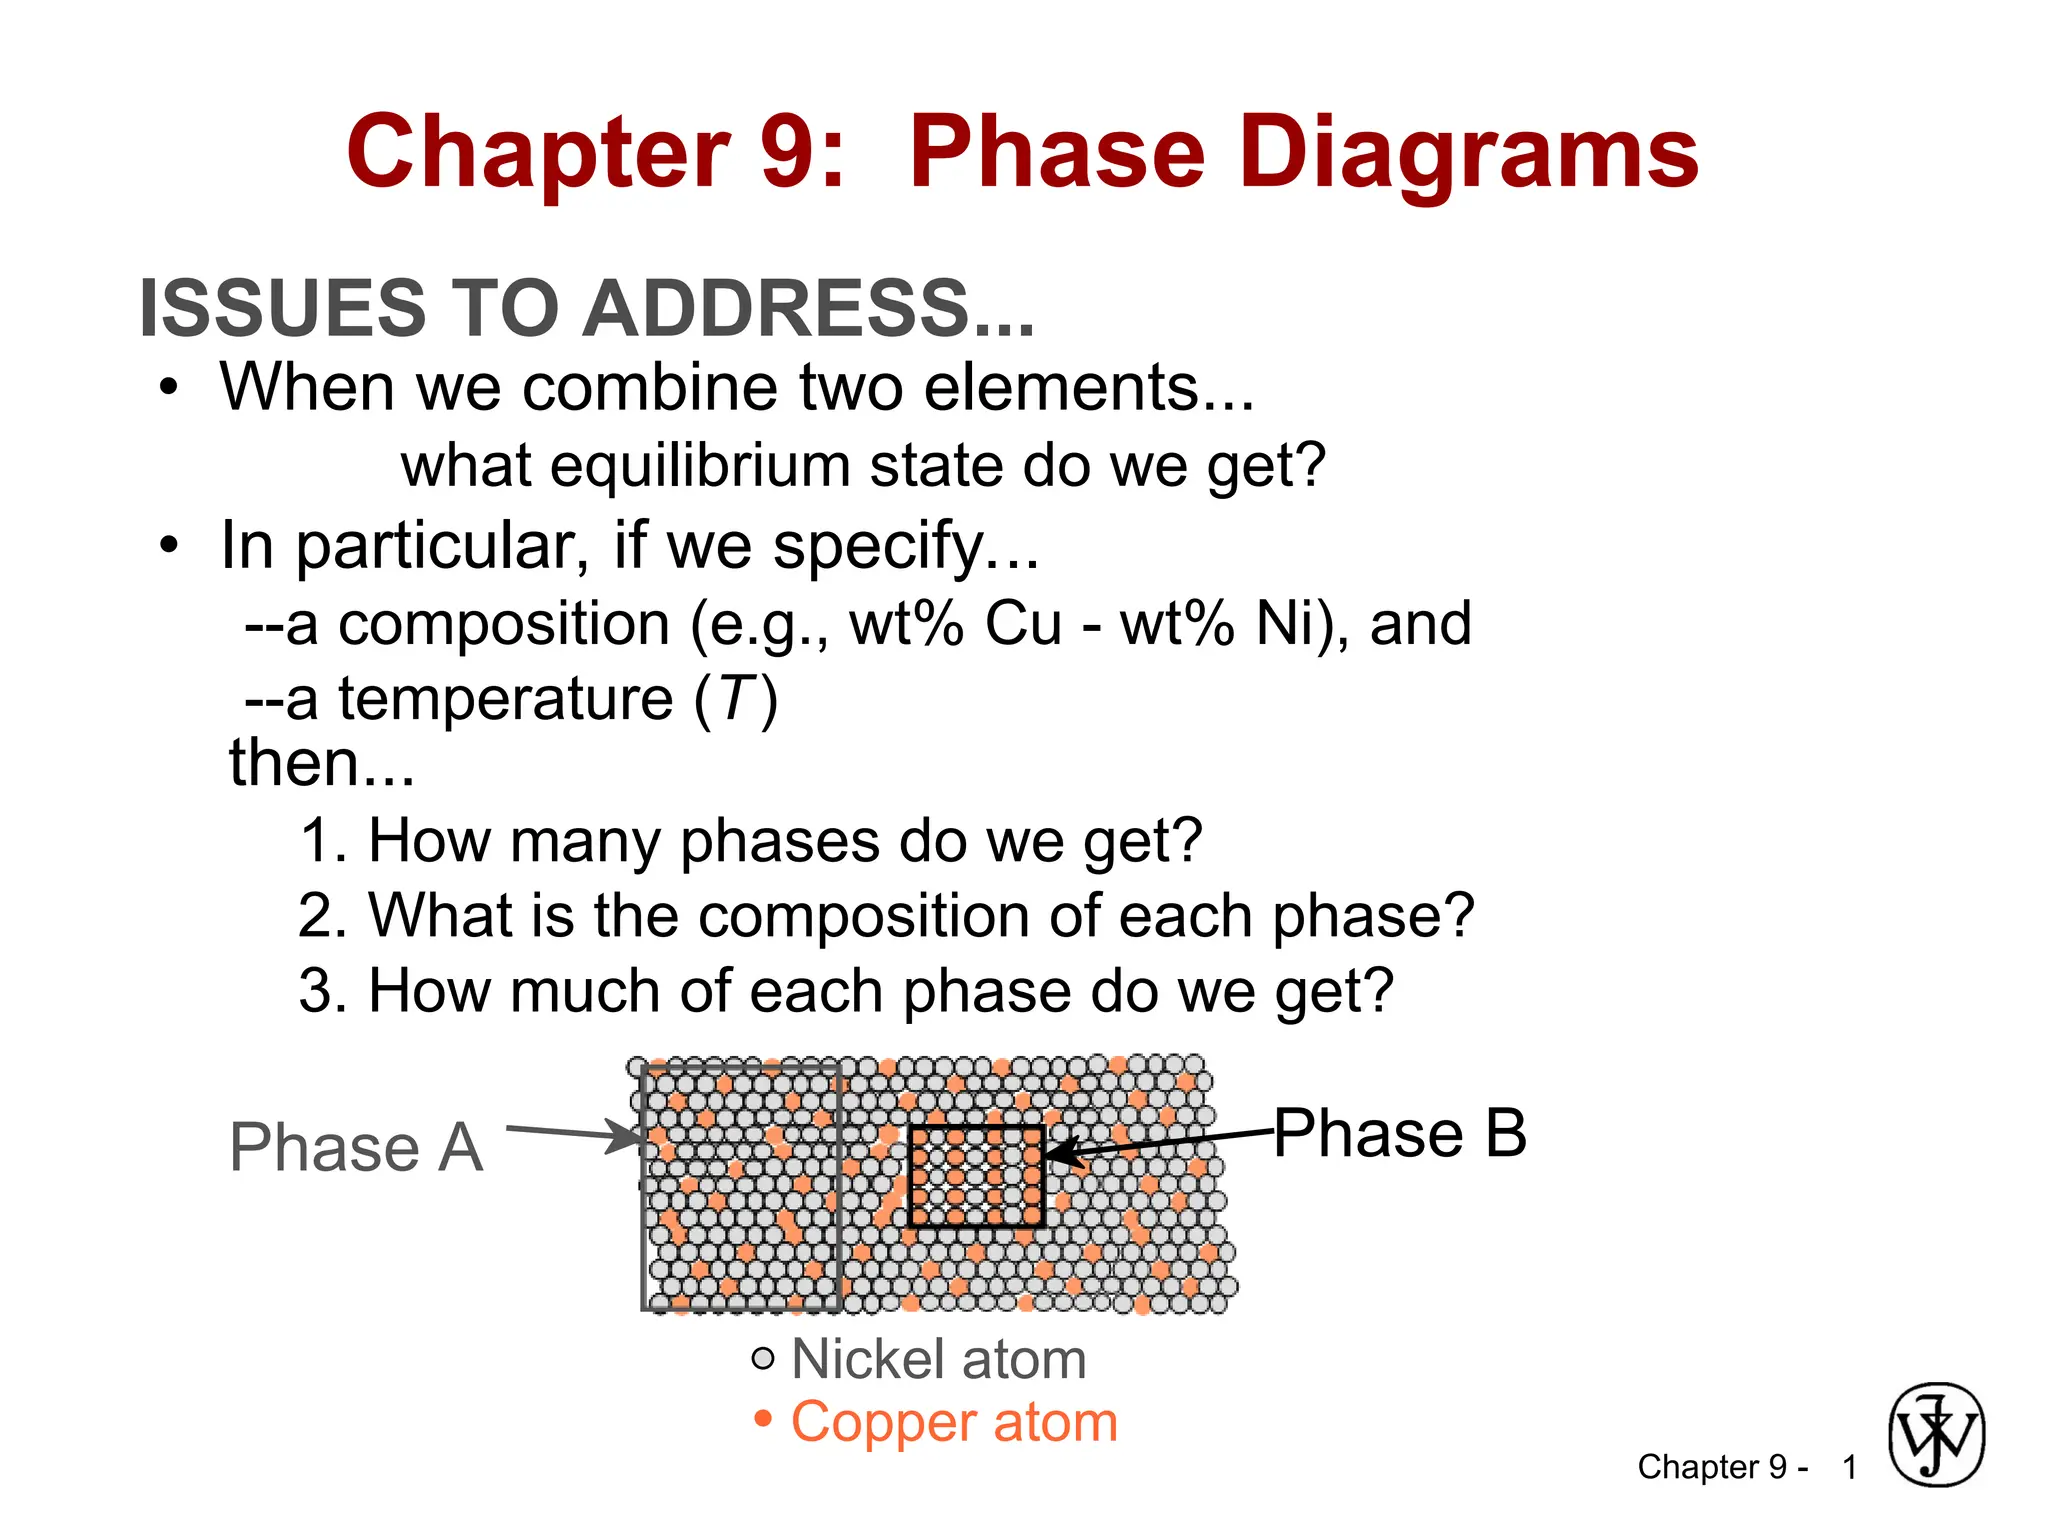
• When we combine two elements...
what equilibrium state do we get?
• In particular, if we specify...
--a composition (e.g., wt% Cu - wt% Ni), and
--a temperature (T)
then...
1. How many phases do we get?
2. What is the composition of each phase?
3. How much of each phase do we get?
Chapter 9: Phase Diagrams
Phase B
Phase A
Nickel atom
Copper atom
2.
Chapter 9 -2
Definitions:
Components are pure metals and/or compounds of which
an alloy is composed. For example, in a copper–zinc brass,
the components are Cu and Zn.
System it may relate to the series of possible alloys
consisting of the same components, (e.g., the iron–carbon
system).
Solid solution consists of atoms of at least two different
types; the solute atoms occupy either substitutional or
interstitial positions in the solvent lattice, and the crystal
structure of the solvent is maintained.
Mixtures is a systems composed of two or more phases or
‘‘heterogeneous systems. Most metallic alloys, ceramic,
polymeric, and composite systems are heterogeneous.
3.
Chapter 9 -3
Phase: is defined as a homogeneous portion of a system
that has uniform physical and chemical characteristics. Every
pure material is considered to be a phase; so also is every
solid, liquid, and gaseous solution.
For example, the sugar–water syrup solution Each has
different physical properties (one is a liquid, the other is a
solid); furthermore, each is different chemically (i.e., has a
different chemical composition); one is virtually pure sugar,
the other is a solution of H2O
If more than one phase is present in a given system, each
will have its own distinct properties, and a boundary
separating the phases will exist across which there will be a
discontinuous and abrupt change in physical and/or chemical
characteristics
When two phases are present in a system, it is not
necessary that there be a difference in both physical and
chemical properties; a disparity in one or the other set of
properties is sufficient. Ex. water and ice
4.
Chapter 9 -
•Heterogeneous Mixtures
are composed of two or more components that are:
unequally (not uniformly) distributed though out the
system, immiscible (won't dissolve), may be of
different phase, unable to disperse through most
membranes, and separable by mechanical means.
There are probably more possibilities for this type of
mixture than the first.
•
4
5.
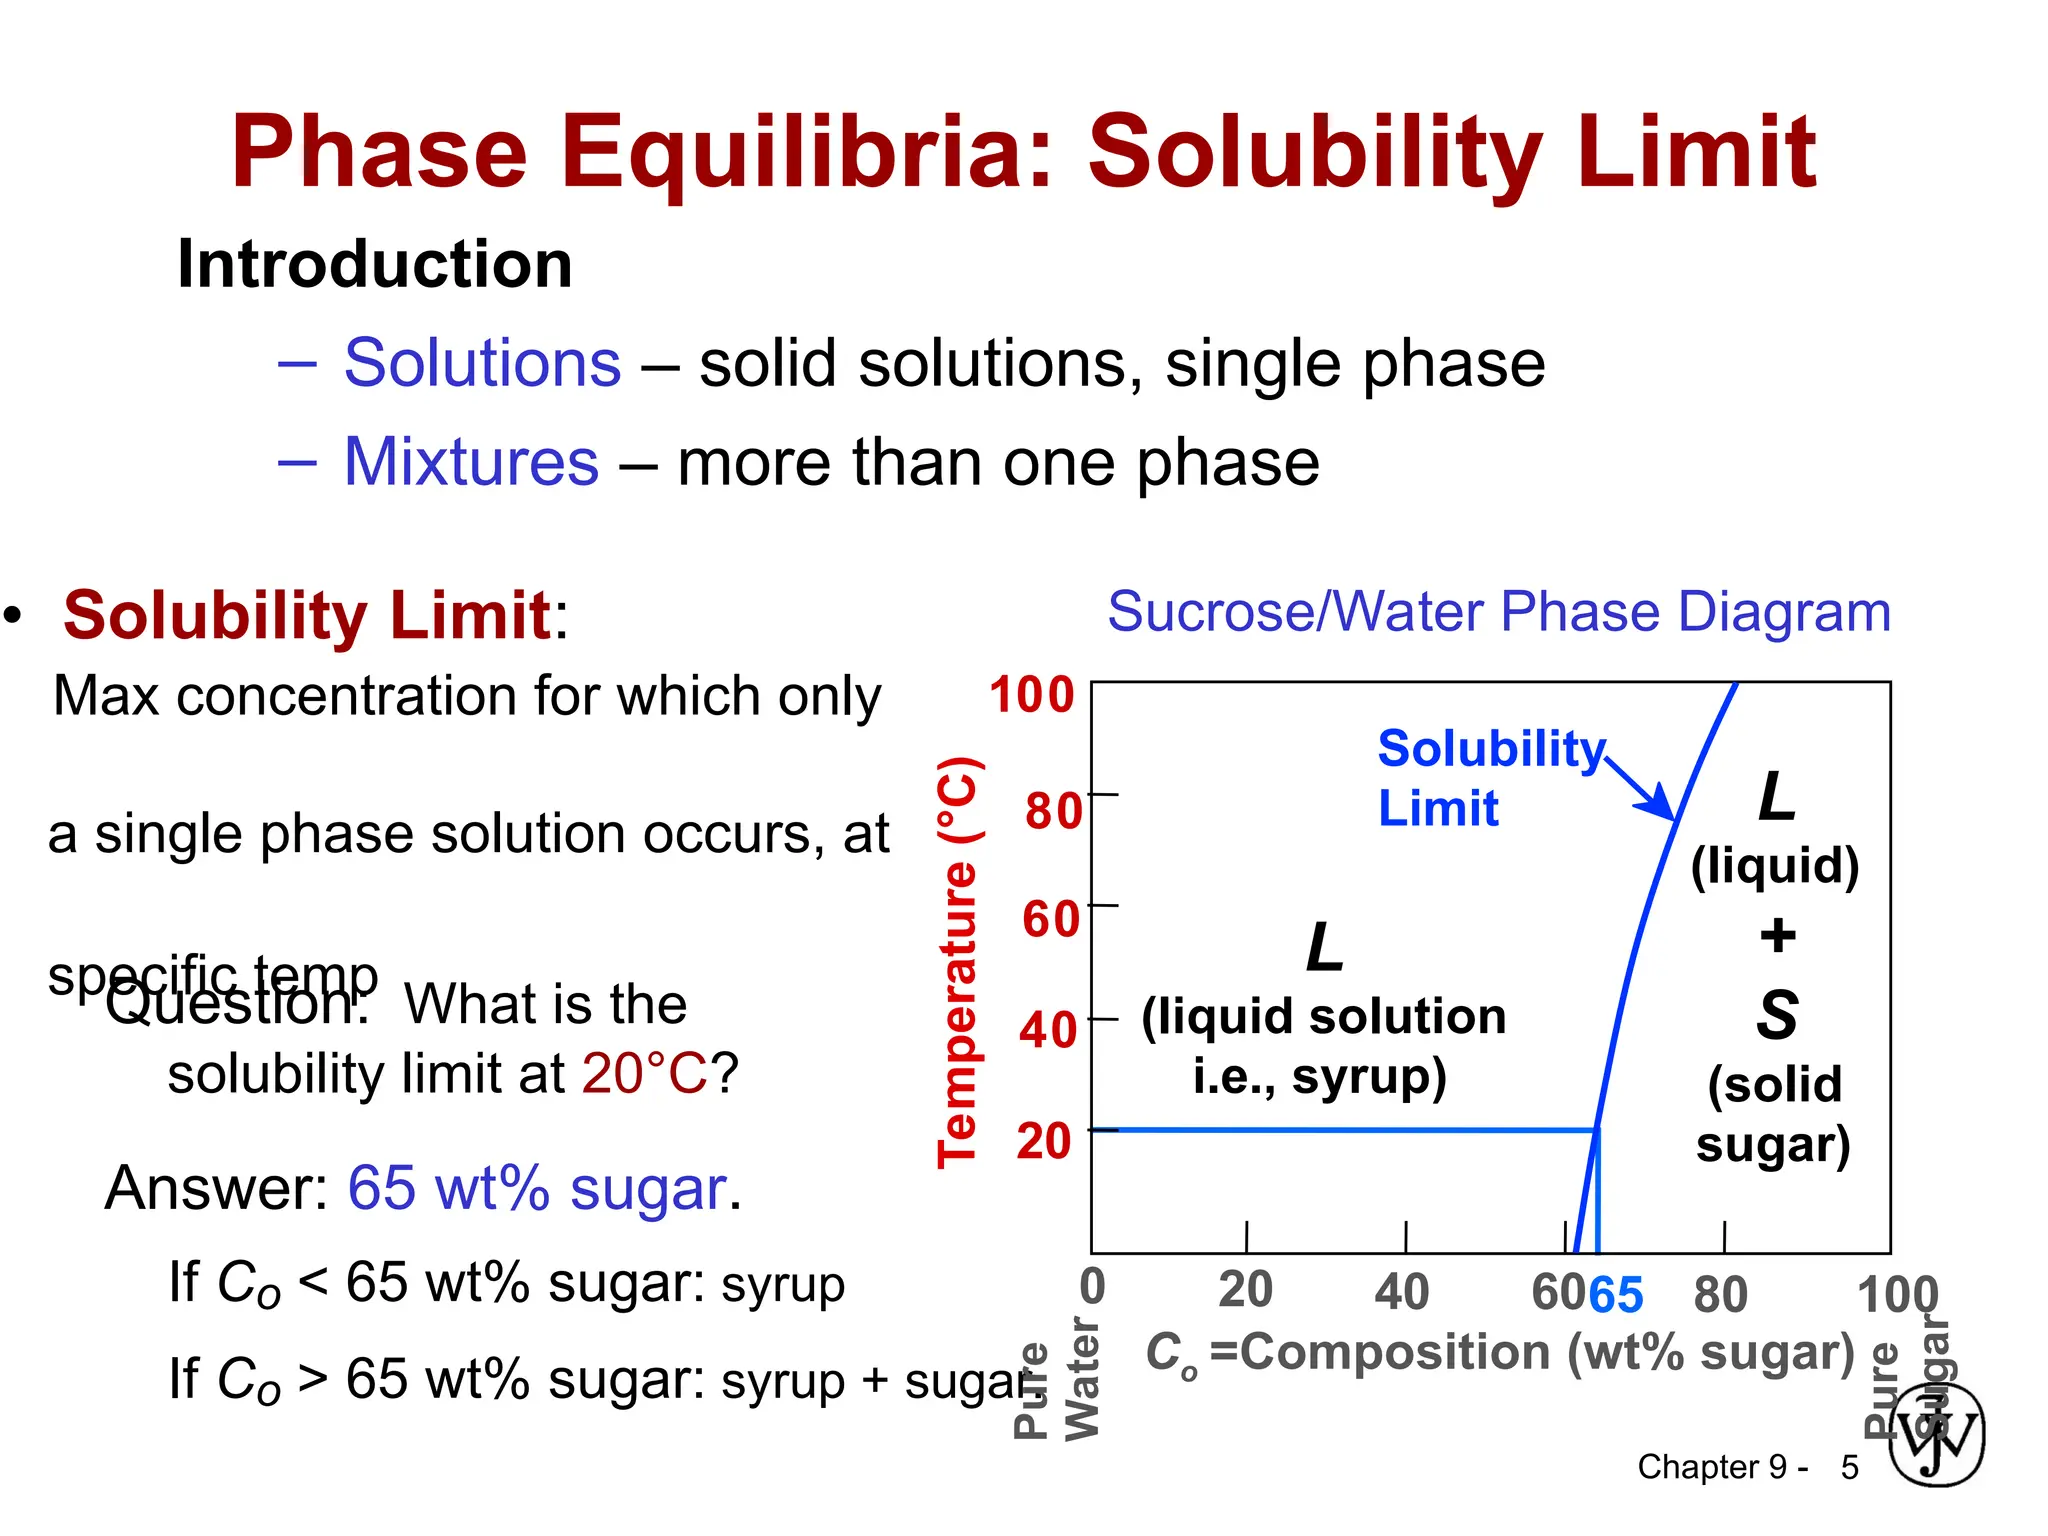
Chapter 9 -5
Phase Equilibria: Solubility Limit
Introduction
– Solutions – solid solutions, single phase
– Mixtures – more than one phase
• Solubility Limit:
Max concentration for which only
a single phase solution occurs, at
specific temp
Question: What is the
solubility limit at 20°C?
Answer: 65 wt% sugar.
If Co < 65 wt% sugar: syrup
If Co > 65 wt% sugar: syrup + sugar.
65
Sucrose/Water Phase Diagram
Pure
Sugar
Temperature
(°C)
0 20 40 60 80 100
Co =Composition (wt% sugar)
L
(liquid solution
i.e., syrup)
Solubility
Limit L
(liquid)
+
S
(solid
sugar)
20
40
60
80
100
Pure
Water
6.
Chapter 9 -6
The addition of solute in excess of this solubility
limit results in the formation of another solid
solution or compound that has a clearly different
composition. To illustrate this concept, consider the
sugar–water (C12H22O11–H2O) system.
This solubility limit of sugar in water depends on the
temperature of the water
7.
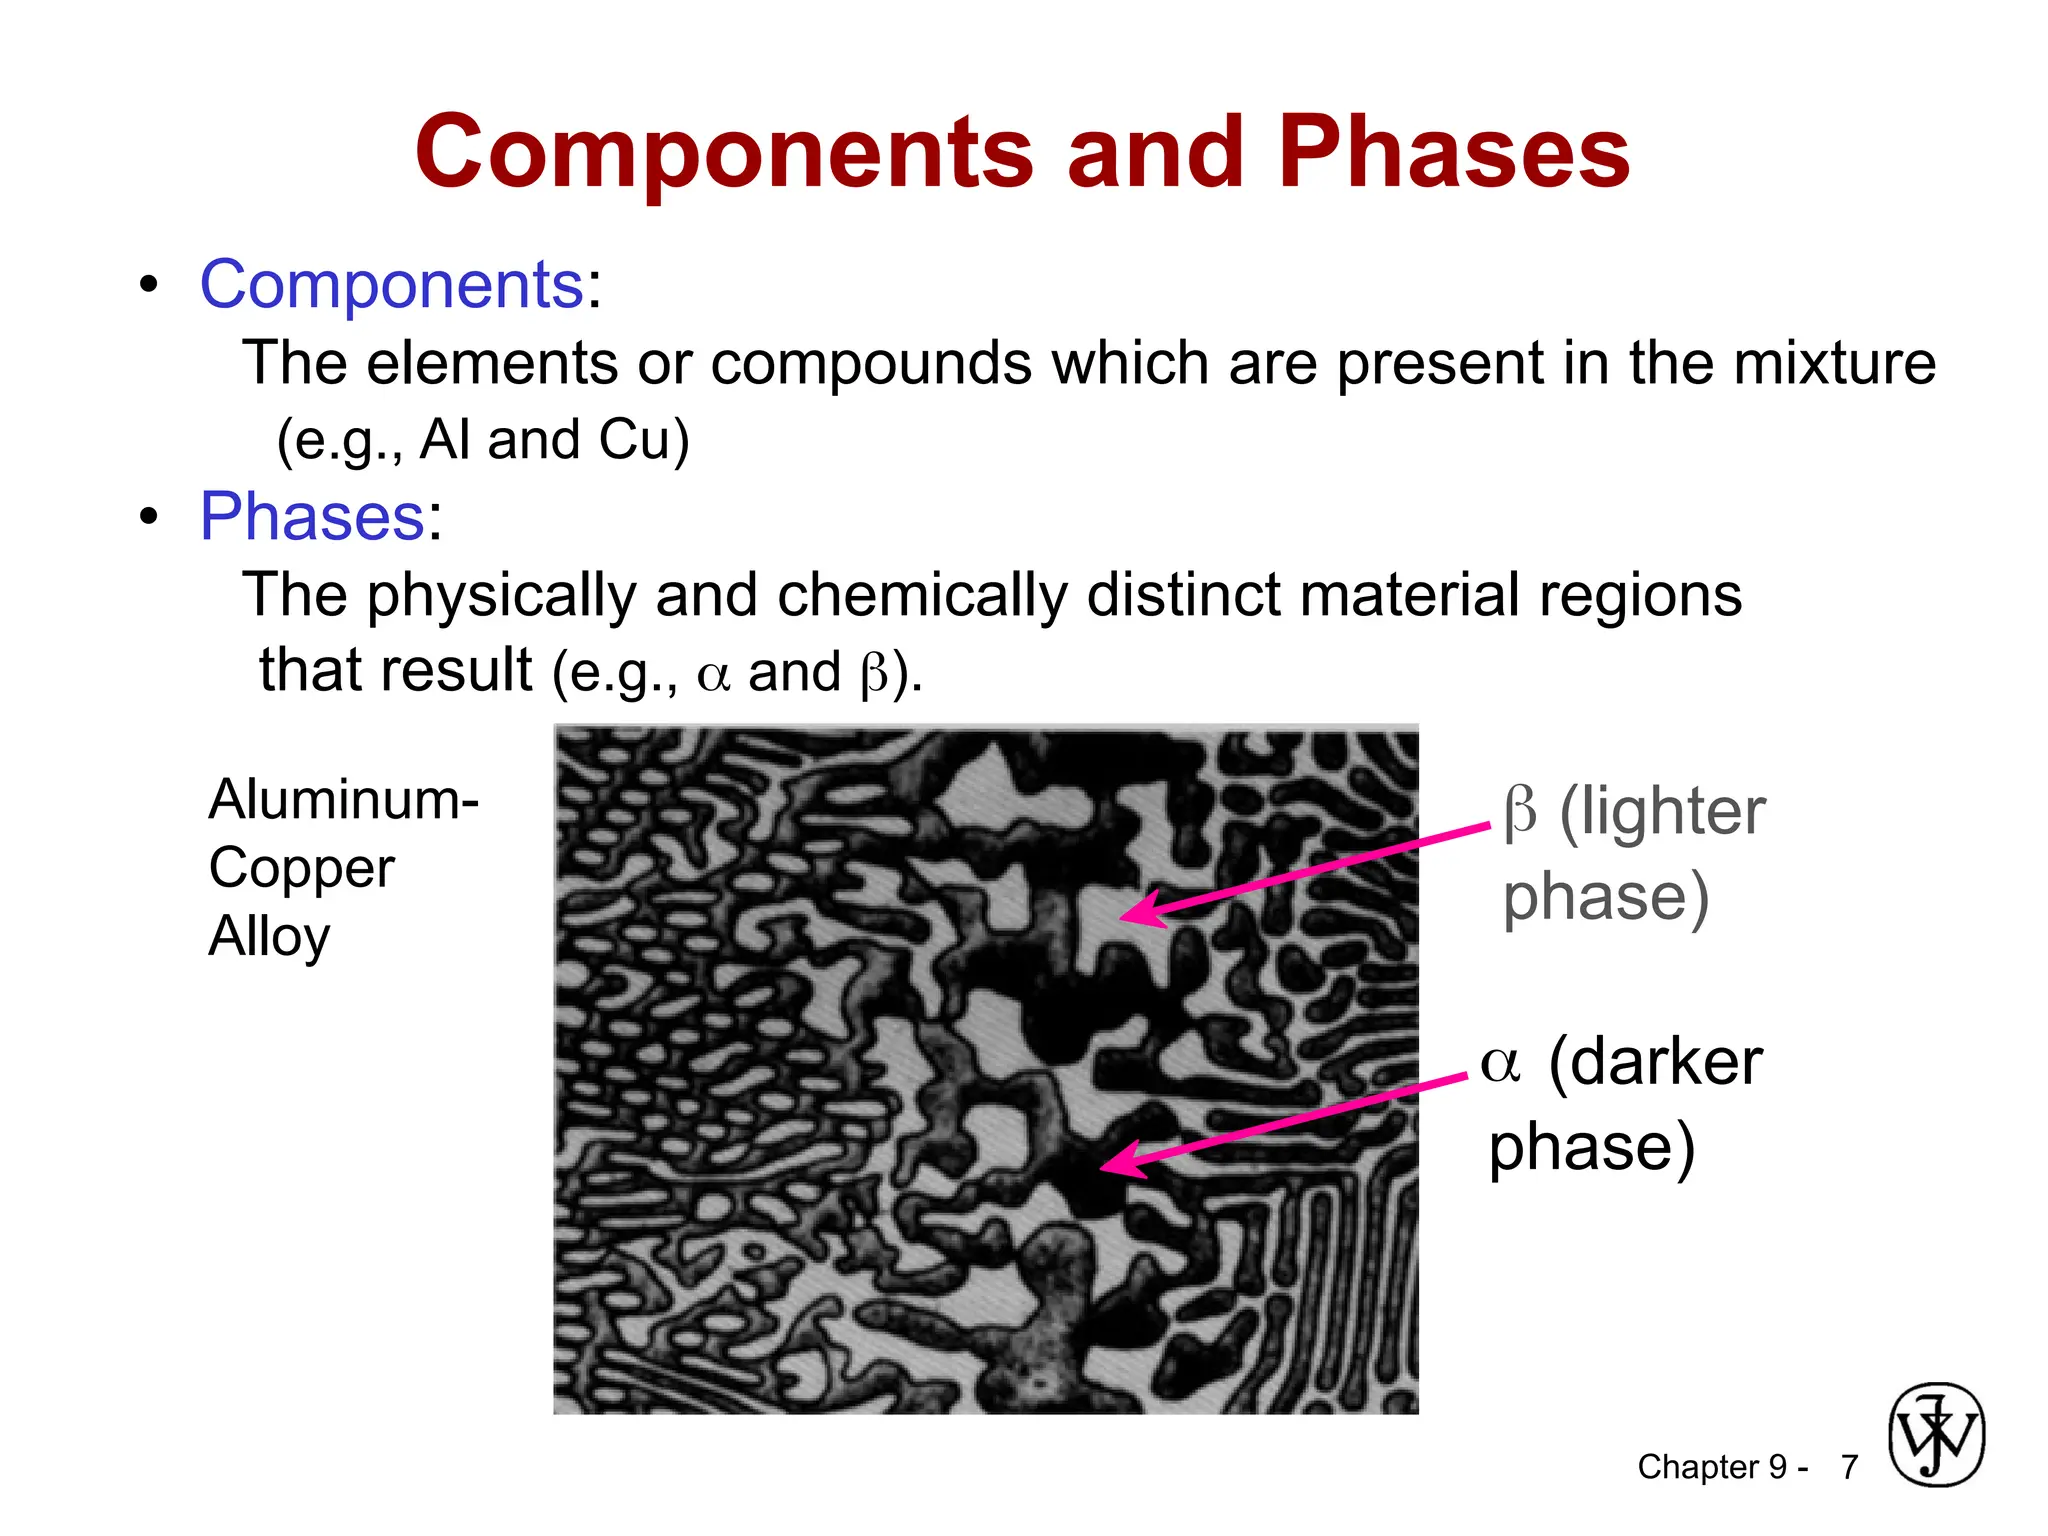
Chapter 9 -7
• Components:
The elements or compounds which are present in the mixture
(e.g., Al and Cu)
• Phases:
The physically and chemically distinct material regions
that result (e.g., and ).
Aluminum-
Copper
Alloy
Components and Phases
(darker
phase)
(lighter
phase)
8.
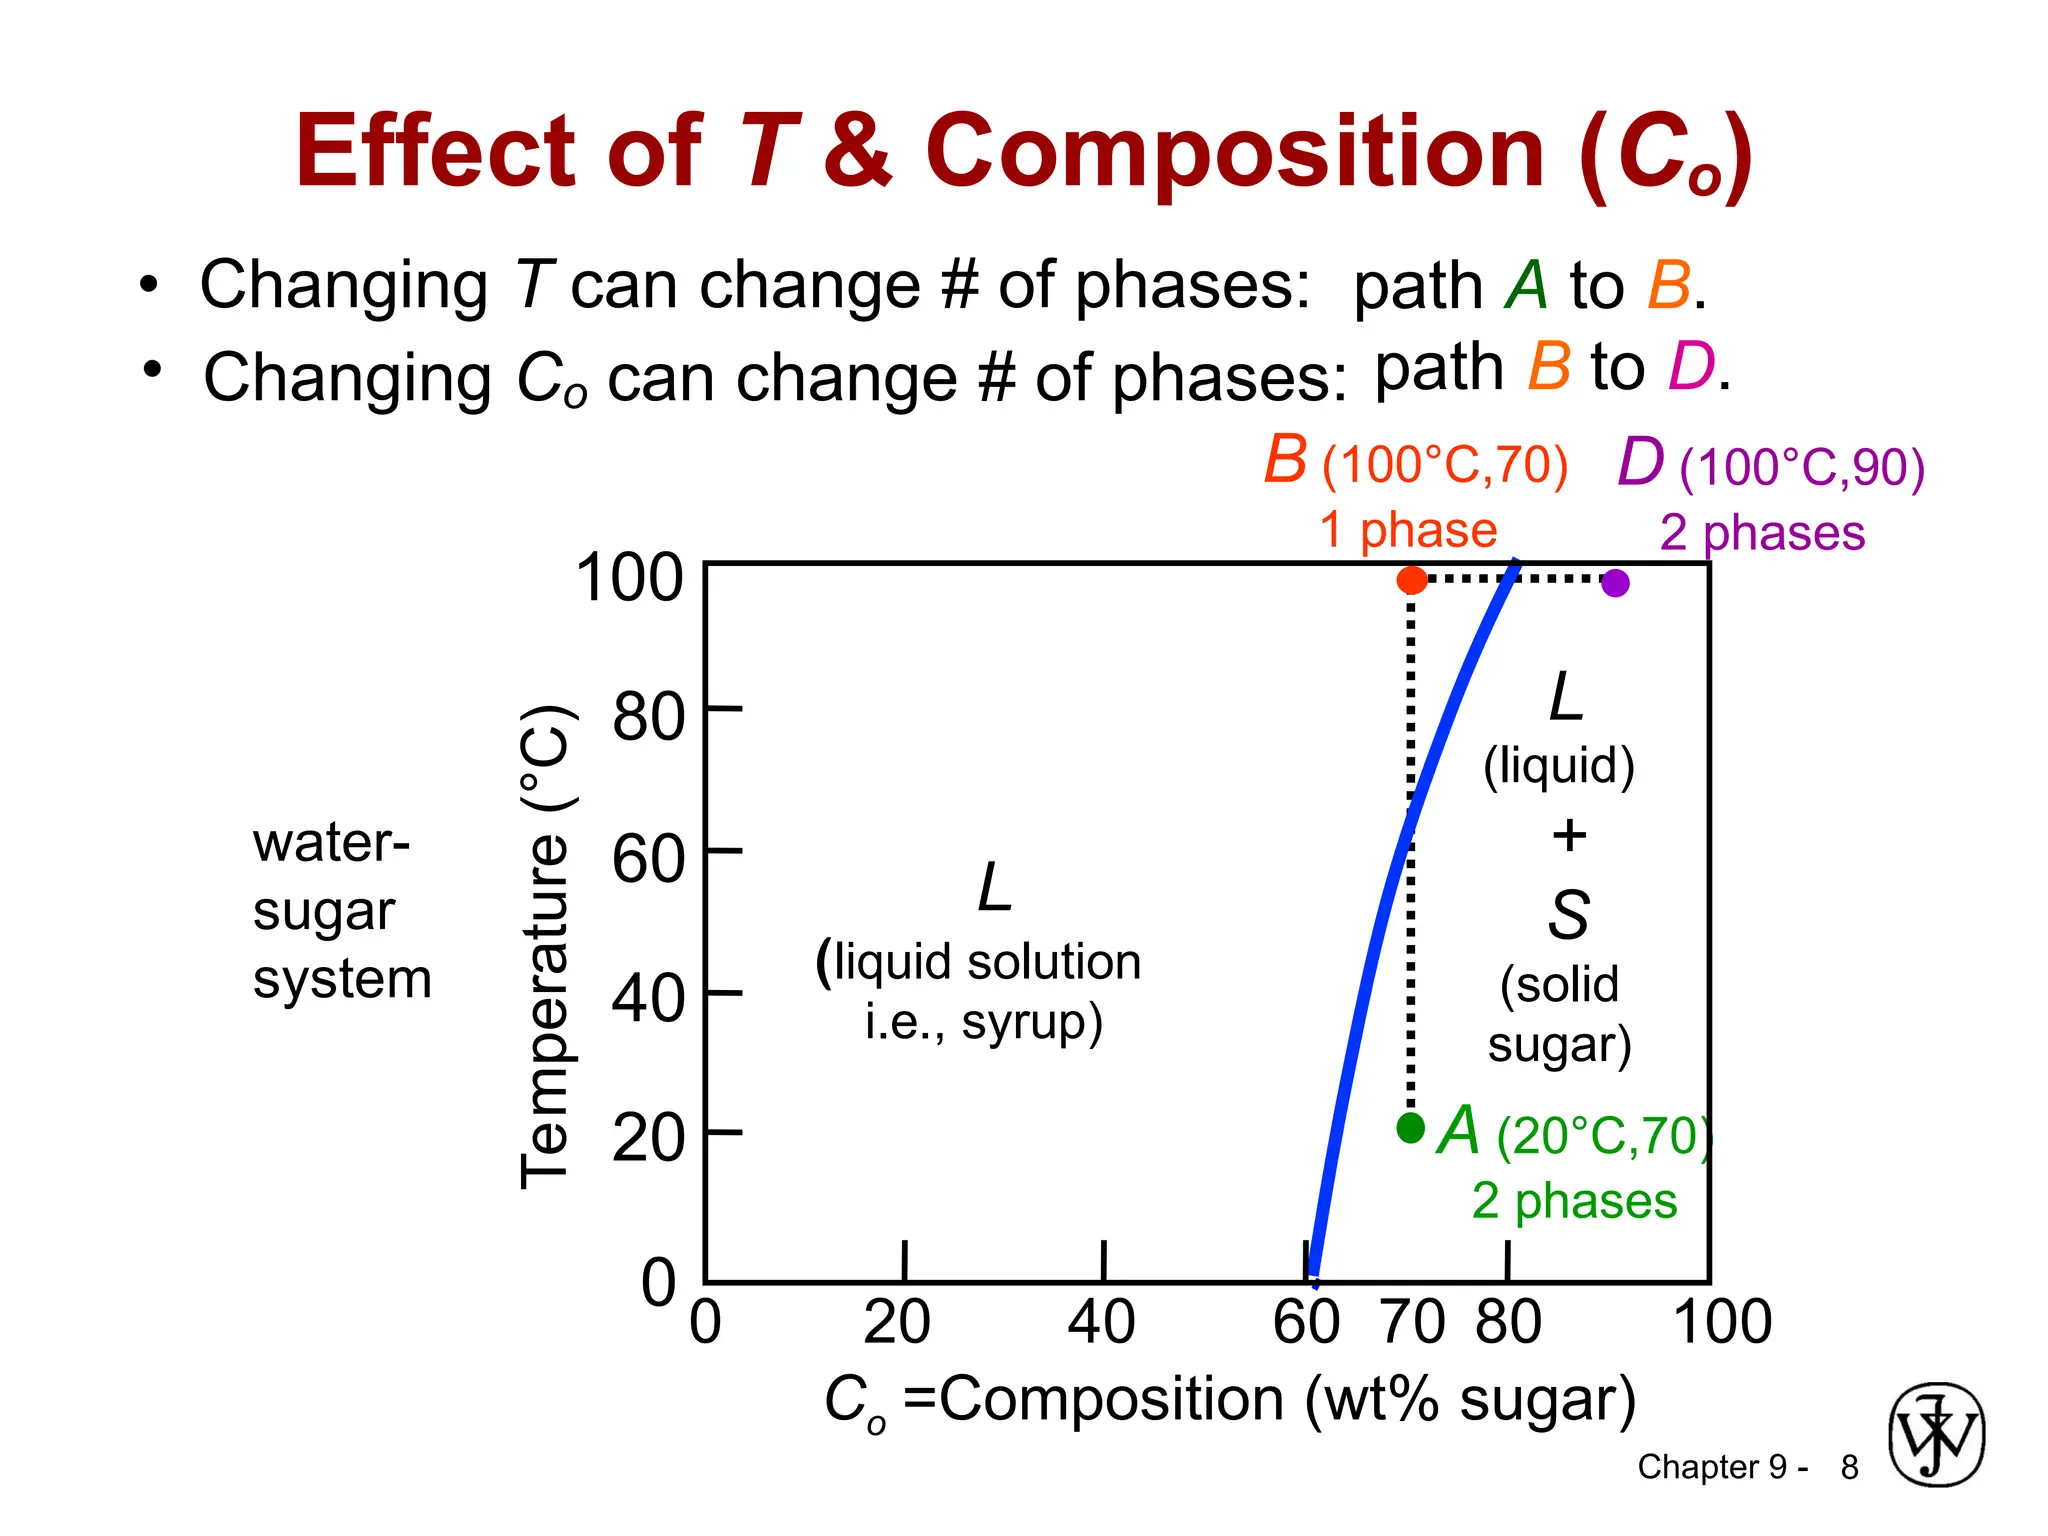
Chapter 9 -8
Effect of T & Composition (Co)
• Changing T can change # of phases:
D (100°C,90)
2 phases
B (100°C,70)
1 phase
path A to B.
• Changing Co can change # of phases: path B to D.
A (20°C,70)
2 phases
70 80 100
60
40
20
0
Temperature
(°C)
Co =Composition (wt% sugar)
L
(liquid solution
i.e., syrup)
20
100
40
60
80
0
L
(liquid)
+
S
(solid
sugar)
water-
sugar
system
9.
Chapter 9 -
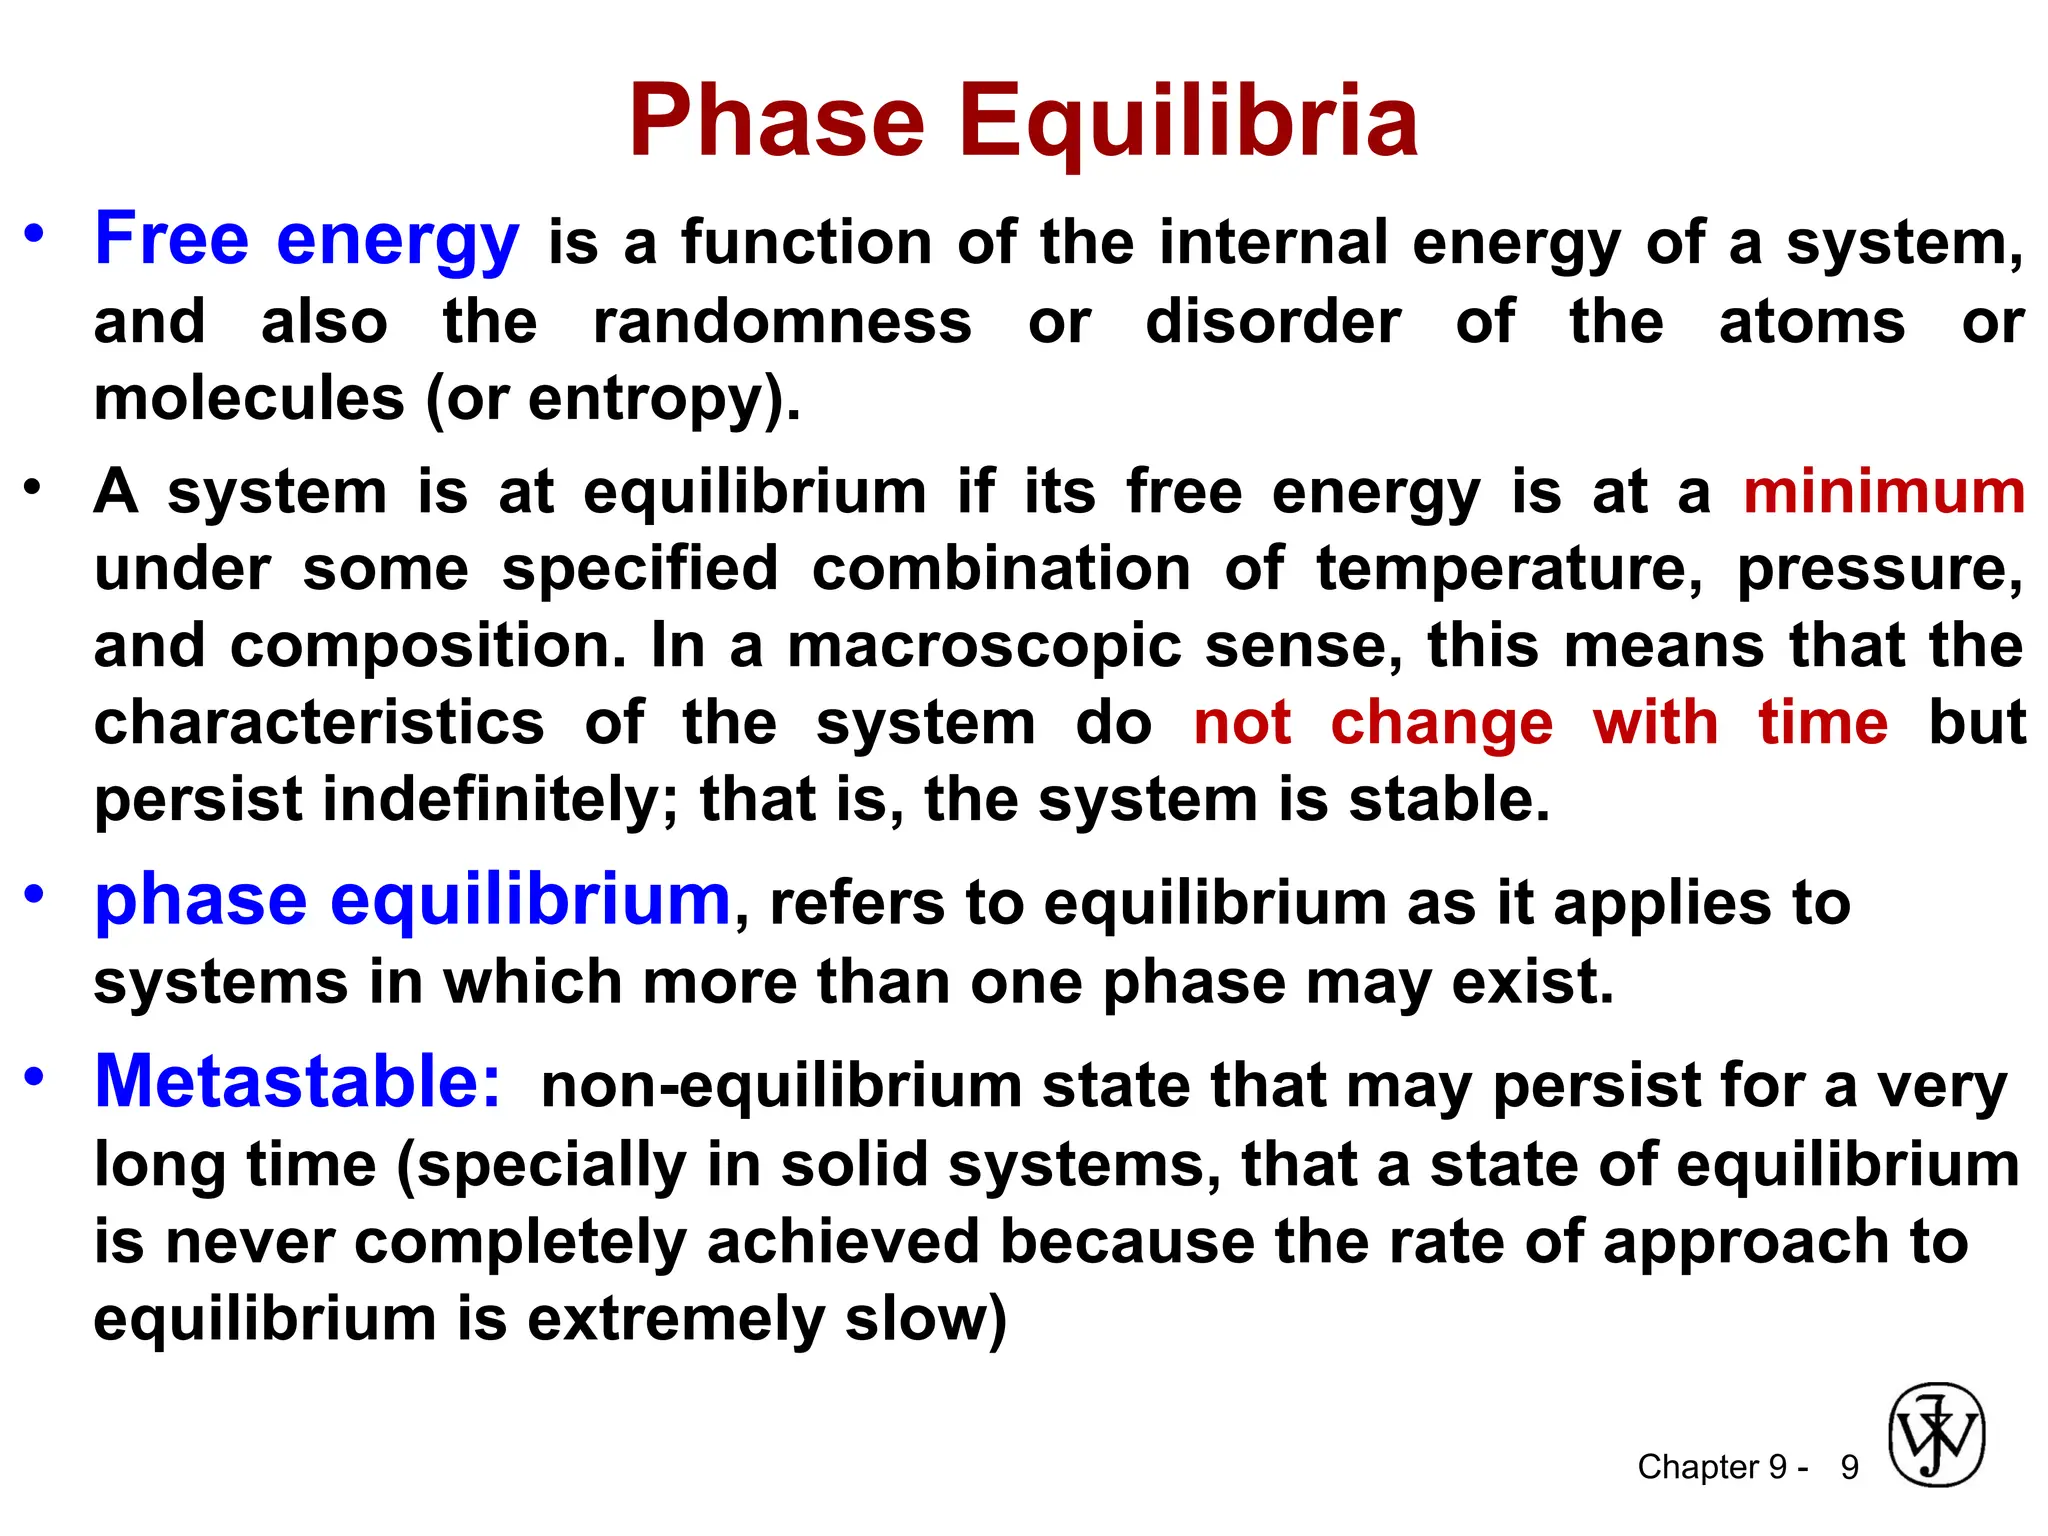
PhaseEquilibria
• Free energy is a function of the internal energy of a system,
and also the randomness or disorder of the atoms or
molecules (or entropy).
• A system is at equilibrium if its free energy is at a minimum
under some specified combination of temperature, pressure,
and composition. In a macroscopic sense, this means that the
characteristics of the system do not change with time but
persist indefinitely; that is, the system is stable.
• phase equilibrium, refers to equilibrium as it applies to
systems in which more than one phase may exist.
• Metastable: non-equilibrium state that may persist for a very
long time (specially in solid systems, that a state of equilibrium
is never completely achieved because the rate of approach to
equilibrium is extremely slow)
9
10.
Chapter 9 -10
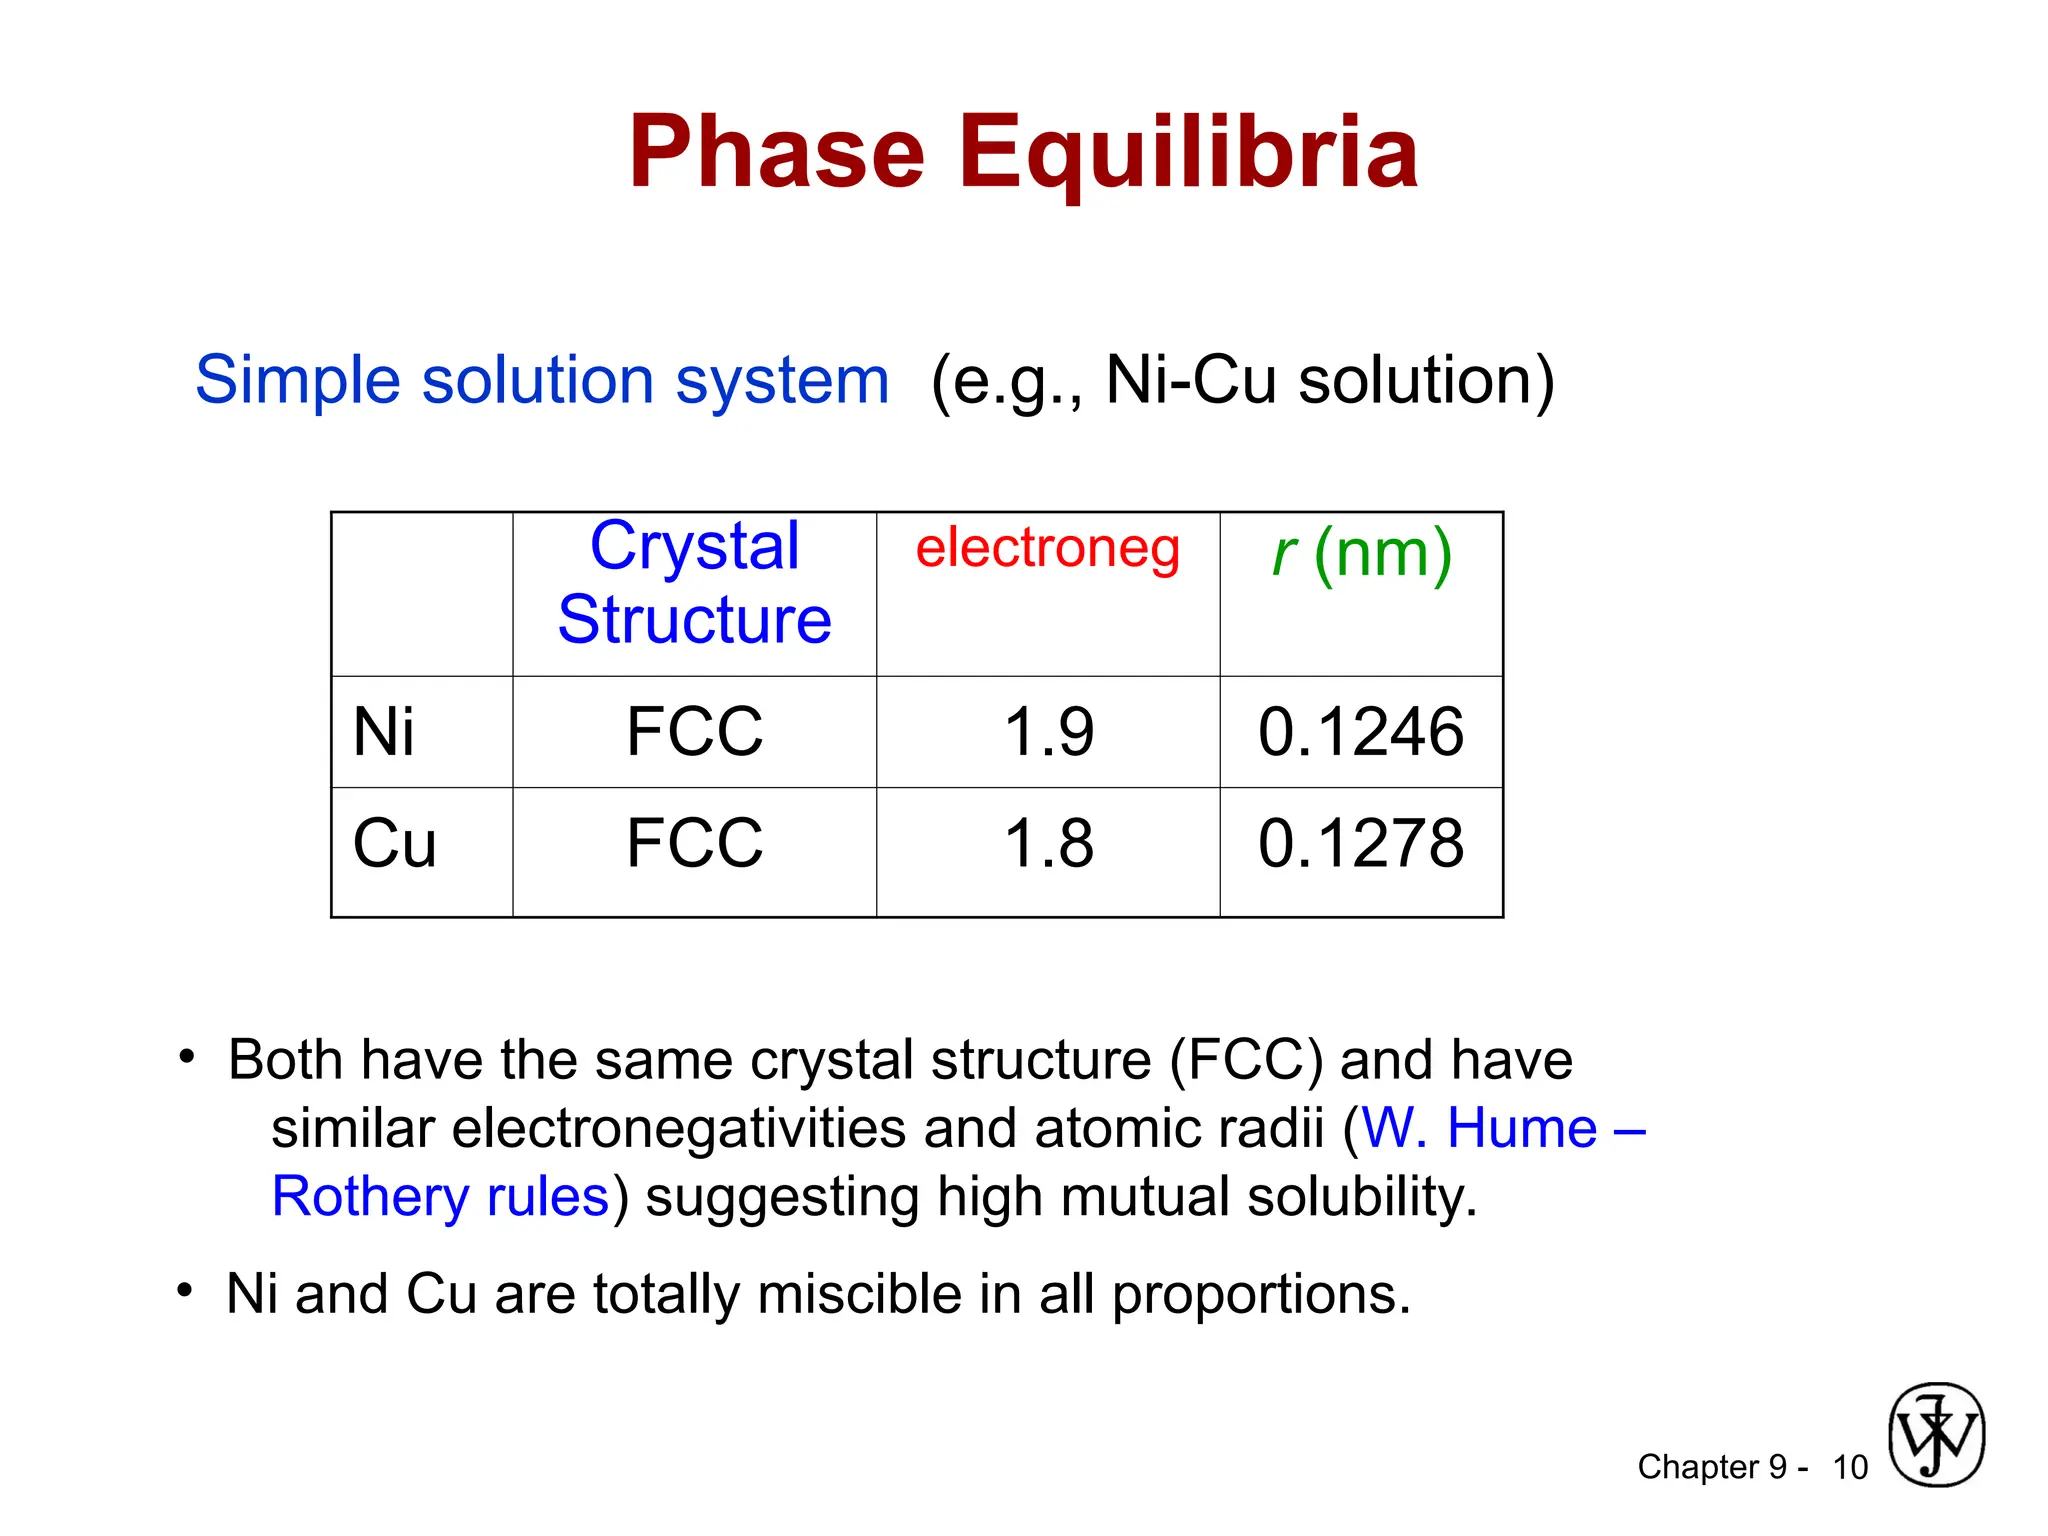
Phase Equilibria
Crystal
Structure
electroneg r (nm)
Ni FCC 1.9 0.1246
Cu FCC 1.8 0.1278
• Both have the same crystal structure (FCC) and have
similar electronegativities and atomic radii (W. Hume –
Rothery rules) suggesting high mutual solubility.
Simple solution system (e.g., Ni-Cu solution)
• Ni and Cu are totally miscible in all proportions.
11.
Chapter 9 -
PhaseDiagrams
•Phase diagram gives information about the control
of microstructure or phase structure of a particular
alloy system is conveniently and concisely
displayed (equilibrium or constitutional diagram)
•There are three externally controllable parameters
that will affect phase structure – temperature,
pressure, and composition – and phase diagram are
constructed when combinations of these
parameters are plotted against one another
11
12.
Chapter 9 -
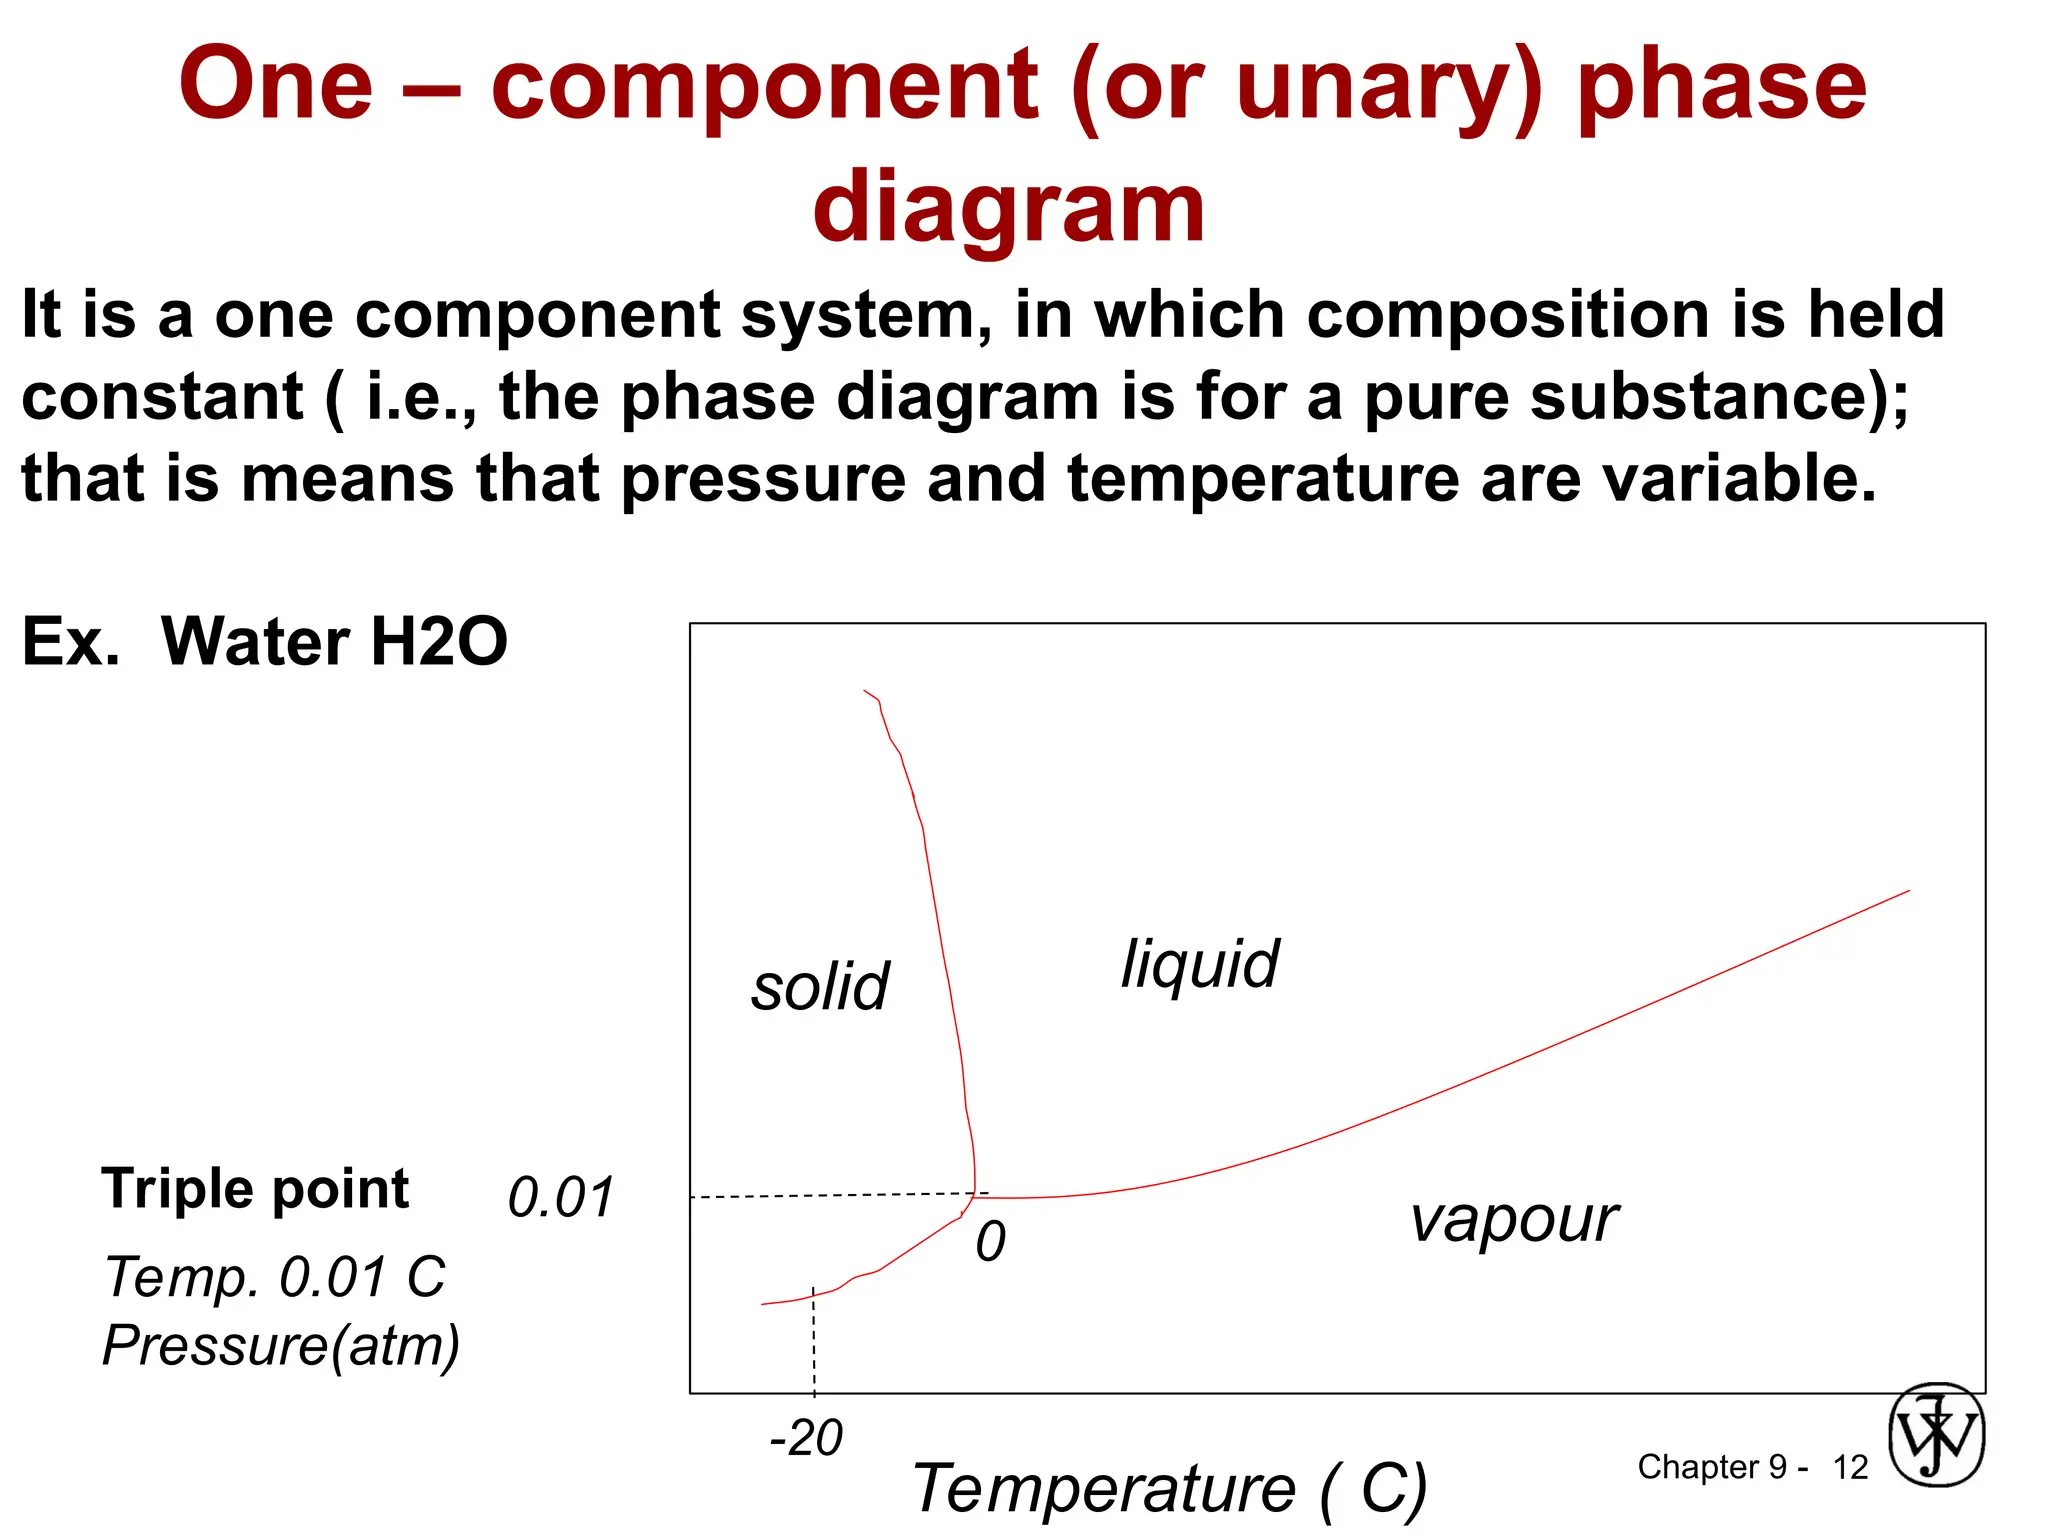
One– component (or unary) phase
diagram
12
It is a one component system, in which composition is held
constant ( i.e., the phase diagram is for a pure substance);
that is means that pressure and temperature are variable.
Ex. Water H2O
Temp. 0.01 C
Pressure(atm)
Temperature ( C)
0
liquid
solid
vapour
0.01
-20
Triple point
13.
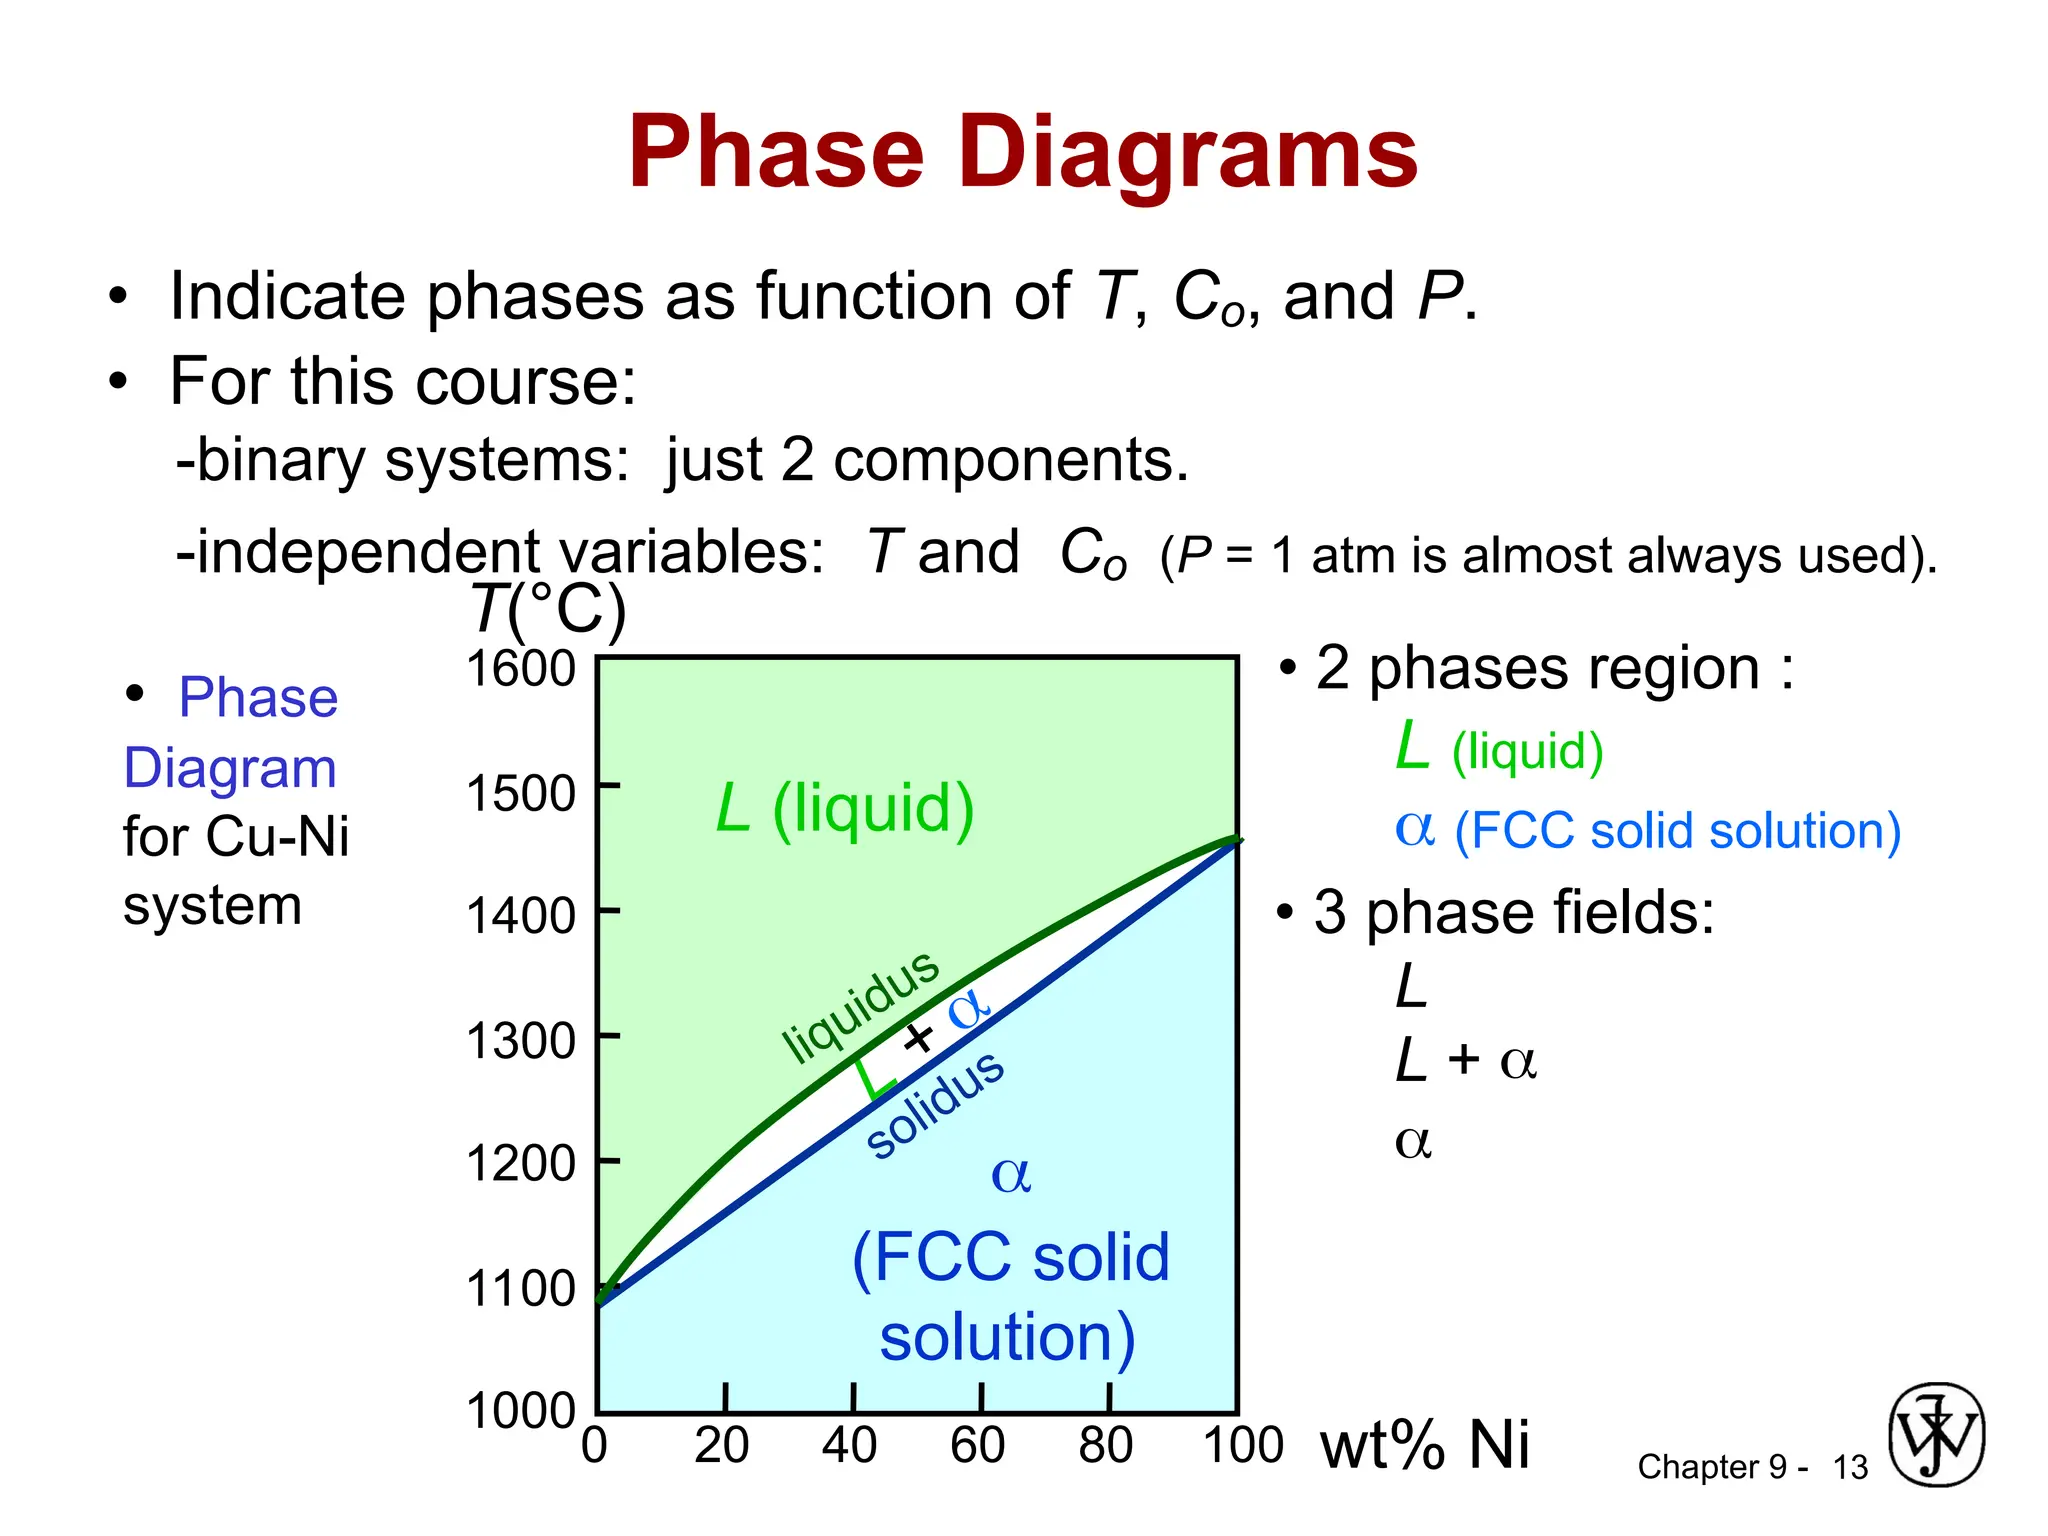
Chapter 9 -13
Phase Diagrams
• Indicate phases as function of T, Co, and P.
• For this course:
-binary systems: just 2 components.
-independent variables: T and Co (P = 1 atm is almost always used).
• Phase
Diagram
for Cu-Ni
system
• 2 phases region :
L (liquid)
(FCC solid solution)
• 3 phase fields:
L
L +
wt% Ni
20 40 60 80 100
0
1000
1100
1200
1300
1400
1500
1600
T(°C)
L (liquid)
(FCC solid
solution)
L +
liquidus
solidus
14.
Chapter 9 -14
Ex. copper–nickel system
The liquid L is a homogeneous liquid solution composed of
both copper and nickel.
The phase is a substitutional solid solution consisting of
both Cu and Ni atoms, and having an FCC crystal structure.
At temperatures below about 1080C, copper and nickel are
mutually soluble in each other in the solid state for all
compositions.
This complete solubility is explained by the fact that both Cu
and Ni have the same crystal structure (FCC), nearly identical
atomic radii and electro-negativities, and similar valences.
The copper–nickel system is termed isomorphous because
of this complete liquid and solid solubility of the two
components.
15.
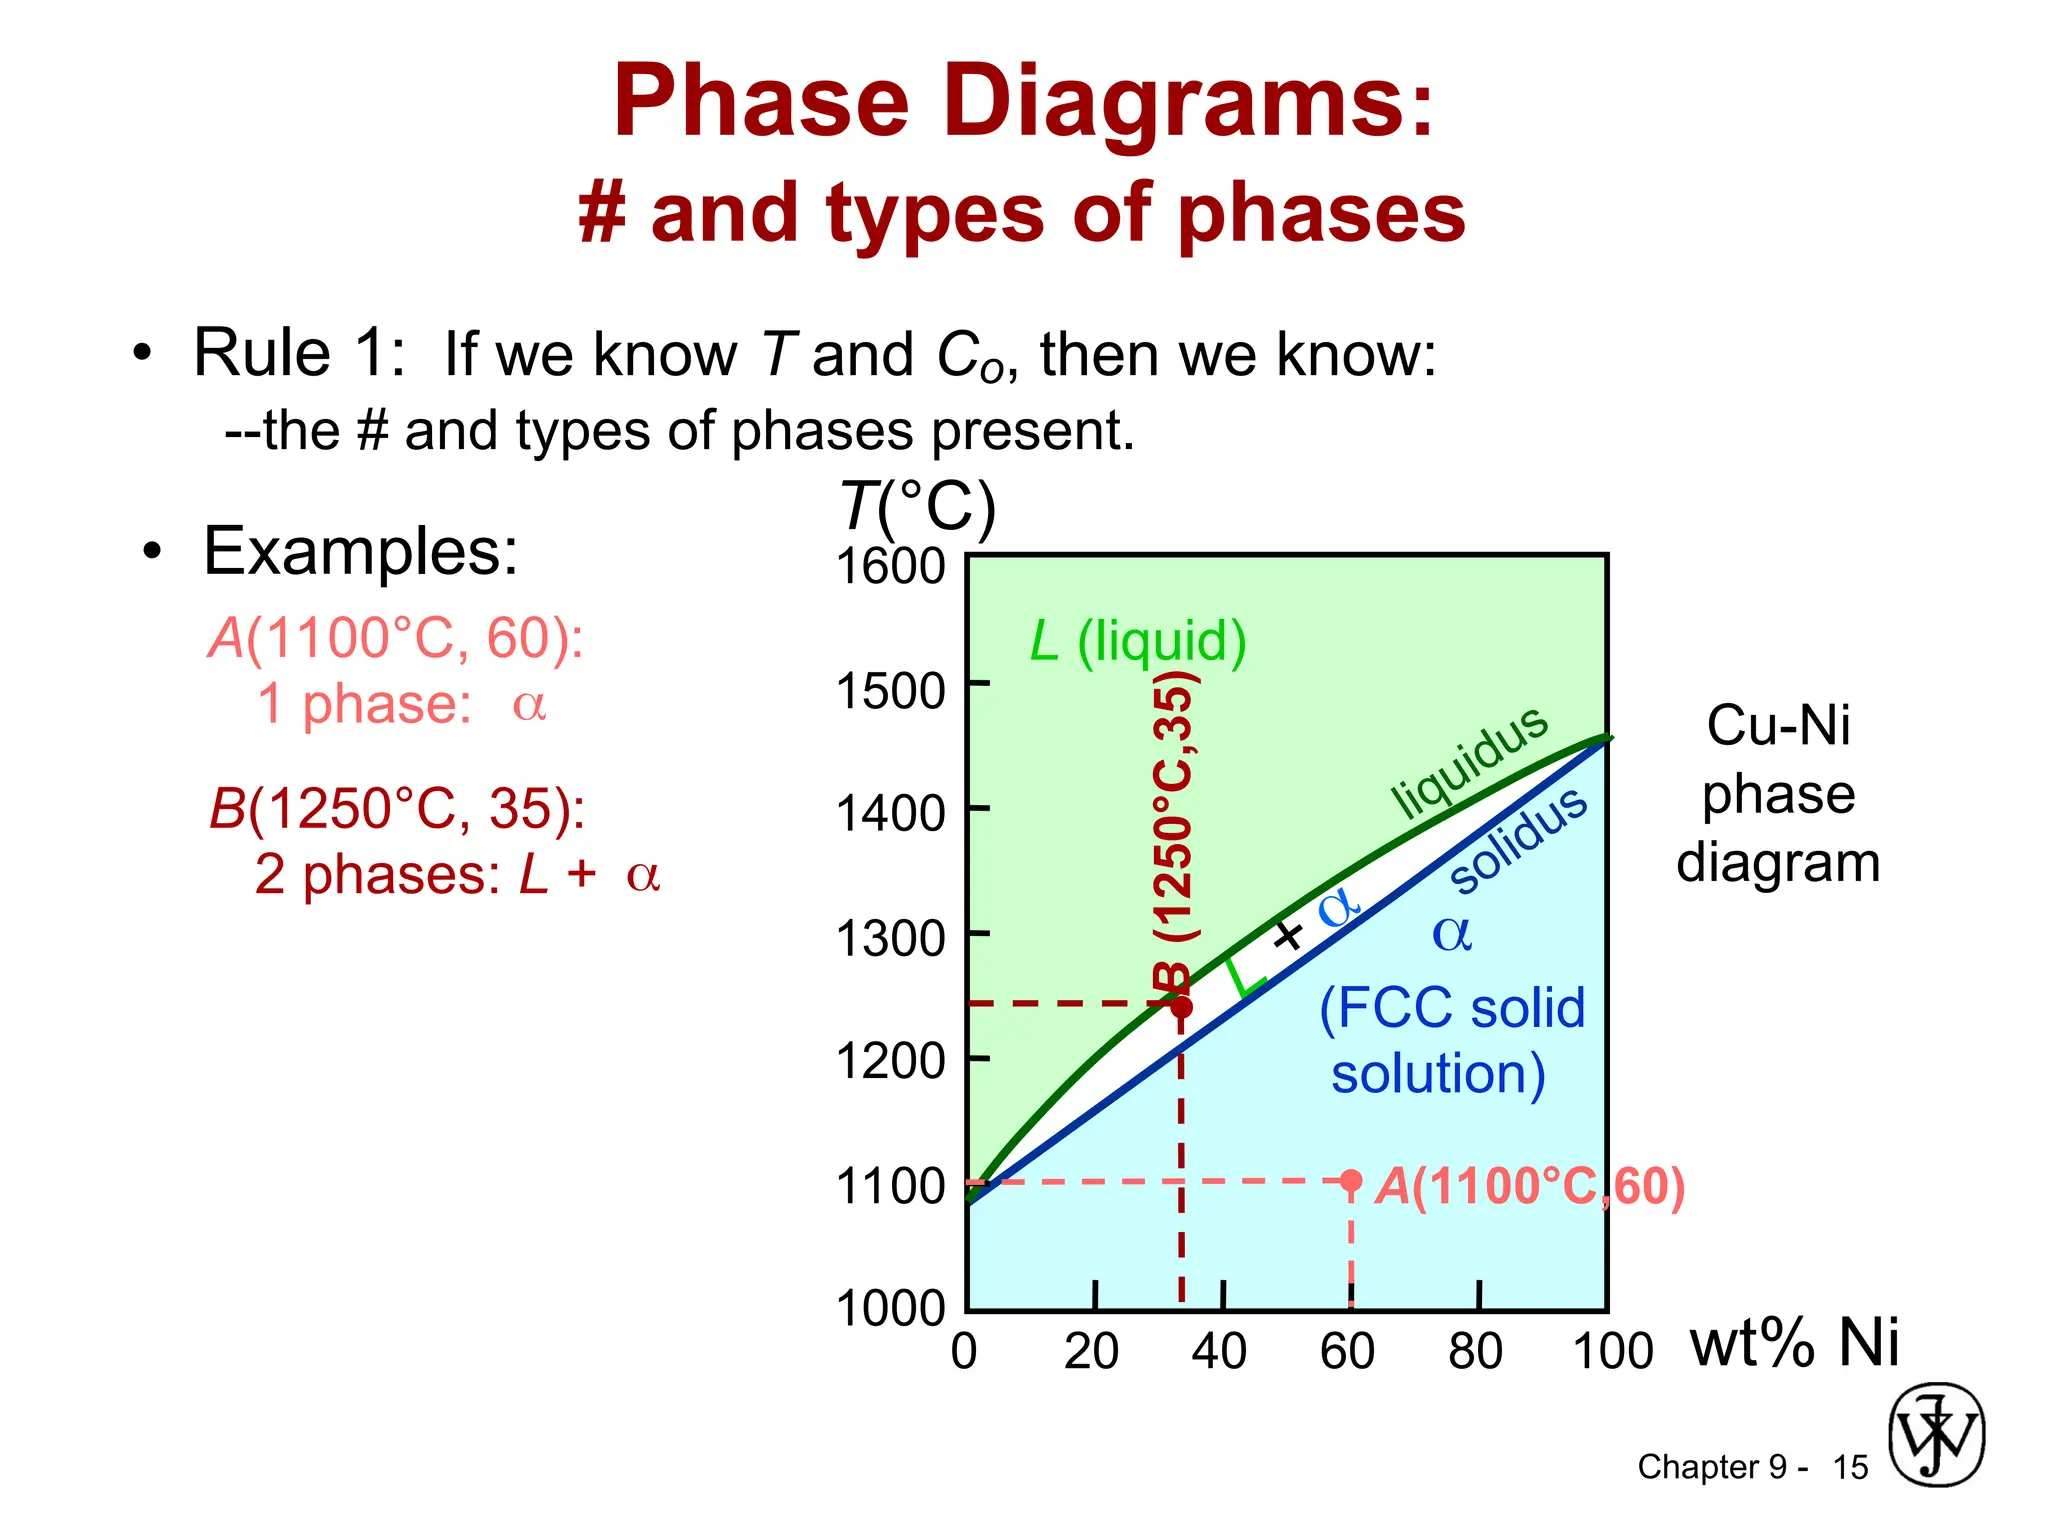
Chapter 9 -15
wt% Ni
20 40 60 80 100
0
1000
1100
1200
1300
1400
1500
1600
T(°C)
L (liquid)
(FCC solid
solution)
L
+
liquidus
solidus
Cu-Ni
phase
diagram
Phase Diagrams:
# and types of phases
• Rule 1: If we know T and Co, then we know:
--the # and types of phases present.
• Examples:
A(1100°C, 60):
1 phase:
B(1250°C, 35):
2 phases: L +
B
(1250°C,35) A(1100°C,60)
16.
Chapter 9 -16
wt% Ni
20
1200
1300
T(°C)
L (liquid)
(solid)
L +
liquidus
solidus
30 40 50
L +
Cu-Ni
system
Phase Diagrams:
composition of phases
• Rule 2: If we know T and Co, then we know:
--the composition of each phase.
• Examples:
TA
A
35
Co
32
CL
At TA = 1320°C:
Only Liquid (L)
CL = Co ( = 35 wt% Ni)
At TB = 1250°C:
Both and L
CL = Cliquidus ( = 32 wt% Ni here)
C = Csolidus ( = 43 wt% Ni here)
At TD = 1190°C:
Only Solid ( )
C = Co ( = 35 wt% Ni)
Co = 35 wt% Ni
B
TB
D
TD
tie line
4
C
3
17.
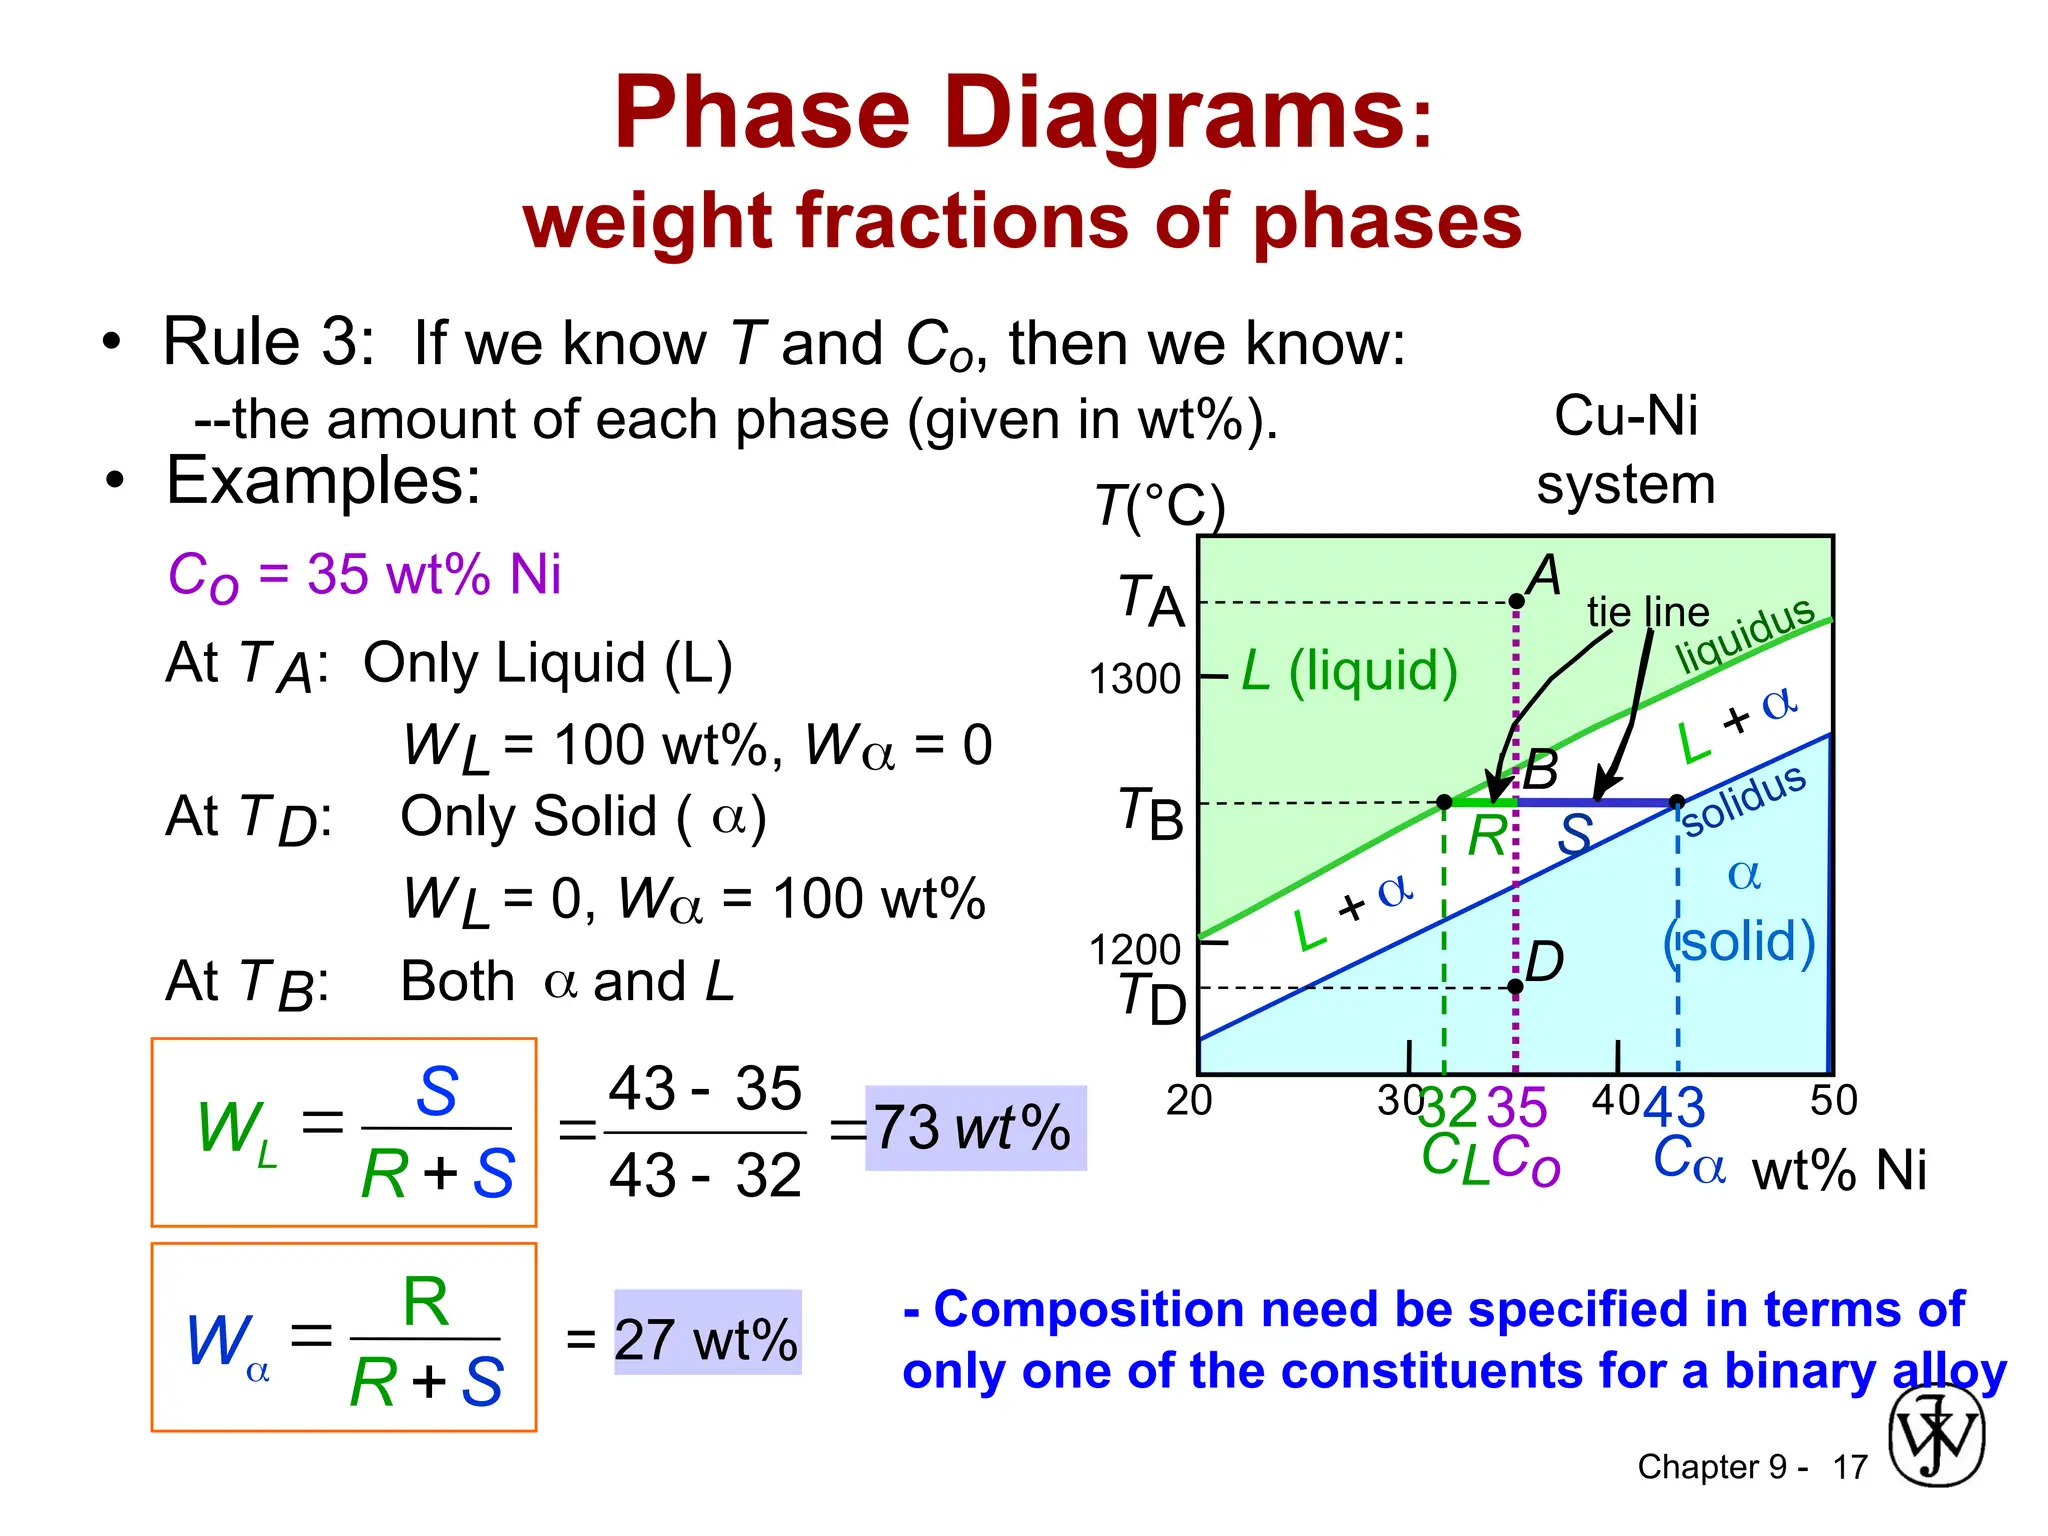
Chapter 9 -17
• Rule 3: If we know T and Co, then we know:
--the amount of each phase (given in wt%).
• Examples:
At TA: Only Liquid (L)
WL = 100 wt%, W = 0
At TD: Only Solid ( )
WL = 0, W = 100 wt%
Co = 35 wt% Ni
Phase Diagrams:
weight fractions of phases
wt% Ni
20
1200
1300
T(°C)
L (liquid)
(solid)
L +
liquidus
solidus
30 40 50
L +
Cu-Ni
system
TA
A
35
Co
32
CL
B
TB
D
TD
tie line
4
C
3
R S
At TB: Both and L
%
73
32
43
35
43
wt
= 27 wt%
WL
S
R +S
W
R
R +S
- Composition need be specified in terms of
only one of the constituents for a binary alloy
18.
Chapter 9 -18
• Tie line – connects the phases in equilibrium with
each other - essentially an isotherm
The Lever Rule
How much of each phase?
Think of it as a lever (teeter-totter)
ML
M
R S
R
M
S
M L
L
L
L
L
L
L
C
C
C
C
S
R
R
W
C
C
C
C
S
R
S
M
M
M
W
0
0
wt% Ni
20
1200
1300
T(°C)
L (liquid)
(solid)
L +
liquidus
solidus
30 40 50
L +
B
TB
tie line
Co
CL C
S
R
Chapter 9 -20
wt% Ni
20
1200
1300
30 40 50
1100
L (liquid)
(solid)
L +
L +
T(°C)
A
35
Co
L: 35wt%Ni
Cu-Ni
system
• Phase diagram:
Cu-Ni system.
• System is:
--binary
i.e., 2 components:
Cu and Ni.
--isomorphous
i.e., complete
solubility of one
component in
another; phase
field extends from
0 to 100 wt% Ni.
• Consider
Co = 35 wt%Ni.
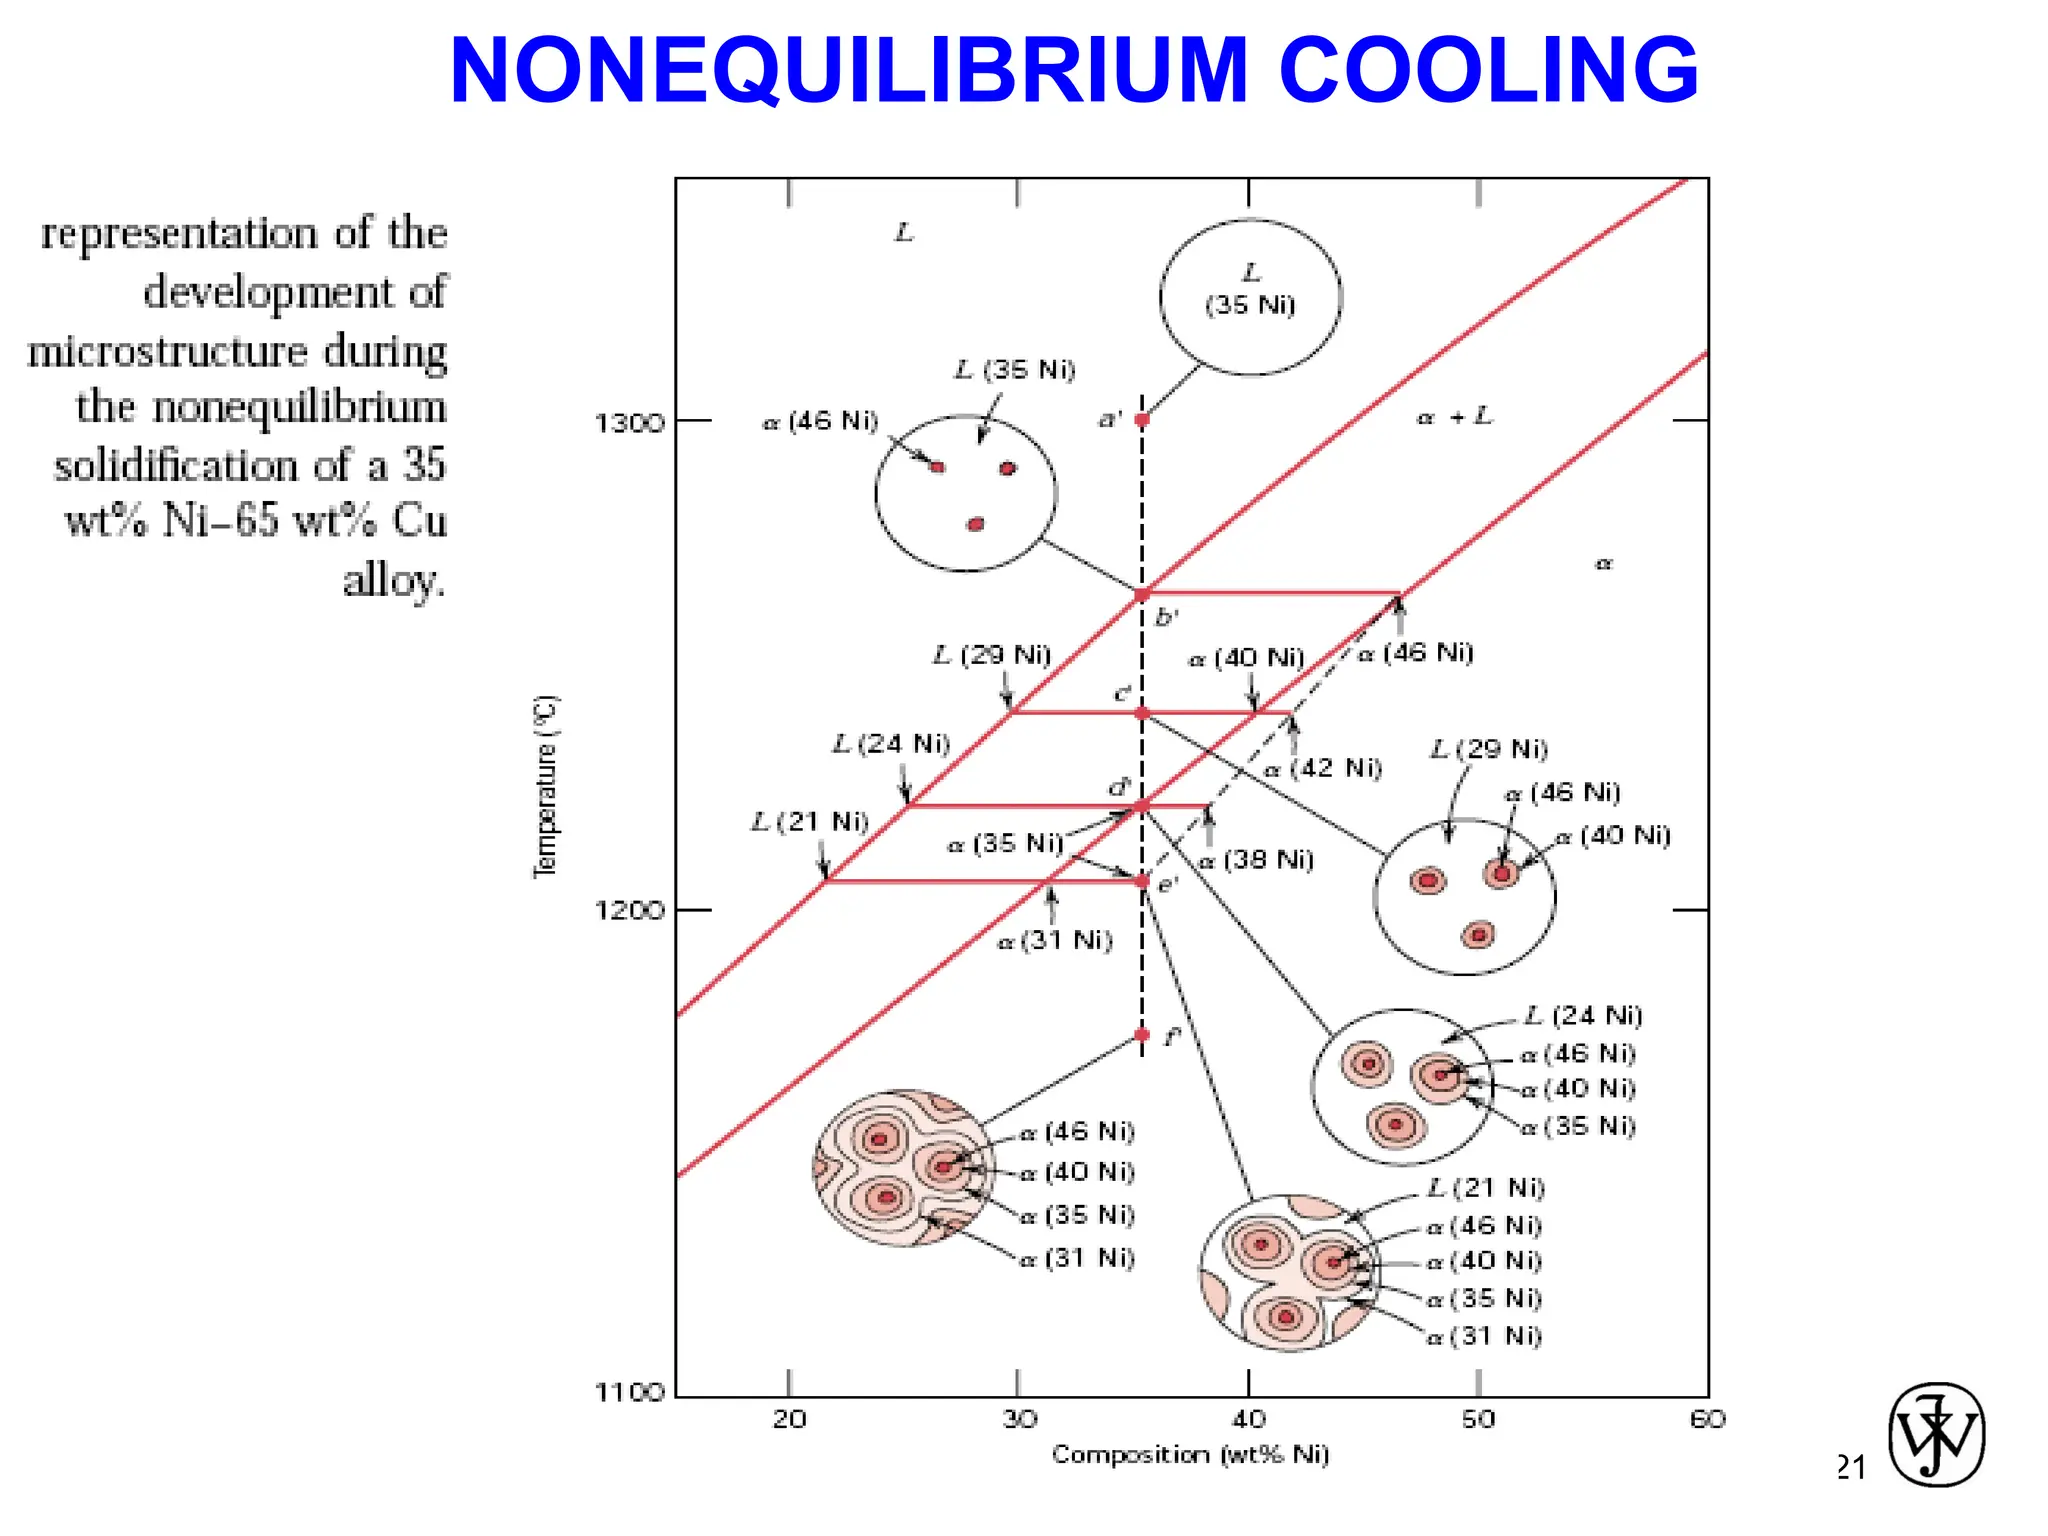
Ex: Cooling in a Cu-Ni Binary
46
35
43
32
: 43 wt% Ni
L: 32 wt% Ni
L: 24 wt% Ni
: 36 wt% Ni
B
: 46 wt% Ni
L: 35 wt% Ni
C
D
E
24 36
1. EQUILIBRIUM COOLING
Chapter 9 -22
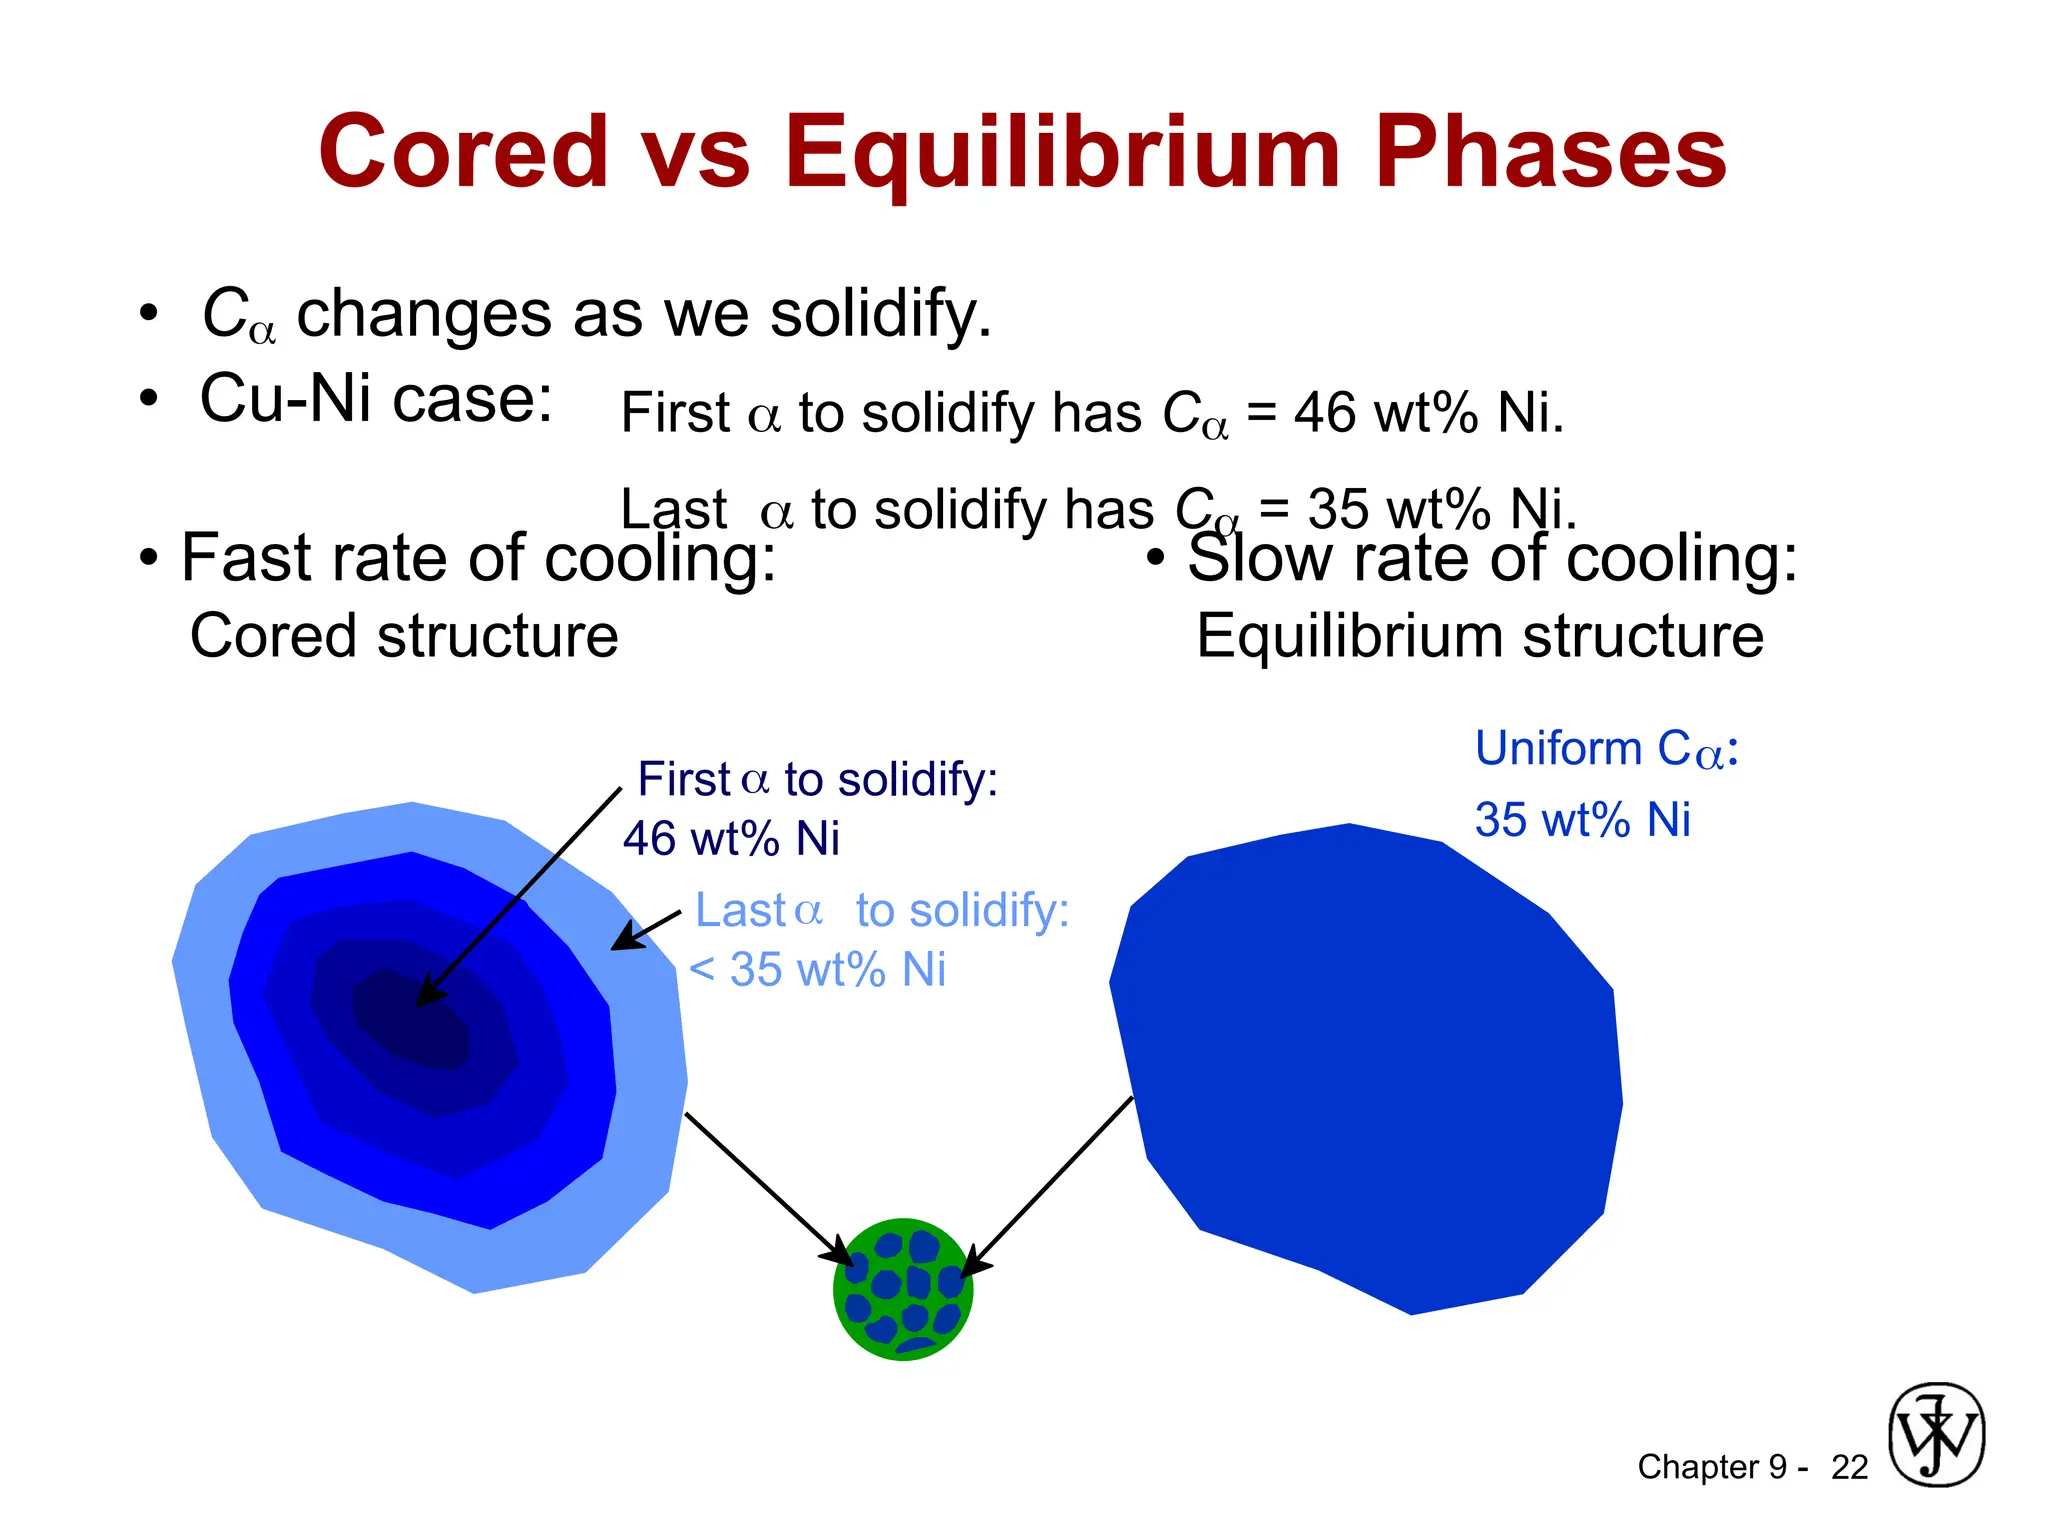
• C changes as we solidify.
• Cu-Ni case:
• Fast rate of cooling:
Cored structure
• Slow rate of cooling:
Equilibrium structure
First to solidify has C = 46 wt% Ni.
Last to solidify has C = 35 wt% Ni.
Cored vs Equilibrium Phases
First to solidify:
46 wt% Ni
Uniform C:
35 wt% Ni
Last to solidify:
< 35 wt% Ni
23.
Chapter 9 -23
Mechanical Properties: Cu-Ni System
• Effect of solid solution strengthening on:
--Tensile strength (TS) --Ductility (%EL,%AR)
--Peak as a function of Co --Min. as a function of Co
Tensile
Strength
(MPa)
Composition, wt% Ni
Cu Ni
0 20 40 60 80 100
200
300
400
TS for
pure Ni
TS for pure Cu
Elongation
(%EL) Composition, wt% Ni
Cu Ni
0 20 40 60 80 100
20
30
40
50
60
%EL for
pure Ni
%EL for pure Cu
24.
Chapter 9 -24
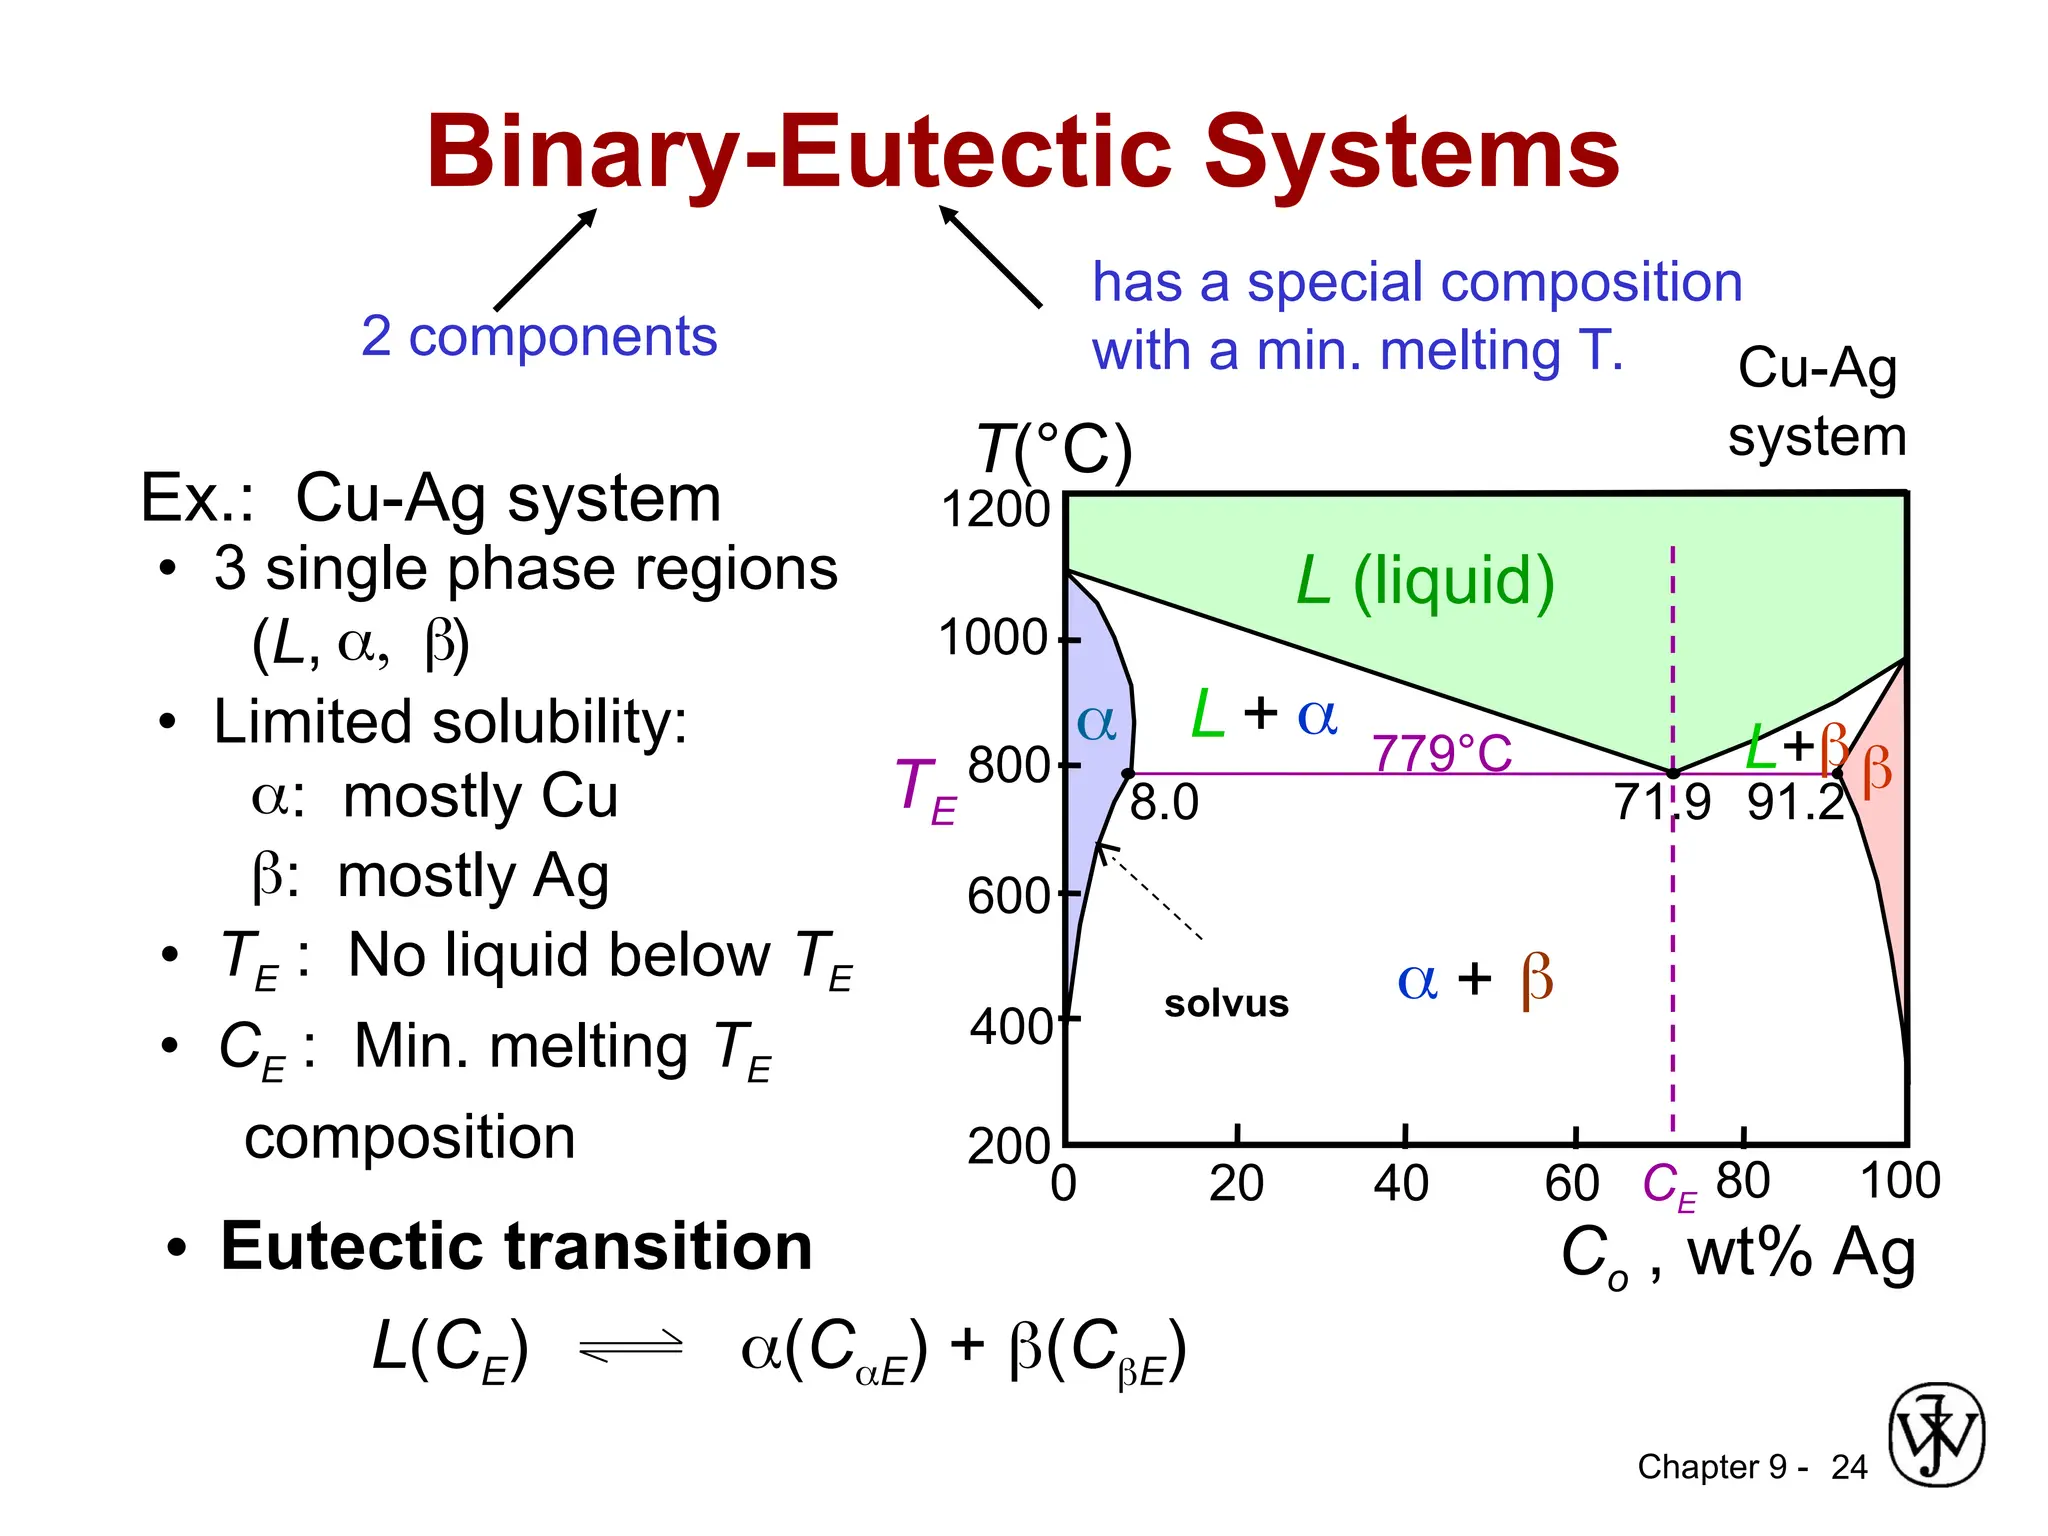
: Min. melting TE
2 components
has a special composition
with a min. melting T.
Binary-Eutectic Systems
• Eutectic transition
L(CE) (CE) + (CE)
• 3 single phase regions
(L, )
• Limited solubility:
: mostly Cu
: mostly Ag
• TE : No liquid below TE
• CE
composition
Ex.: Cu-Ag system
Cu-Ag
system
L (liquid)
L + L+
Co , wt% Ag
20 40 60 80 100
0
200
1200
T(°C)
400
600
800
1000
CE
TE 8.0 71.9 91.2
779°C
solvus
25.
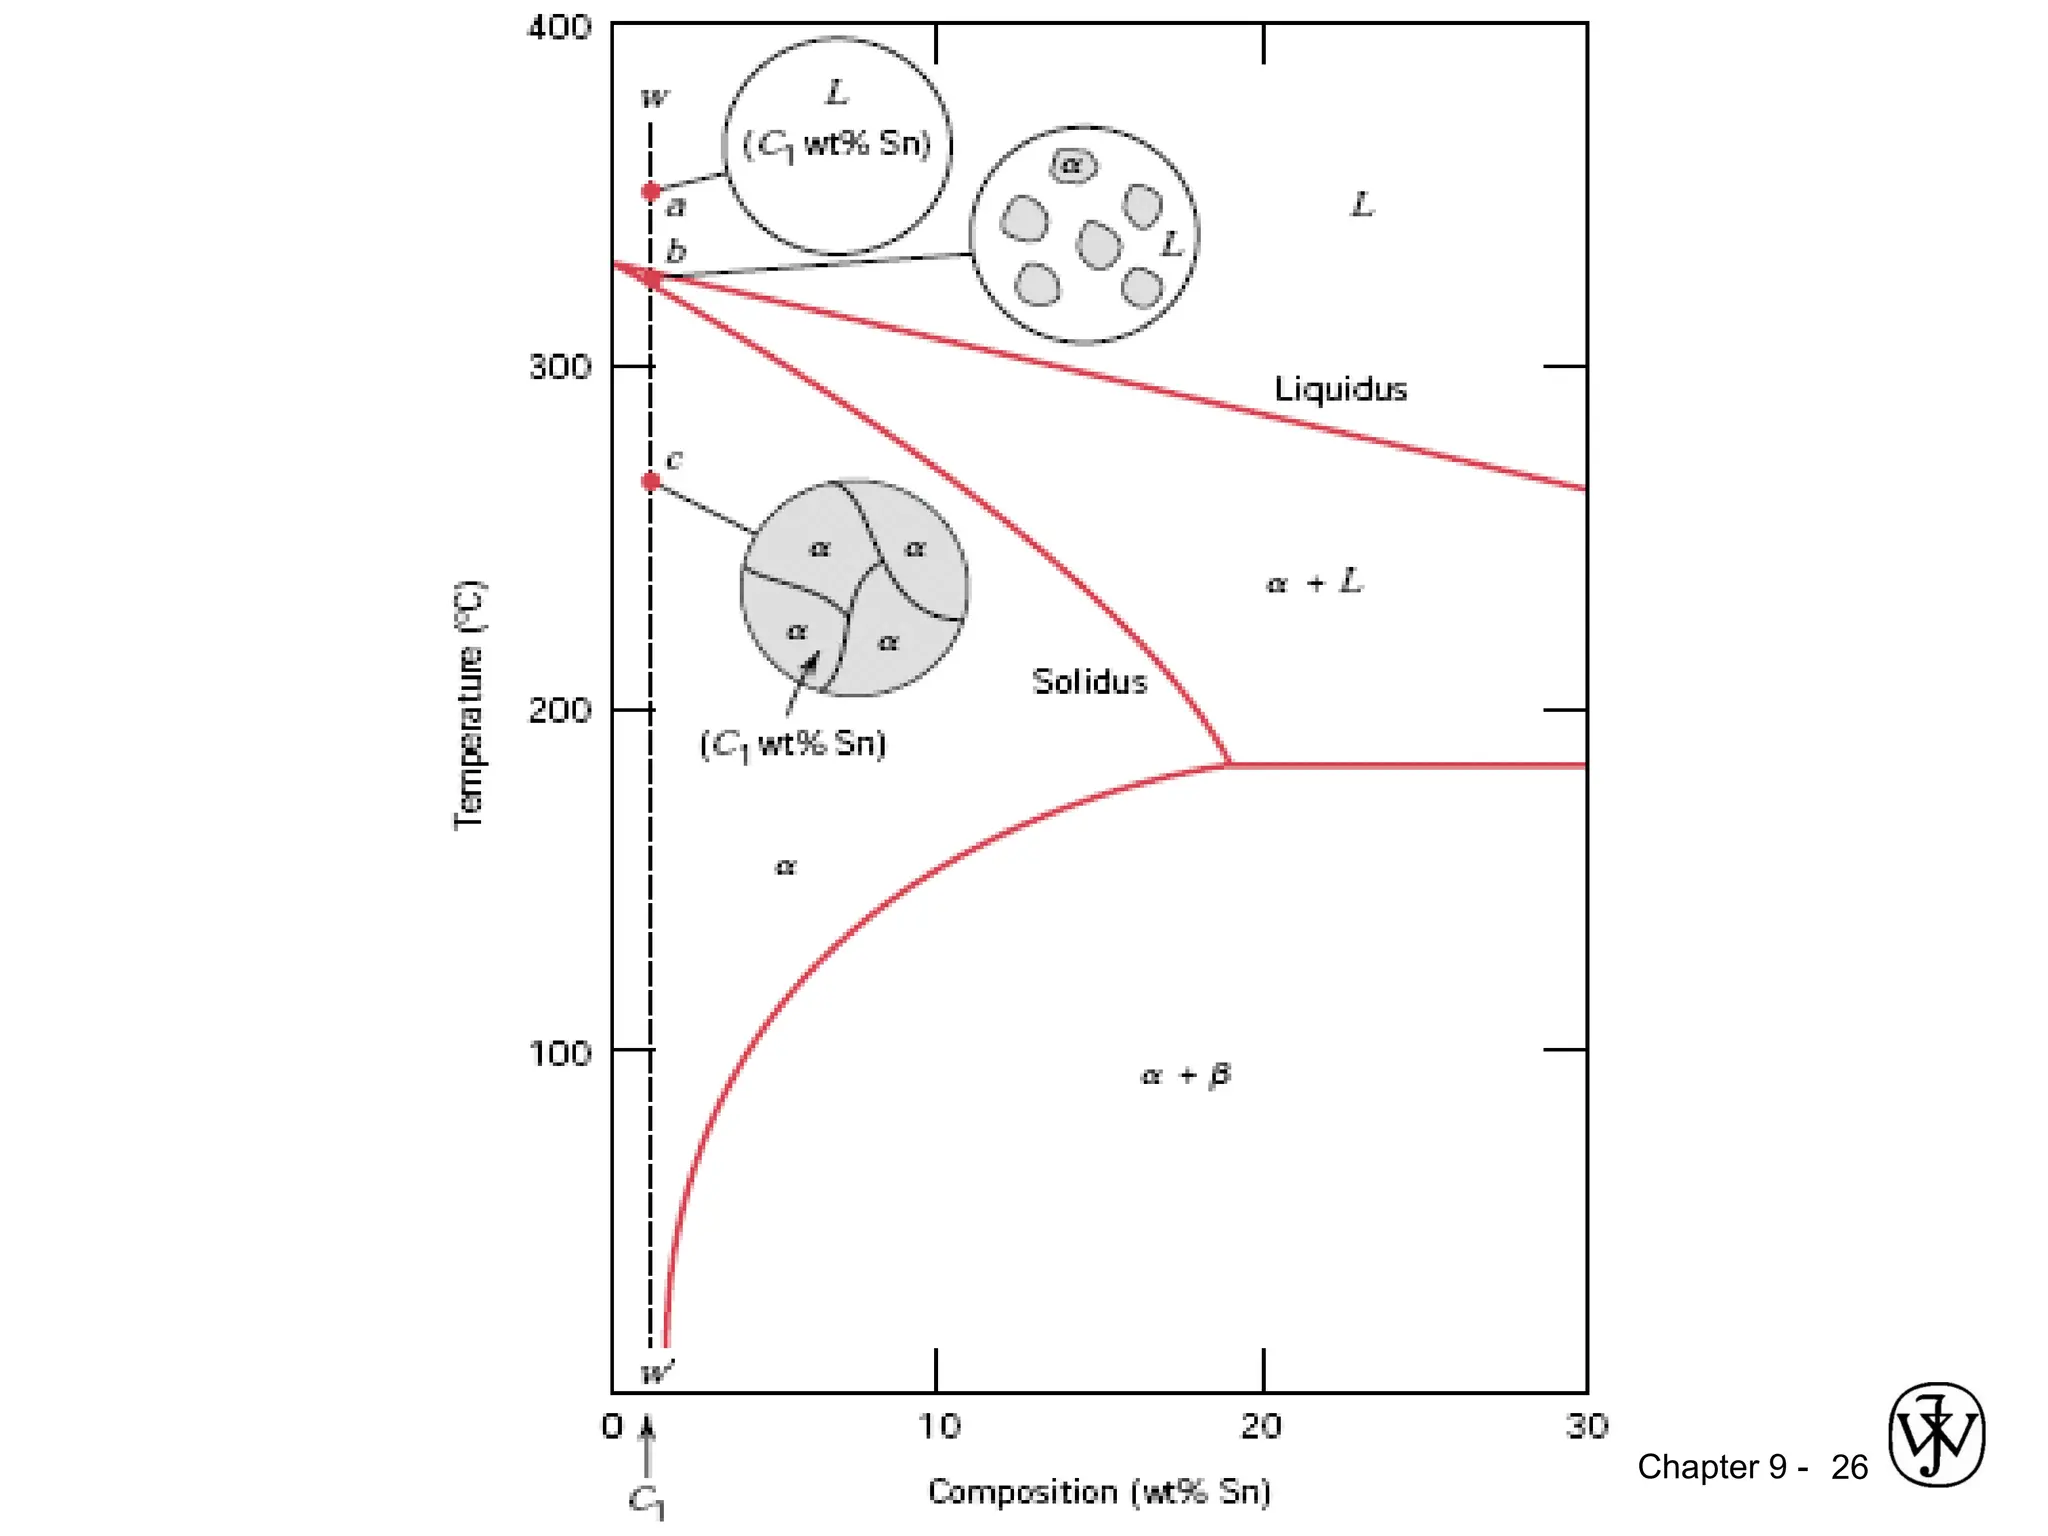
Chapter 9 -
Binary-EutecticSystems
25
Depending on composition, several different types of
microstructures are possible for the slow cooling of alloys
belonging to binary eutectic systems.
Ex. Lead(Pb)–tin(Sn) phase diagram
• The first case is for compositions ranging between a
pure component and the maximum solid solubility for that
component at room temperature [20C (70F)].
For the lead–tin system, this includes lead-rich alloys
containing between 0 and about 2 wt% Sn (for the phase
solid solution), and also between approximately 99 wt% Sn
and pure tin (for the β phase)
Chapter 9 -
•The second case considered is for compositions that
range between the room temperature solubility limit and the
maximum solid solubility at the eutectic temperature.
For the lead–tin system (Figure 10.7), these compositions
extend from about 2wt%Sn to 18.3 wt%Sn (for lead-rich
alloys) and from 97.8 wt%Sn to approximately 99 wt% Sn (for
tin-rich alloys).
• The third case involves solidification of the eutectic
composition, 61.9 wt% Sn (C3 in Figure). Consider an alloy
having this composition that is cooled from a temperature
within the liquid-phase region (e.g., 250C) down the vertical
line yy in Figure. As the temperature is lowered, no changes
occur until we reach the eutectic temperature, 183C. Upon
crossing the eutectic isotherm, the liquid transforms to the
two and phases. This transformation may be represented by
the reaction
28.
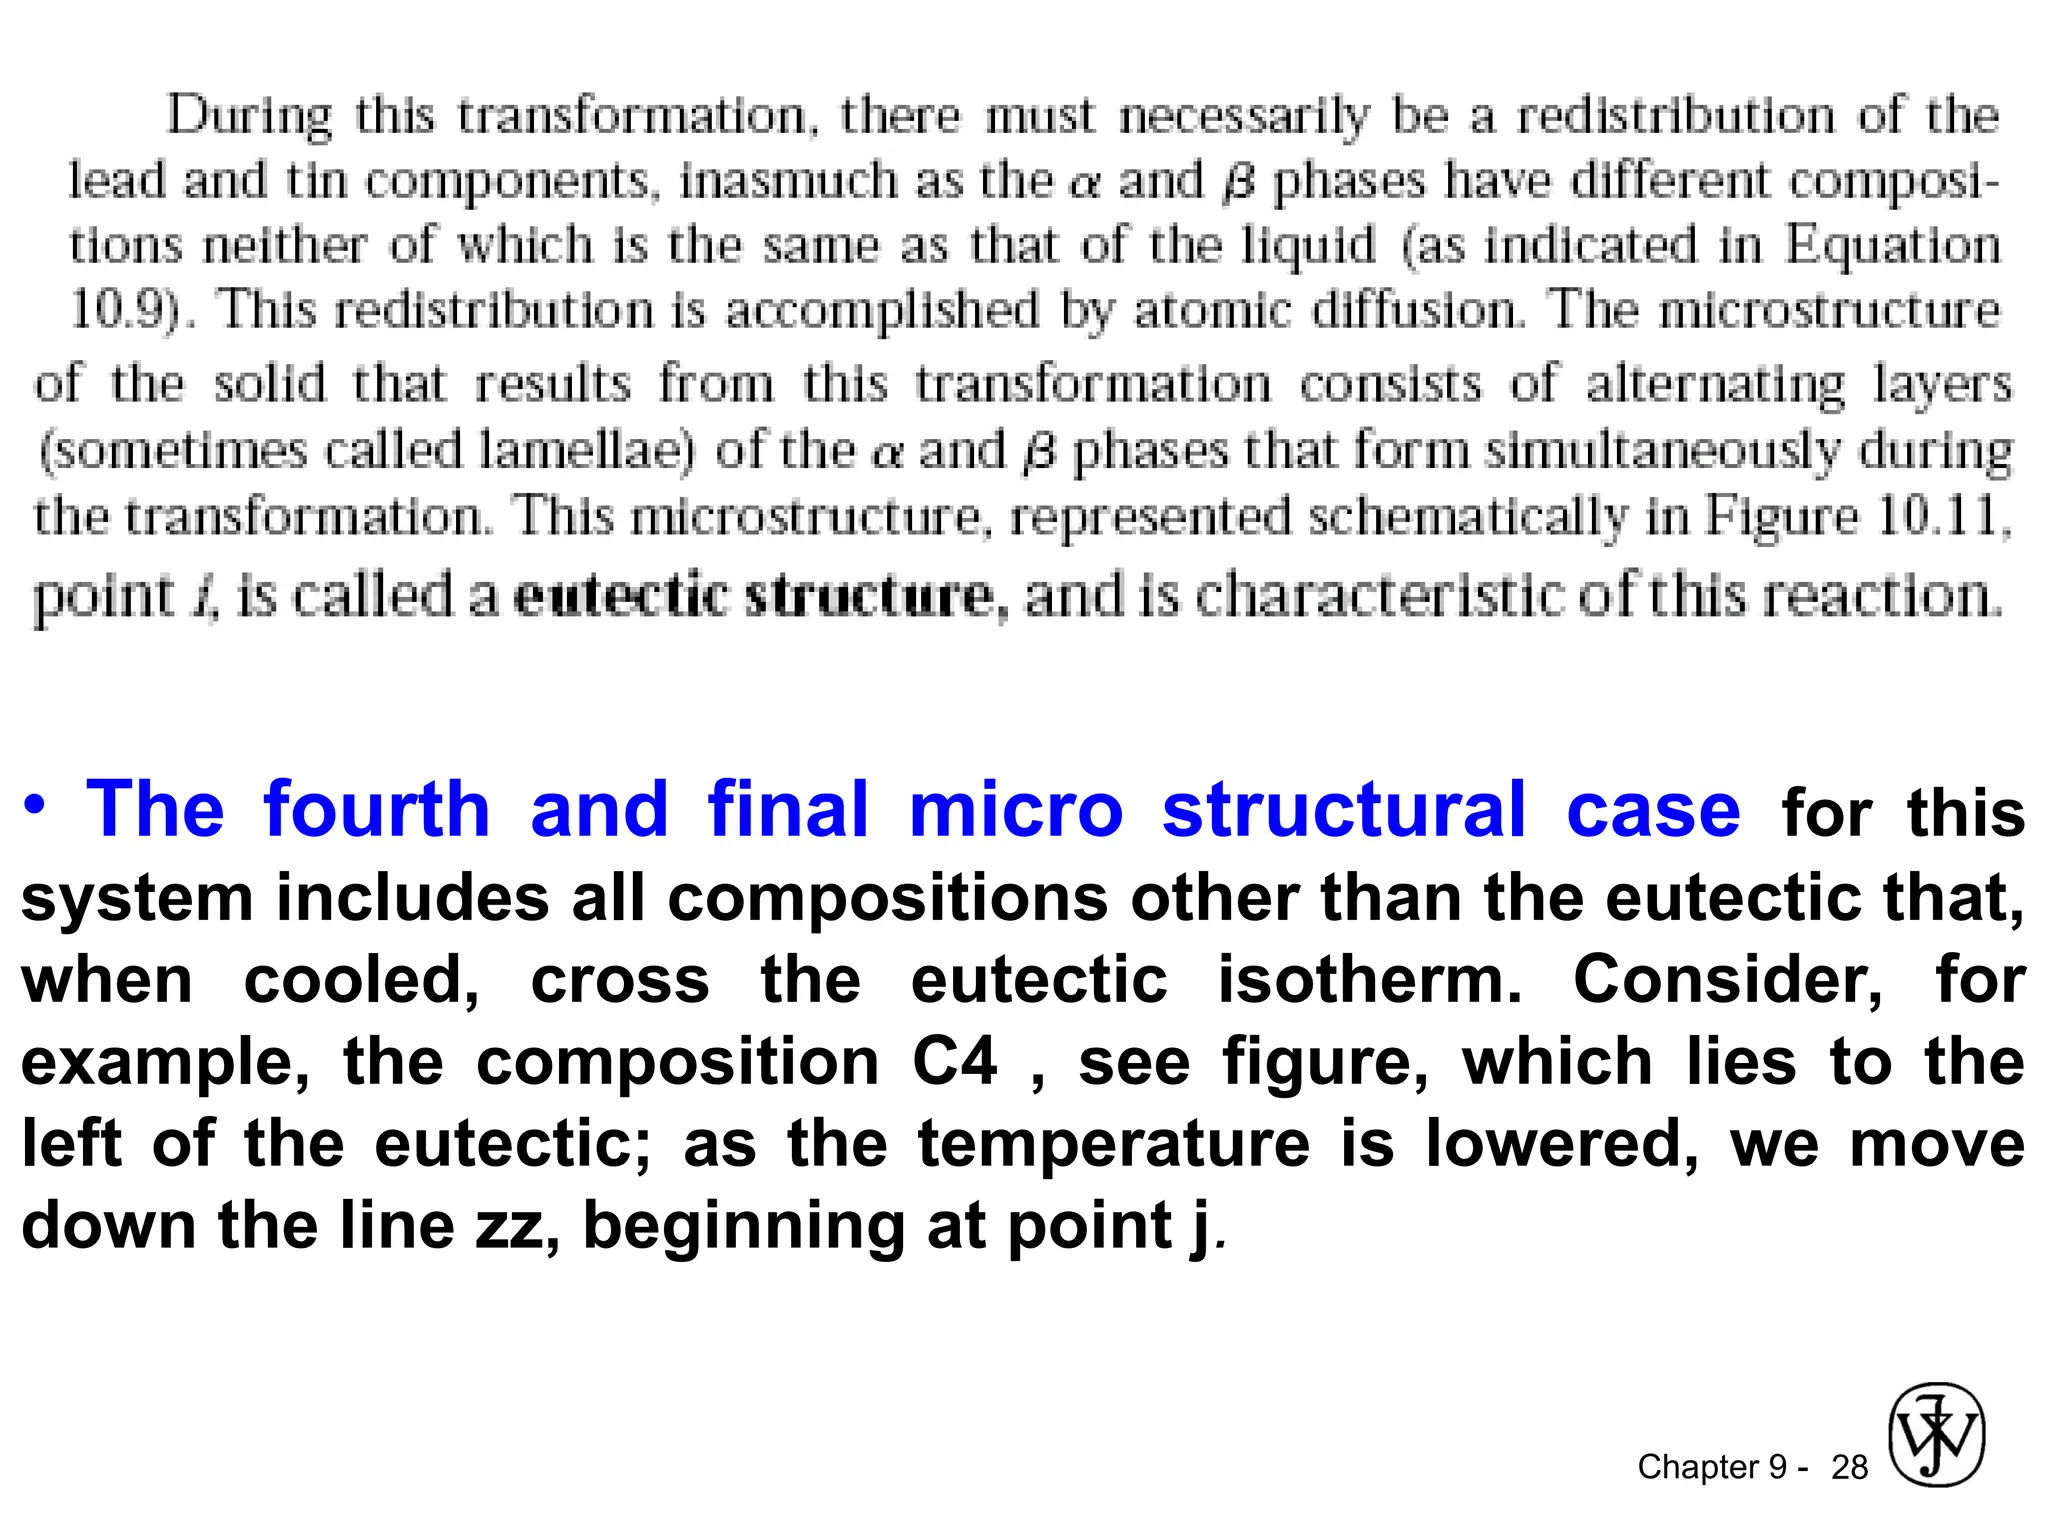
Chapter 9 -28
• The fourth and final micro structural case for this
system includes all compositions other than the eutectic that,
when cooled, cross the eutectic isotherm. Consider, for
example, the composition C4 , see figure, which lies to the
left of the eutectic; as the temperature is lowered, we move
down the line zz, beginning at point j.
Chapter 9 -30
L+
L+
+
200
T(°C)
18.3
C, wt% Sn
20 60 80 100
0
300
100
L (liquid)
183°C
61.9 97.8
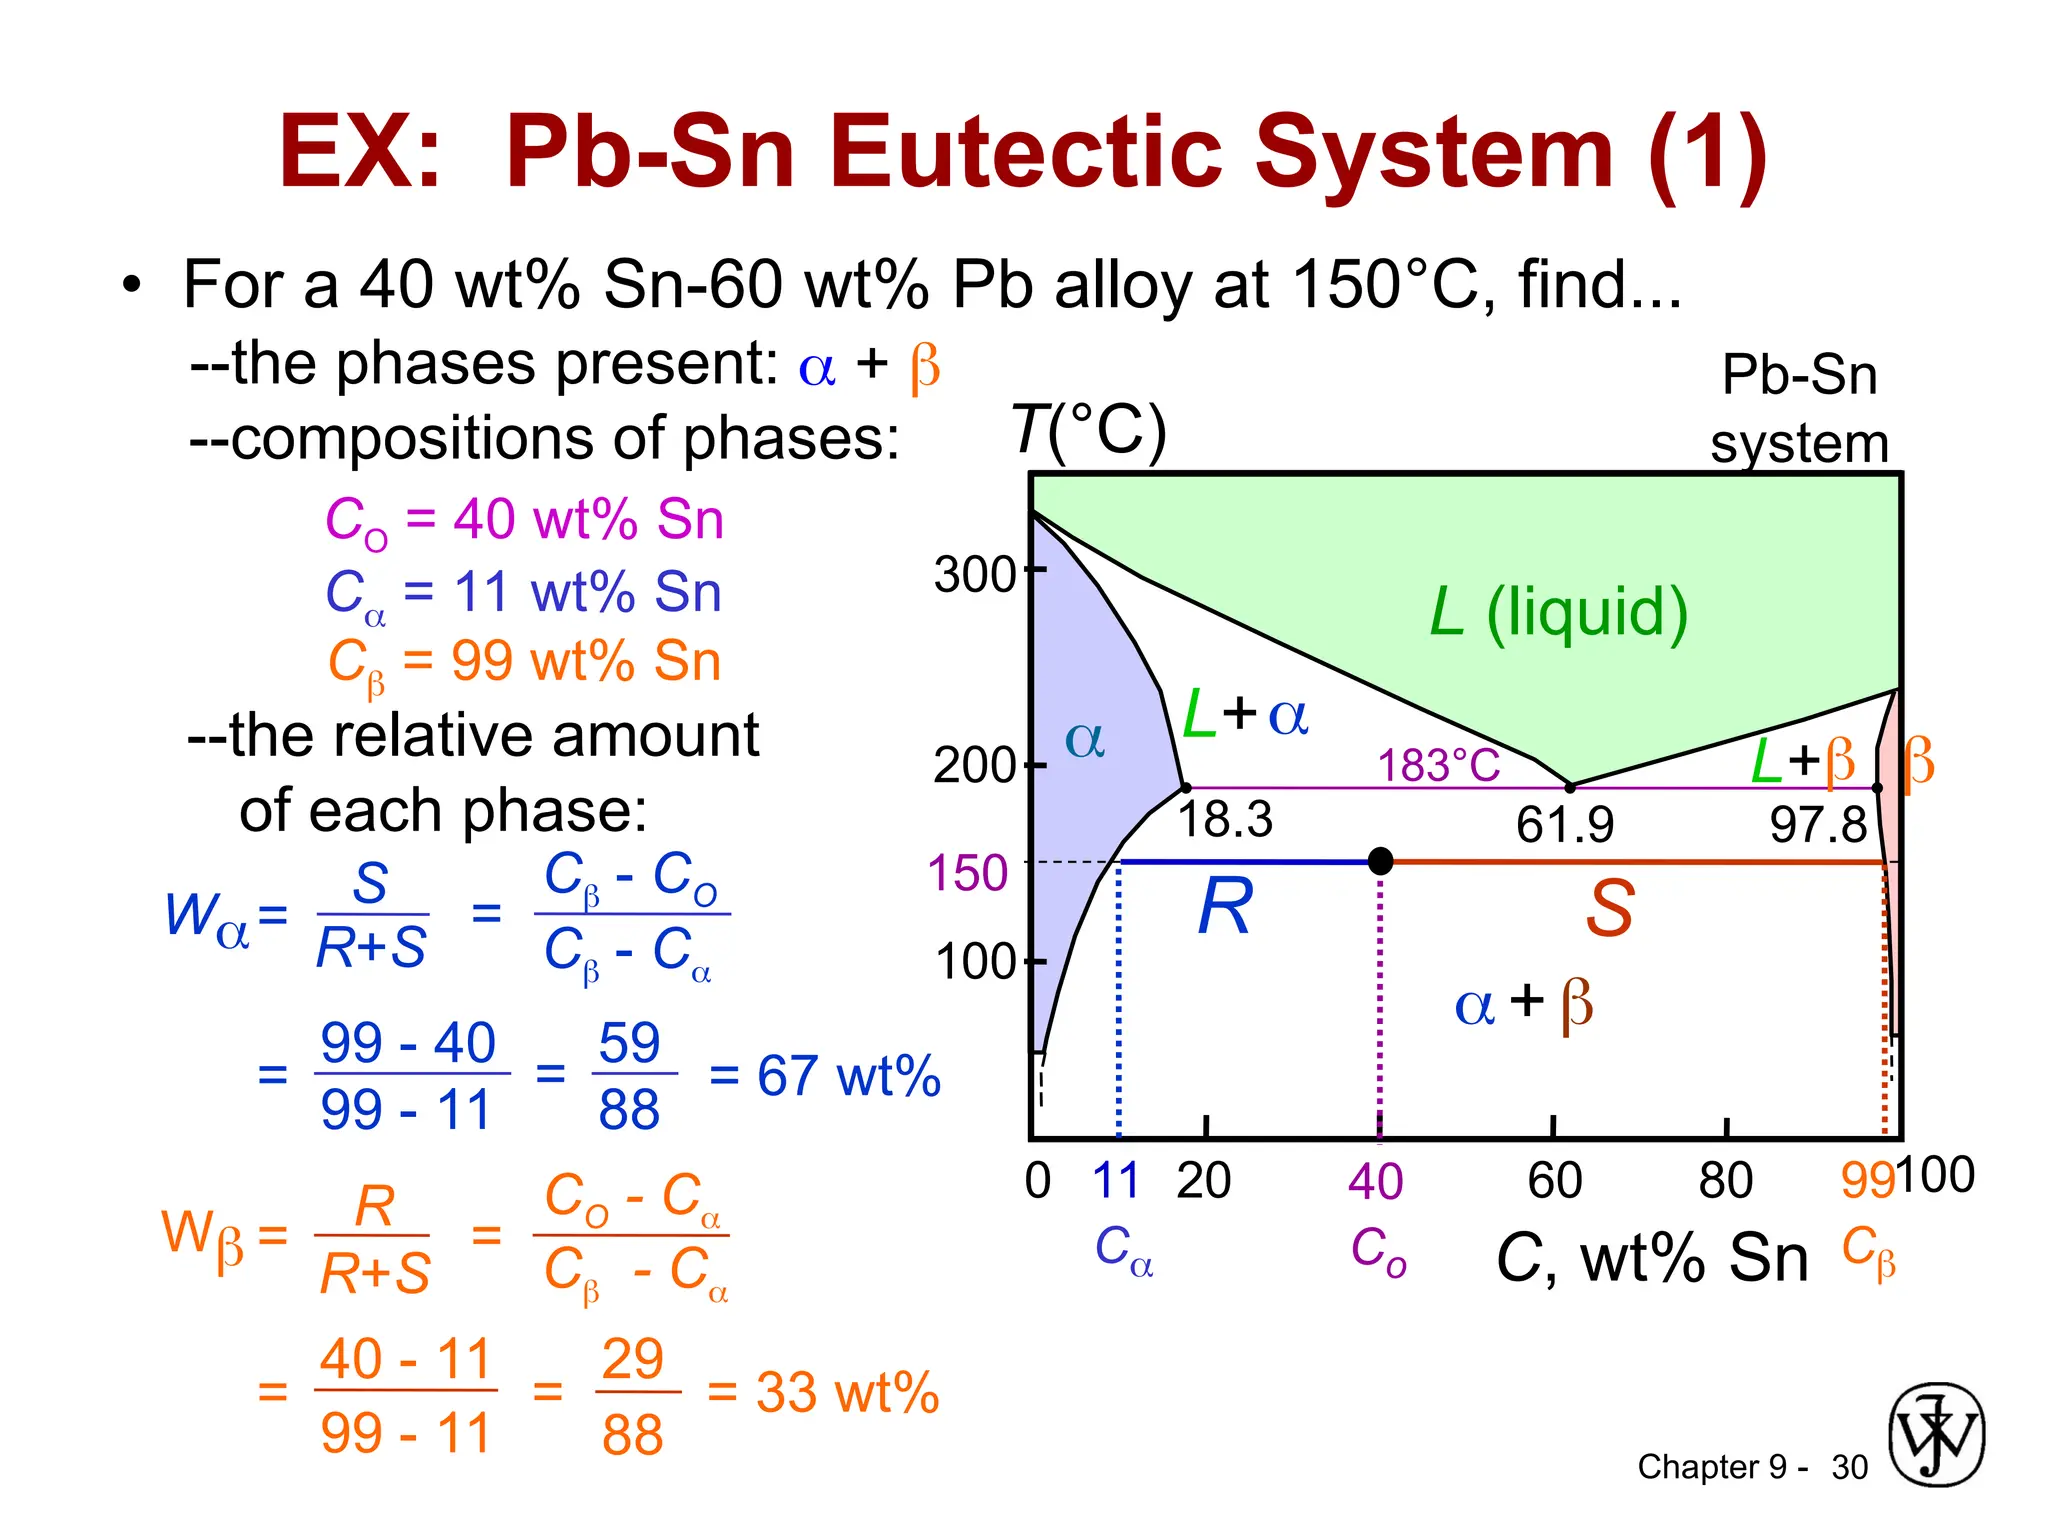
• For a 40 wt% Sn-60 wt% Pb alloy at 150°C, find...
--the phases present: Pb-Sn
system
EX: Pb-Sn Eutectic System (1)
+
--compositions of phases:
CO = 40 wt% Sn
--the relative amount
of each phase:
150
40
Co
11
C
99
C
S
R
C = 11 wt% Sn
C = 99 wt% Sn
W=
C - CO
C - C
=
99 - 40
99 - 11
=
59
88
= 67 wt%
S
R+S
=
W =
CO - C
C - C
=
R
R+S
=
29
88
= 33 wt%
=
40 - 11
99 - 11
31.
Chapter 9 -31
L+
+
200
T(°C)
C, wt% Sn
20 60 80 100
0
300
100
L (liquid)
L+
183°C
• For a 40 wt% Sn-60 wt% Pb alloy at 200°C, find...
--the phases present: Pb-Sn
system
EX: Pb-Sn Eutectic System (2)
+ L
--compositions of phases:
CO = 40 wt% Sn
--the relative amount
of each phase:
W =
CL - CO
CL - C
=
46 - 40
46 - 17
=
6
29
= 21 wt%
WL =
CO - C
CL - C
=
23
29
= 79 wt%
40
Co
46
CL
17
C
220
S
R
C = 17 wt% Sn
CL = 46 wt% Sn
32.
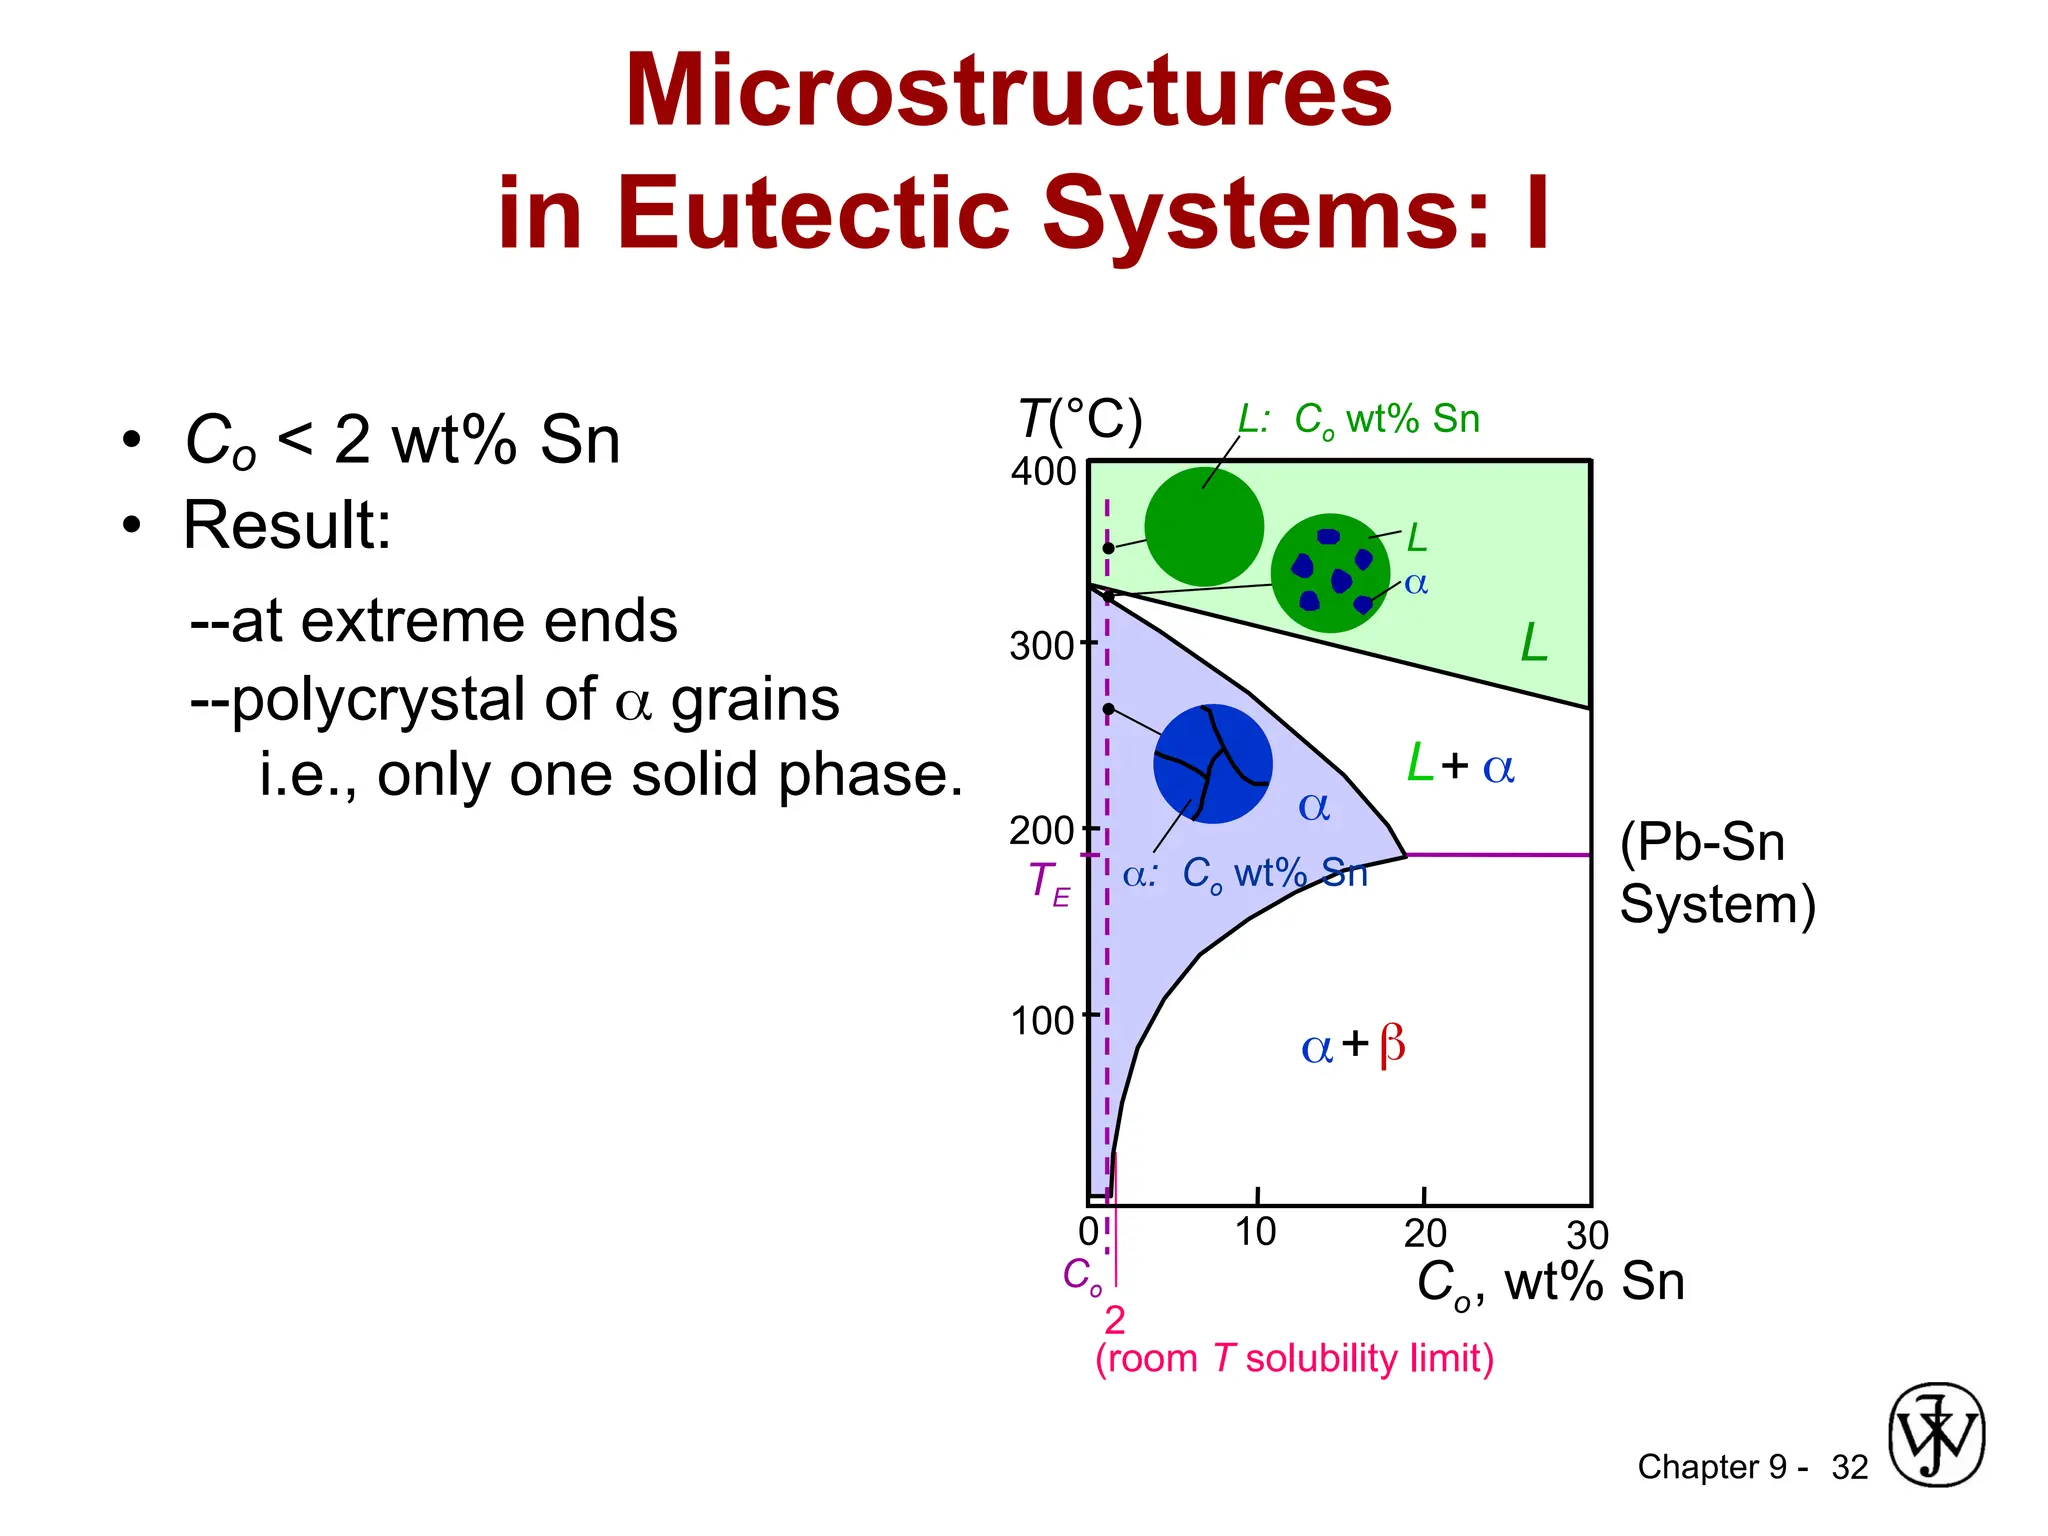
Chapter 9 -32
• Co < 2 wt% Sn
• Result:
--at extreme ends
--polycrystal of grains
i.e., only one solid phase.
Microstructures
in Eutectic Systems: I
0
L+
200
T(°C)
Co, wt% Sn
10
2
20
Co
300
100
L
30
+
400
(room T solubility limit)
TE
(Pb-Sn
System)
L
L: Co wt% Sn
: Co wt% Sn
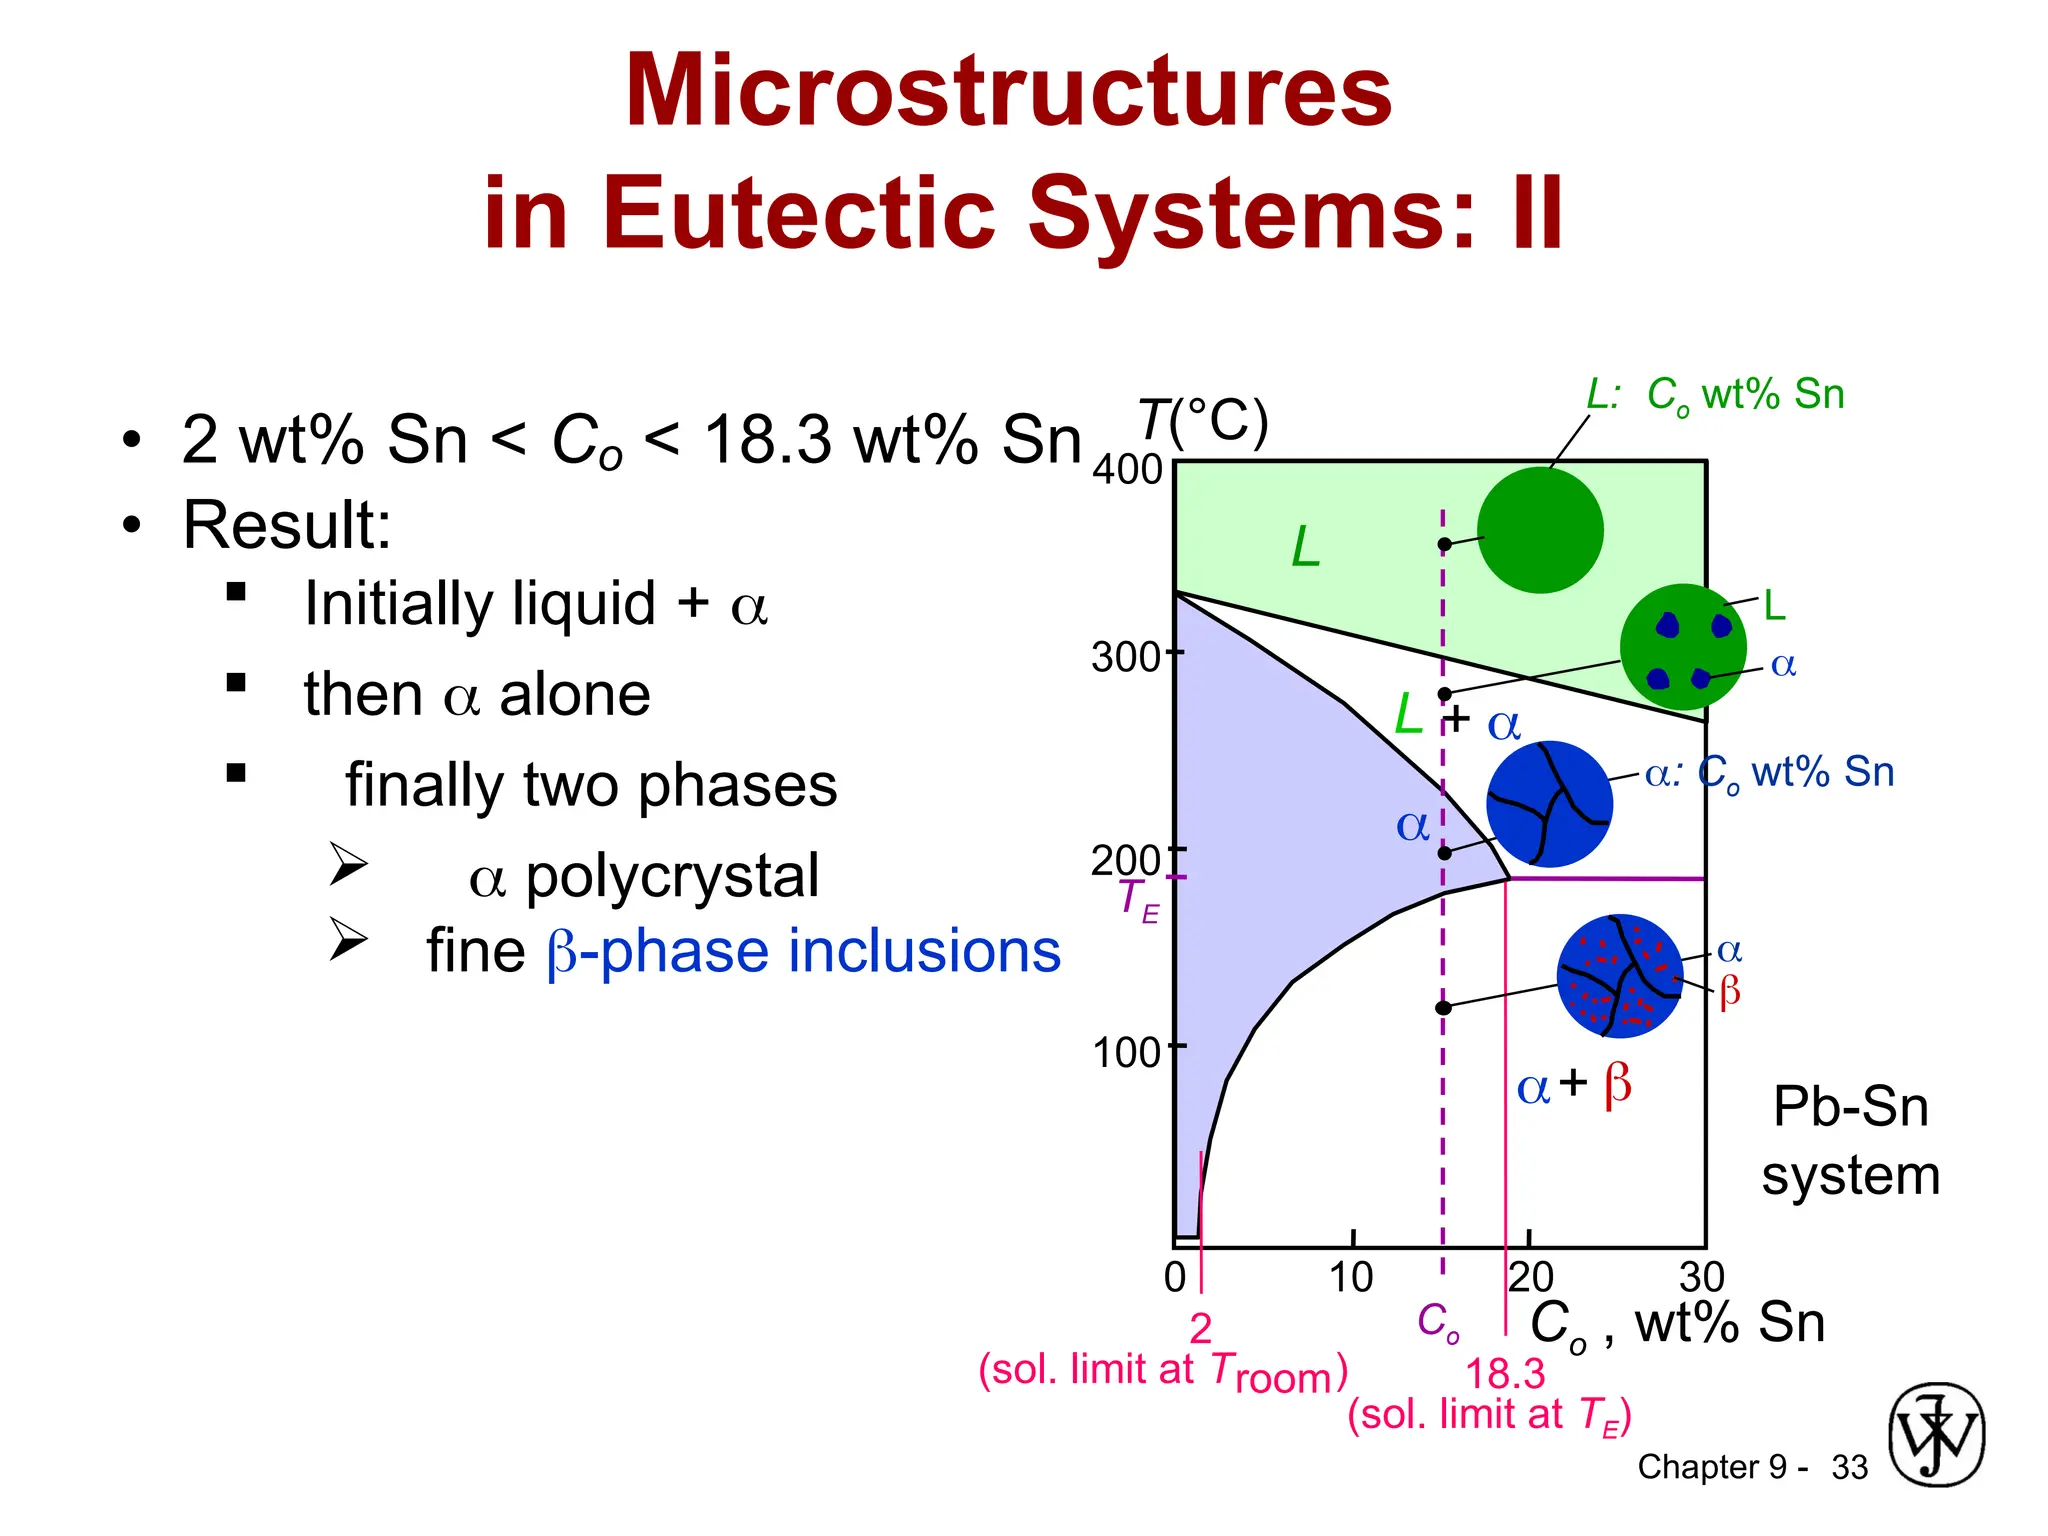
33.
Chapter 9 -33
• 2 wt% Sn < Co < 18.3 wt% Sn
• Result:
Initially liquid +
then alone
finally two phases
polycrystal
fine -phase inclusions
Microstructures
in Eutectic Systems: II
Pb-Sn
system
L +
200
T(°C)
Co , wt% Sn
10
18.3
20
0
Co
300
100
L
30
+
400
(sol. limit at TE)
TE
2
(sol. limit at Troom)
L
L: Co wt% Sn
: Co wt% Sn
34.
Chapter 9 -34
• Co = CE
• Result: Eutectic microstructure (lamellar structure)
--alternating layers (lamellae) of and crystals.
Microstructures
in Eutectic Systems: III
160m
Micrograph of Pb-Sn
eutectic
microstructure
Pb-Sn
system
L
200
T(°C)
C, wt% Sn
20 60 80 100
0
300
100
L
L+
183°C
40
TE
18.3
: 18.3 wt%Sn
97.8
: 97.8 wt% Sn
CE
61.9
L: Co wt% Sn
Chapter 9 -36
• 18.3 wt% Sn < Co < 61.9 wt% Sn
• Result: crystals and a eutectic microstructure
Microstructures
in Eutectic Systems: IV
18.3 61.9
S
R
97.8
S
R
primary
eutectic
eutectic
WL = (1-W) = 50 wt%
C = 18.3 wt% Sn
CL = 61.9 wt% Sn
S
R + S
W= = 50 wt%
• Just above TE :
• Just below TE :
C = 18.3 wt% Sn
C = 97.8 wt% Sn
S
R + S
W= = 73 wt%
W = 27 wt%
Pb-Sn
system
L+
200
T(°C)
Co, wt% Sn
20 60 80 100
0
300
100
L
L+
40
+
TE
L: Co wt% Sn L
L
37.
Chapter 9 -
Hypoeutectic& Hypereutectic
37
Hypoeutectic: alloy with a composition C to the left
eutectic point (less than eutectic)
Hypereutectic: alloy with a composition C to the right
eutectic point (more than eutectic)
38.
Chapter 9 -38
L+
L+
+
200
Co, wt% Sn
20 60 80 100
0
300
100
L
TE
40
(Pb-Sn
System)
Hypoeutectic & Hypereutectic
160 m
eutectic micro-constituent
hypereutectic: (illustration only)
175 m
hypoeutectic: Co = 50 wt% Sn
T(°C)
61.9
eutectic
eutectic: Co =61.9wt% Sn
39.
Chapter 9 -
IntermetallicCompounds
39
Terminal solid solution: the solid phase which exist
over composition ranges near the concentration
extremities.
Intermediate solid solution:(or intermediate phases )
A solid solution or phase having a composition
range that does not extend to either of the pure
components of the system. may be found at other
than the two composition extremes
Intermetallic compounds: ( for metal – metal system)
A compound of two metals that has a distinct
chemical formula. On a phase diagram it appears as
an intermediate phase that exists over a very narrow
range of compositions.
; Ex. The magnesium – lead system
40.
Chapter 9 -40
Intermetallic Compounds
Mg2Pb
Note: intermetallic compound forms a line - not an area -
because stoichiometry (i.e. composition) is exact.
41.
Chapter 9 -41
Characteristics noting for magnesium – lead system:
1.The compound Mg2Pb melts at approximately 550 C as
indicated by point M in figure
2.The solubility of lead in magnesium is rather extensive, as
indicated by the relatively large composition span for the
phase field
3.The solubility of magnesium in lead is extremely limited.
This is evident from the very narrow β terminal – solid
solution region on the right or lead – rich side of the diagram
4.This phase diagram may be thought of as two simple
eutectic diagrams joined back to back, one for the Mg-Mg2Pb
system and the other for Mg2Pb-Pb; as such the compound
Mg2Pb is really considered to be a component
42.
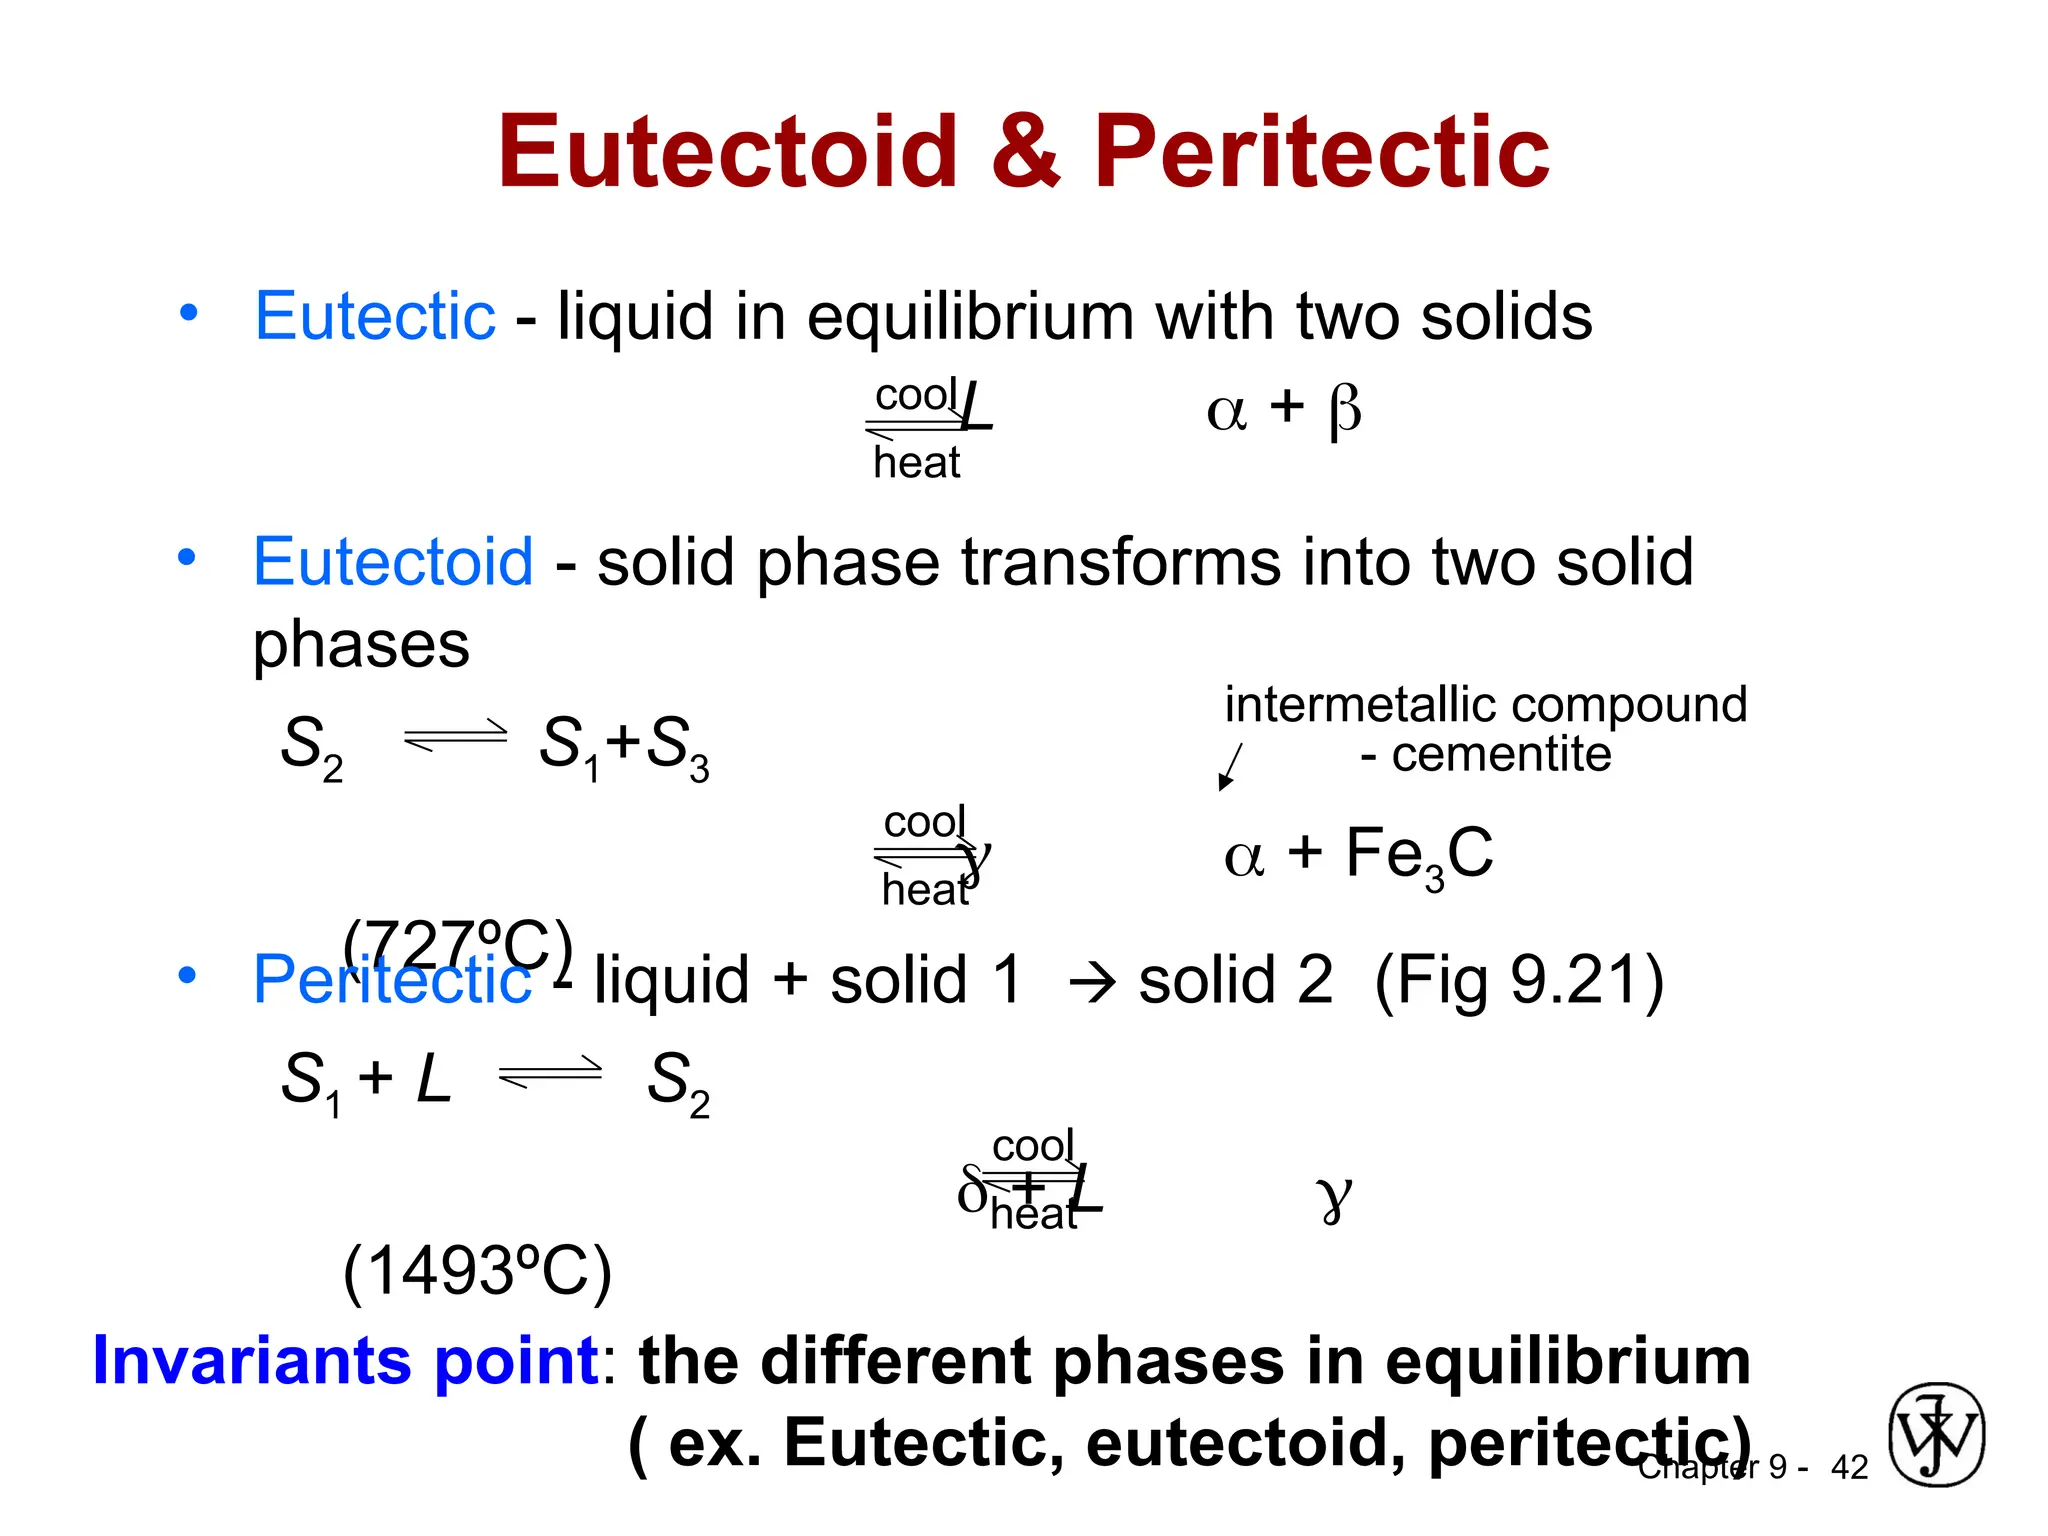
Chapter 9 -42
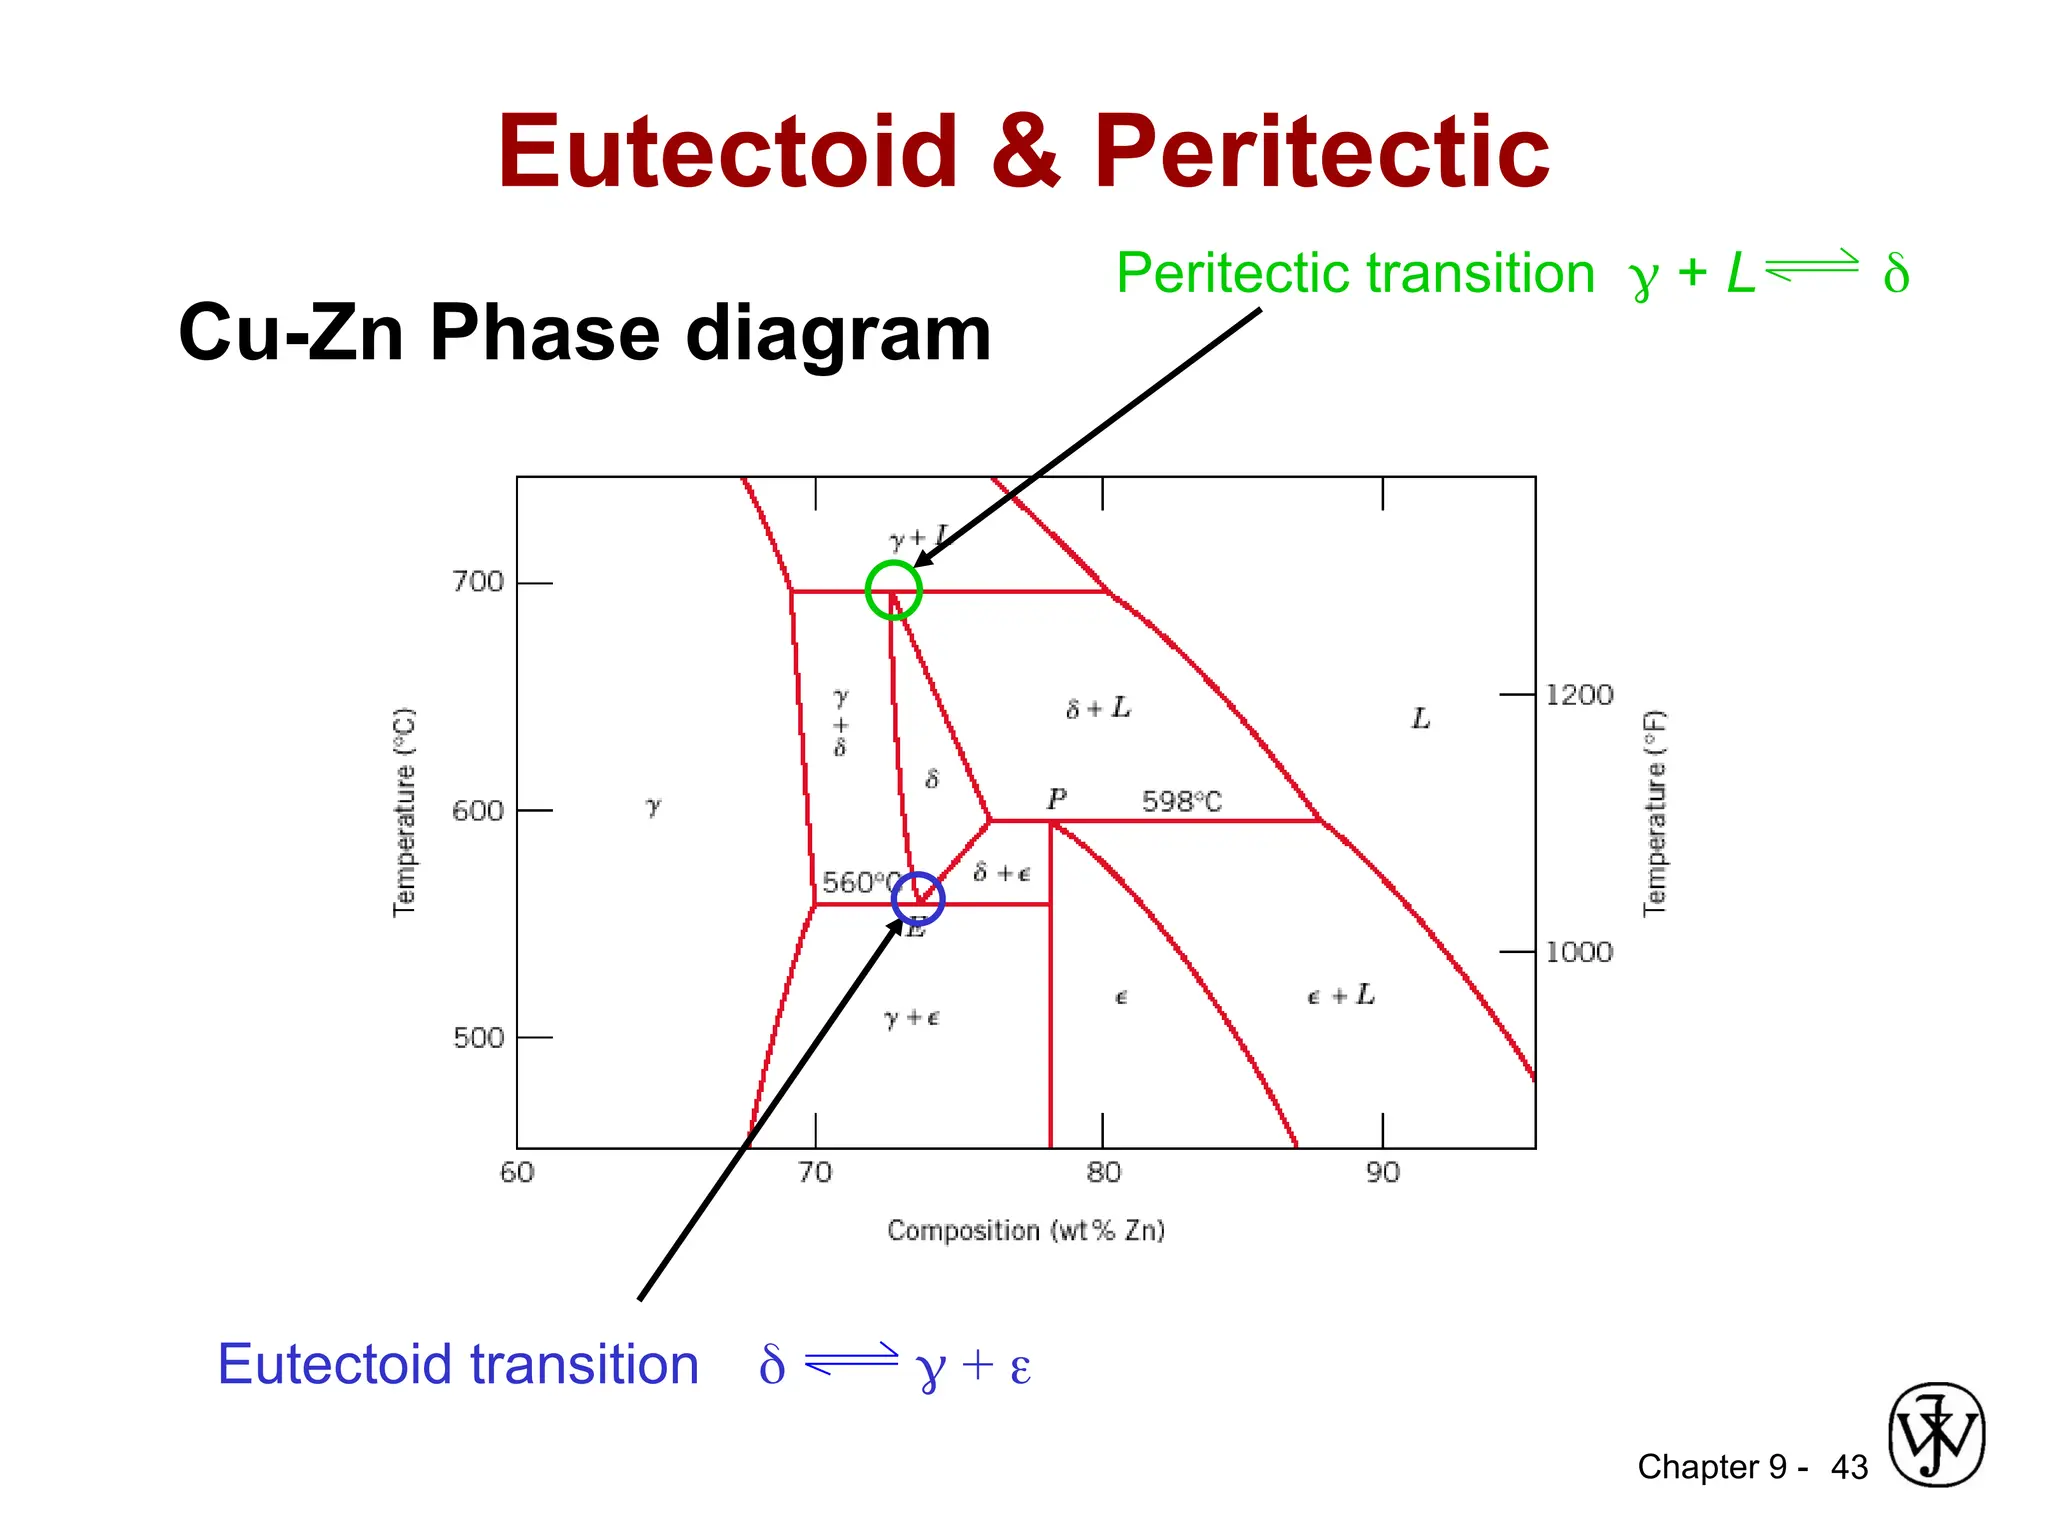
Eutectoid & Peritectic
• Eutectic - liquid in equilibrium with two solids
L +
cool
heat
intermetallic compound
- cementite
cool
heat
• Eutectoid - solid phase transforms into two solid
phases
S2 S1+S3
+ Fe3C
(727ºC)
cool
heat
• Peritectic - liquid + solid 1 solid 2 (Fig 9.21)
S1 + L S2
+ L
(1493ºC)
Invariants point: the different phases in equilibrium
( ex. Eutectic, eutectoid, peritectic)
Chapter 9 -
THEGIBBS PHASE RULE
44
Gibbs phase rule: For a system at equilibrium, an equation
that expresses the relationship between the number of
phases present and the number of externally controllable
variables.
Gibbs phase rule for construction of phase diagram
P is the number of phases present
F is the number of these variables that can be changed
independently without altering the number of phases
that coexist at equilibrium(T, p, C)
C is the number of components in the system.
N is the number of non compositional variables (e.g.,
temperature and pressure).(p=1atm constant, so N =1)
45.
Chapter 9 -45
Example: the copper–silver system
Since pressure is constant (1 atm), the parameter N is 1
(temperature is the only non compositional variable)
the number of components C is 2 (viz Cu and Ag),
Consider the case of single-phase fields on the phase
diagram (e.g., , , and liquid regions). Since only one phase is
present
This means that to completely describe the characteristics of
any alloy that exists within one of these phase fields, we
must specify two parameters; these are composition and
temperature, which locate, respectively, the horizontal and
vertical positions of the alloy on the phase diagram.
46.
Chapter 9 -
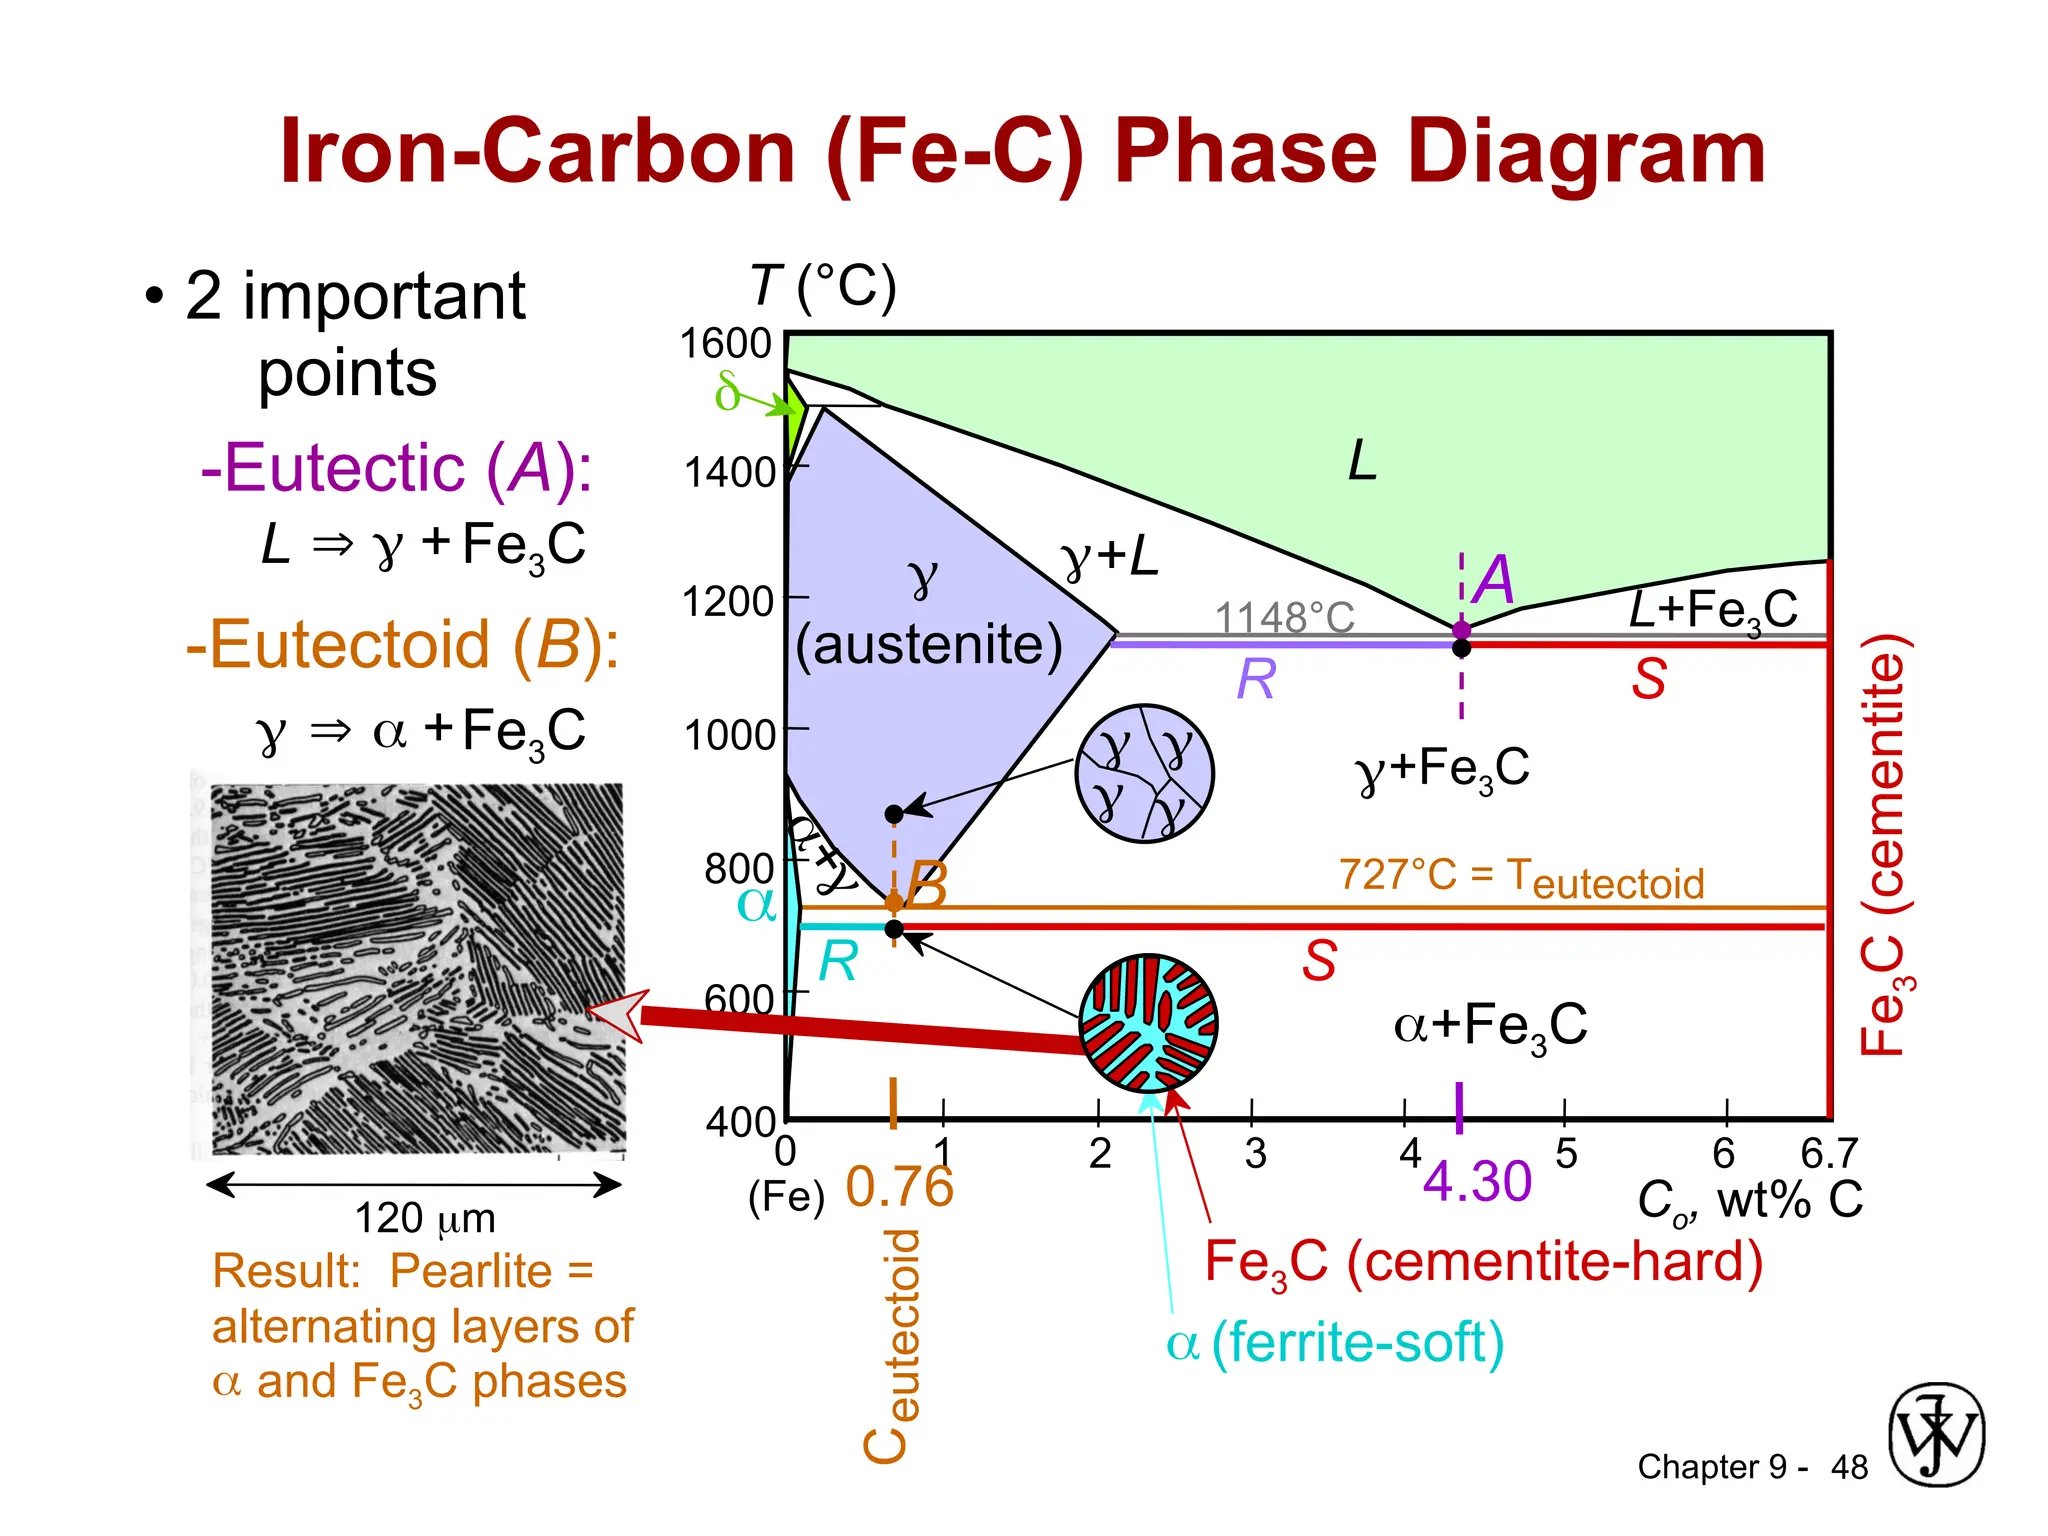
Iron-Carbon(Fe-C) Phase Diagram
46
In the classification scheme of ferrous alloys based on carbon
content, there are three types: iron, steel, and cast iron
1.Commercially pure iron contains less than 0.008 wt% C and,
from the phase diagram, is composed almost exclusively of
the ferrite phase at room temperature.
2. The iron–carbon alloys that contain between 0.008 and 2.14
wt% C are classified as steels. In most steels the
microstructure consists of both α and Fe3C phases.
3. Cast irons are classified as ferrous alloys that contain
between 2.14 and 6.70 wt% C. However, commercial cast
irons normally contain less than 4.5 wt% C
47.
Chapter 9 -47
Pure iron, upon heating, experiences two changes in crystal
structure before it melts.
1.At room temperature the stable form, called ferrite, or α
iron, has a BCC crystal structure.
2.At 912C (1674F ) Ferrite experiences a polymorphic
transformation to FCC austenite, or iron. This austenite
persists to 1394C (2541F), at which temperature the FCC
austenite reverts back to a BCC phase known as ferrite,
which finally melts at 1538C (2800F).
3. The composition axis extends only to 6.70 wt% C; at this
concentration the intermediate compound iron carbide, or
cementite (Fe3C), is formed, which is represented by a
vertical line on the phase diagram. Thus, the iron–carbon
system may be divided into two parts: an iron-rich portion,
and the other (not shown) for compositions between 6.70 and
100 wt% C (pure graphite). In practice, all steels and cast
irons have carbon contents less than 6.70 wt% C;
48.
Chapter 9 -48
Iron-Carbon (Fe-C) Phase Diagram
• 2 important
points
-Eutectoid (B):
+Fe3C
-Eutectic (A):
L +Fe3C
Fe
3
C
(cementite)
1600
1400
1200
1000
800
600
400
0 1 2 3 4 5 6 6.7
L
(austenite)
+L
+Fe3C
+Fe3C
+
L+Fe3C
(Fe) Co, wt% C
1148°C
T (°C)
727°C = Teutectoid
A
S
R
4.30
Result: Pearlite =
alternating layers of
and Fe3C phases
120 m
R S
0.76
C
eutectoid
B
Fe3C (cementite-hard)
(ferrite-soft)
49.
Chapter 9 -49
The two-phase regions are labeled in Figure.
1. It may be noted that one eutectic exists for the iron–iron
carbide system, at 4.30 wt% C and 1147C (2097F); for this
eutectic reaction,
the liquid solidifies to form austenite and cementite phases.
Of course, subsequent cooling to room temperature will
promote additional phase changes.
2. It may be noted that a eutectoid invariant point exists at a
composition of 0.76 wt% C and a temperature of 727C
(1341F). This eutectoid reaction may be represented by
50.
Chapter 9 -50
Hypoeutectoid Steel
Fe
3
C
(cementite)
1600
1400
1200
1000
800
600
400
0 1 2 3 4 5 6 6.7
L
(austenite)
+L
+ Fe3C
+ Fe3C
L+Fe3C
(Fe) Co, wt% C
1148°C
T (°C)
727°C
(Fe-C
System)
C0
0.76
proeutectoid ferrite
pearlite
100 m
Hypoeutectoid
steel
R S
w =S/(R+S)
wFe3C =(1-w)
wpearlite = w
pearlite
r s
w =s/(r+s)
w =(1- w)
51.
Chapter 9 -51
Hypereutectoid Steel
Fe
3
C
(cementite)
1600
1400
1200
1000
800
600
400
0 1 2 3 4 5 6 6.7
L
(austenite)
+L
+Fe3C
+Fe3C
L+Fe3C
(Fe) Co, wt%C
1148°C
T(°C)
(Fe-C
System)
0.76
Co
Adapted from Fig. 9.33,Callister 7e.
proeutectoid Fe3C
60 mHypereutectoid
steel
pearlite
R S
w =S/(R+S)
wFe3C =(1-w)
wpearlite = w
pearlite
s
r
wFe3C =r/(r+s)
w =(1-w Fe3C )
Fe3C
52.
Chapter 9 -52
Example: Phase Equilibria
For a 99.6 wt% Fe-0.40 wt% C at a temperature
just below the eutectoid, determine the
following
a) composition of Fe3C and ferrite ()
b) the amount of carbide (cementite) in grams
that forms per 100 g of steel
c) the amount of pearlite and proeutectoid
ferrite ()
53.
Chapter 9 -53
Chapter 9 – Phase Equilibria
Solution:
g
3
.
94
g
5.7
C
Fe
g
7
.
5
100
022
.
0
7
.
6
022
.
0
4
.
0
100
x
C
Fe
C
Fe
3
C
Fe
3
3
3
x
C
C
C
Co
b) the amount of carbide
(cementite) in grams that
forms per 100 g of steel
a) composition of Fe3C and ferrite ()
CO = 0.40 wt% C
C = 0.022 wt% C
CFe C = 6.70 wt% C
3
Fe
C
(cementite)
1600
1400
1200
1000
800
600
400
0 1 2 3 4 5 6 6.7
L
(austenite)
+L
+ Fe3C
+ Fe3C
L+Fe3C
Co, wt% C
1148°C
T(°C)
727°C
CO
R S
CFe C
3
C
54.
Chapter 9 -54
Chapter 9 – Phase Equilibria
c. the amount of pearlite and proeutectoid ferrite ()
note: amount of pearlite = amount of just above TE
Co = 0.40 wt% C
C = 0.022 wt% C
Cpearlite = C = 0.76 wt% C
Co C
C C
x 100 51.2 g
pearlite = 51.2 g
proeutectoid = 48.8 g
Fe
C
(cementite)
1600
1400
1200
1000
800
600
400
0 1 2 3 4 5 6 6.7
L
(austenite)
+L
+ Fe3C
+ Fe3C
L+Fe3C
Co, wt% C
1148°C
T(°C)
727°C
CO
R S
C
C
55.
Chapter 9 -55
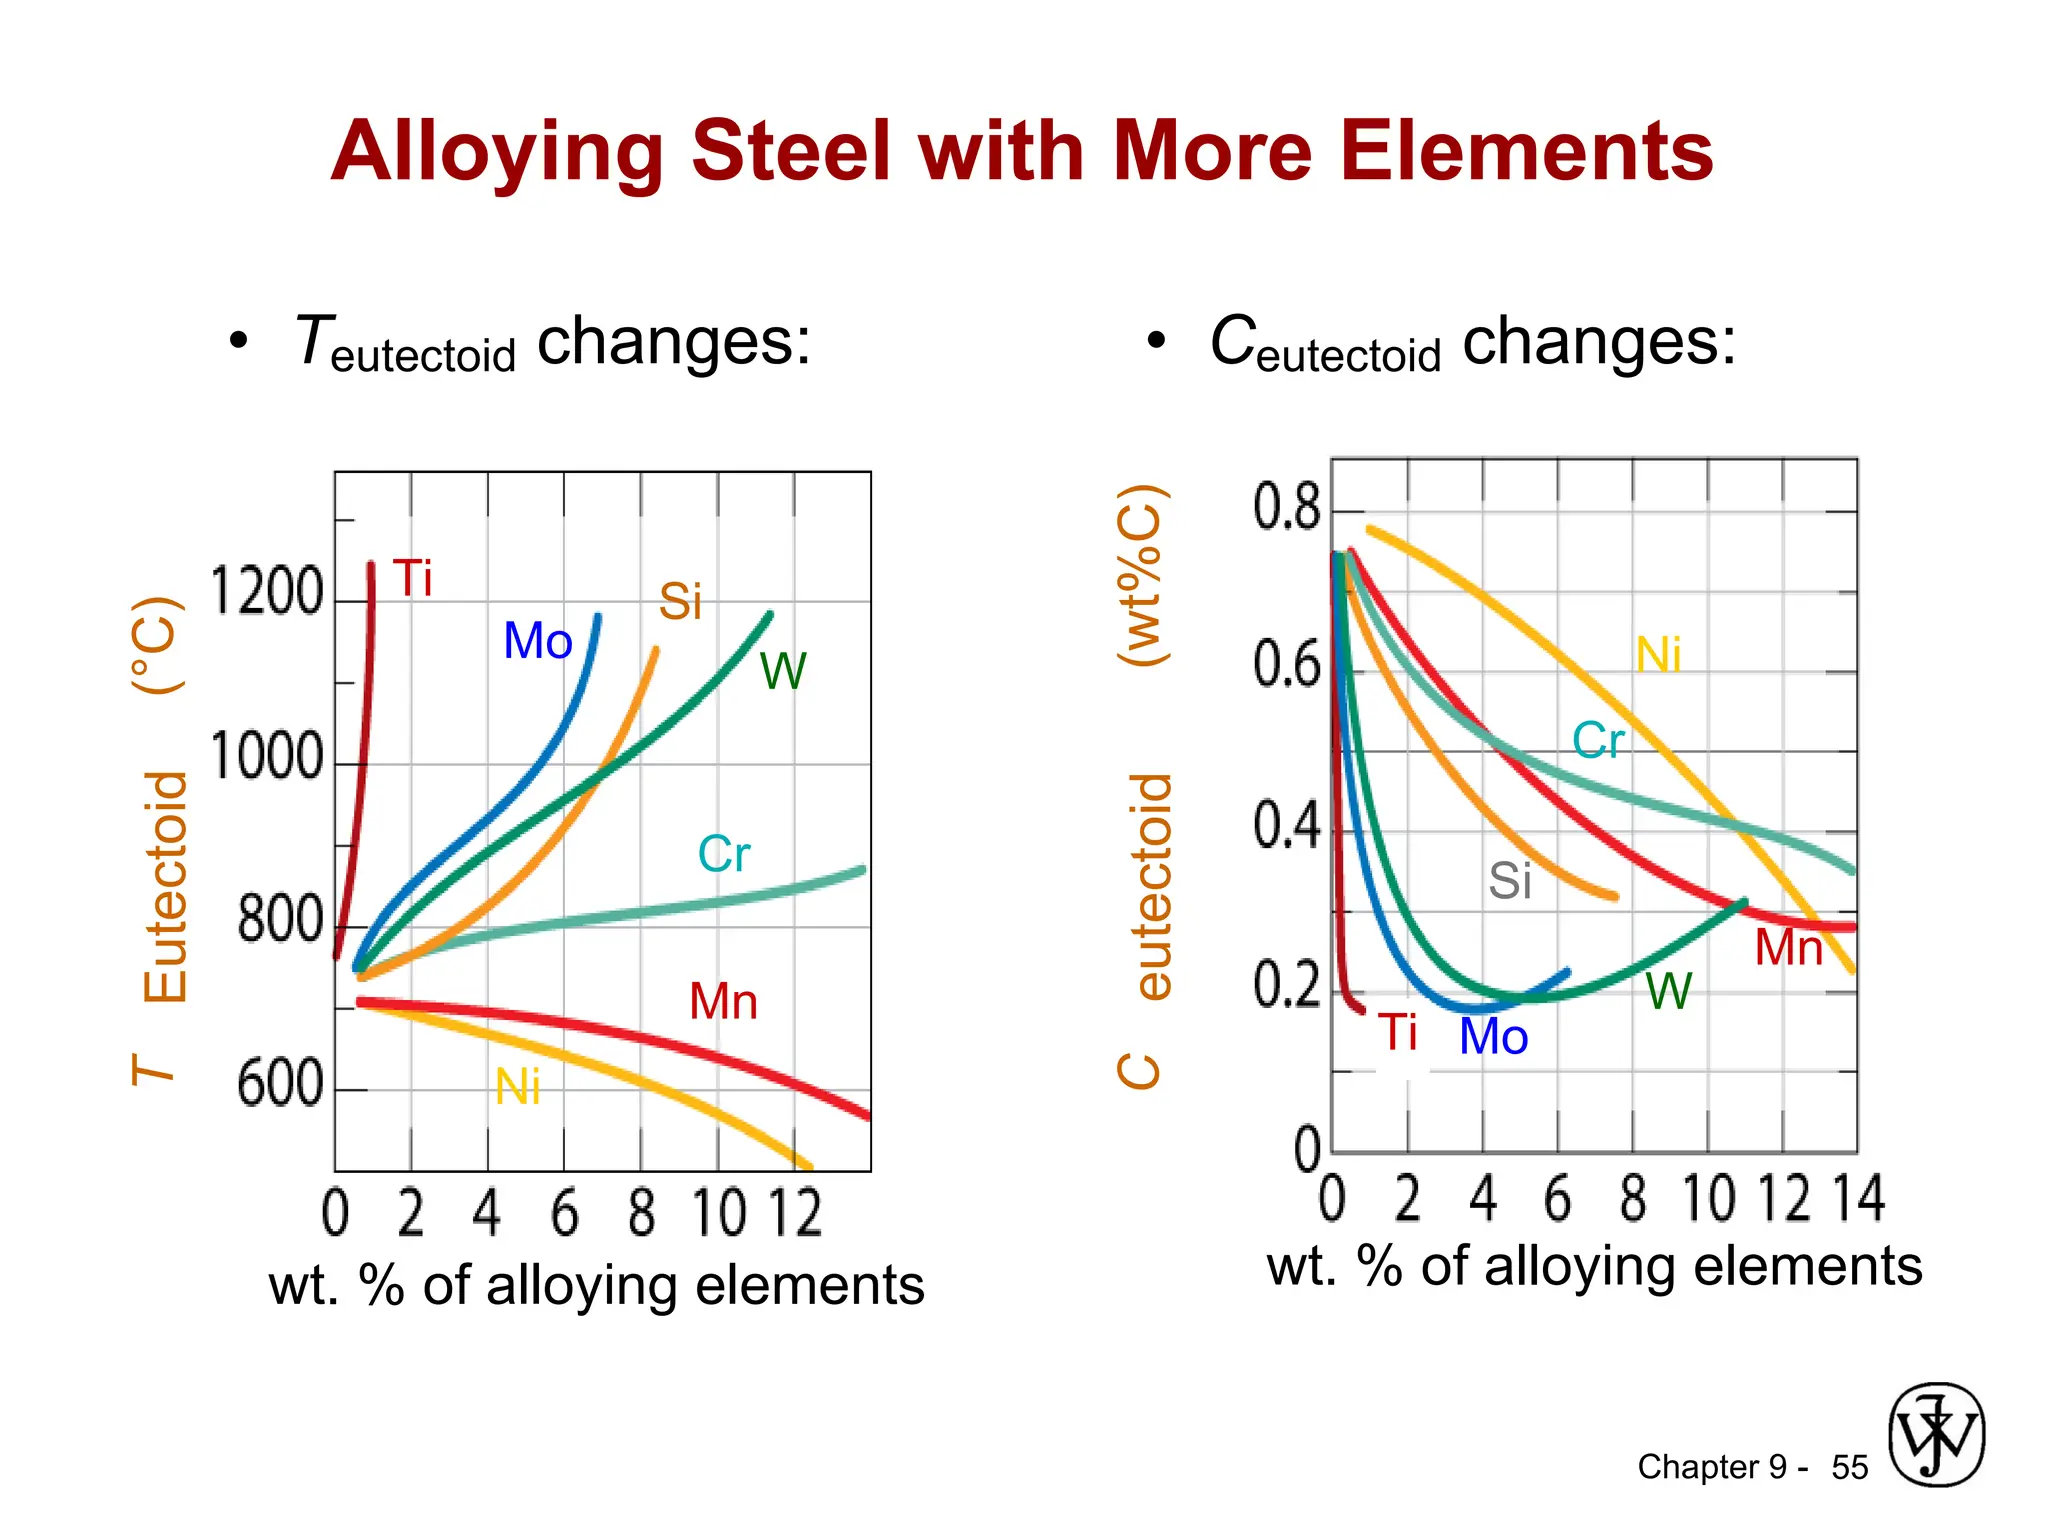
Alloying Steel with More Elements
• Teutectoid changes: • Ceutectoid changes:
T
Eutectoid
(°C)
wt. % of alloying elements
Ti
Ni
Mo
Si
W
Cr
Mn
wt. % of alloying elements
C
eutectoid
(wt%C)
Ni
Ti
Cr
Si
Mn
W
Mo
56.
Chapter 9 -56
• Phase diagrams are useful tools to determine:
--the number and types of phases,
--the wt% of each phase,
--and the composition of each phase
for a given T and composition of the system.
• Alloying to produce a solid solution usually
--increases the tensile strength (TS)
--decreases the ductility.
• Binary eutectics and binary eutectoids allow for
a range of microstructures.
• Steels are alloyed for:
--improve their corrosion resistance
--to render them amenable to heat treatment
Summary


![Chapter 9 -
Binary-Eutectic Systems
25
Depending on composition, several different types of
microstructures are possible for the slow cooling of alloys
belonging to binary eutectic systems.
Ex. Lead(Pb)–tin(Sn) phase diagram
• The first case is for compositions ranging between a
pure component and the maximum solid solubility for that
component at room temperature [20C (70F)].
For the lead–tin system, this includes lead-rich alloys
containing between 0 and about 2 wt% Sn (for the phase
solid solution), and also between approximately 99 wt% Sn
and pure tin (for the β phase)](https://image.slidesharecdn.com/ch09-250509094102-64656f15/75/Phase-equibllurium-diagram-material-scienceppt-25-2048.jpg)