Download as PDF, PPTX

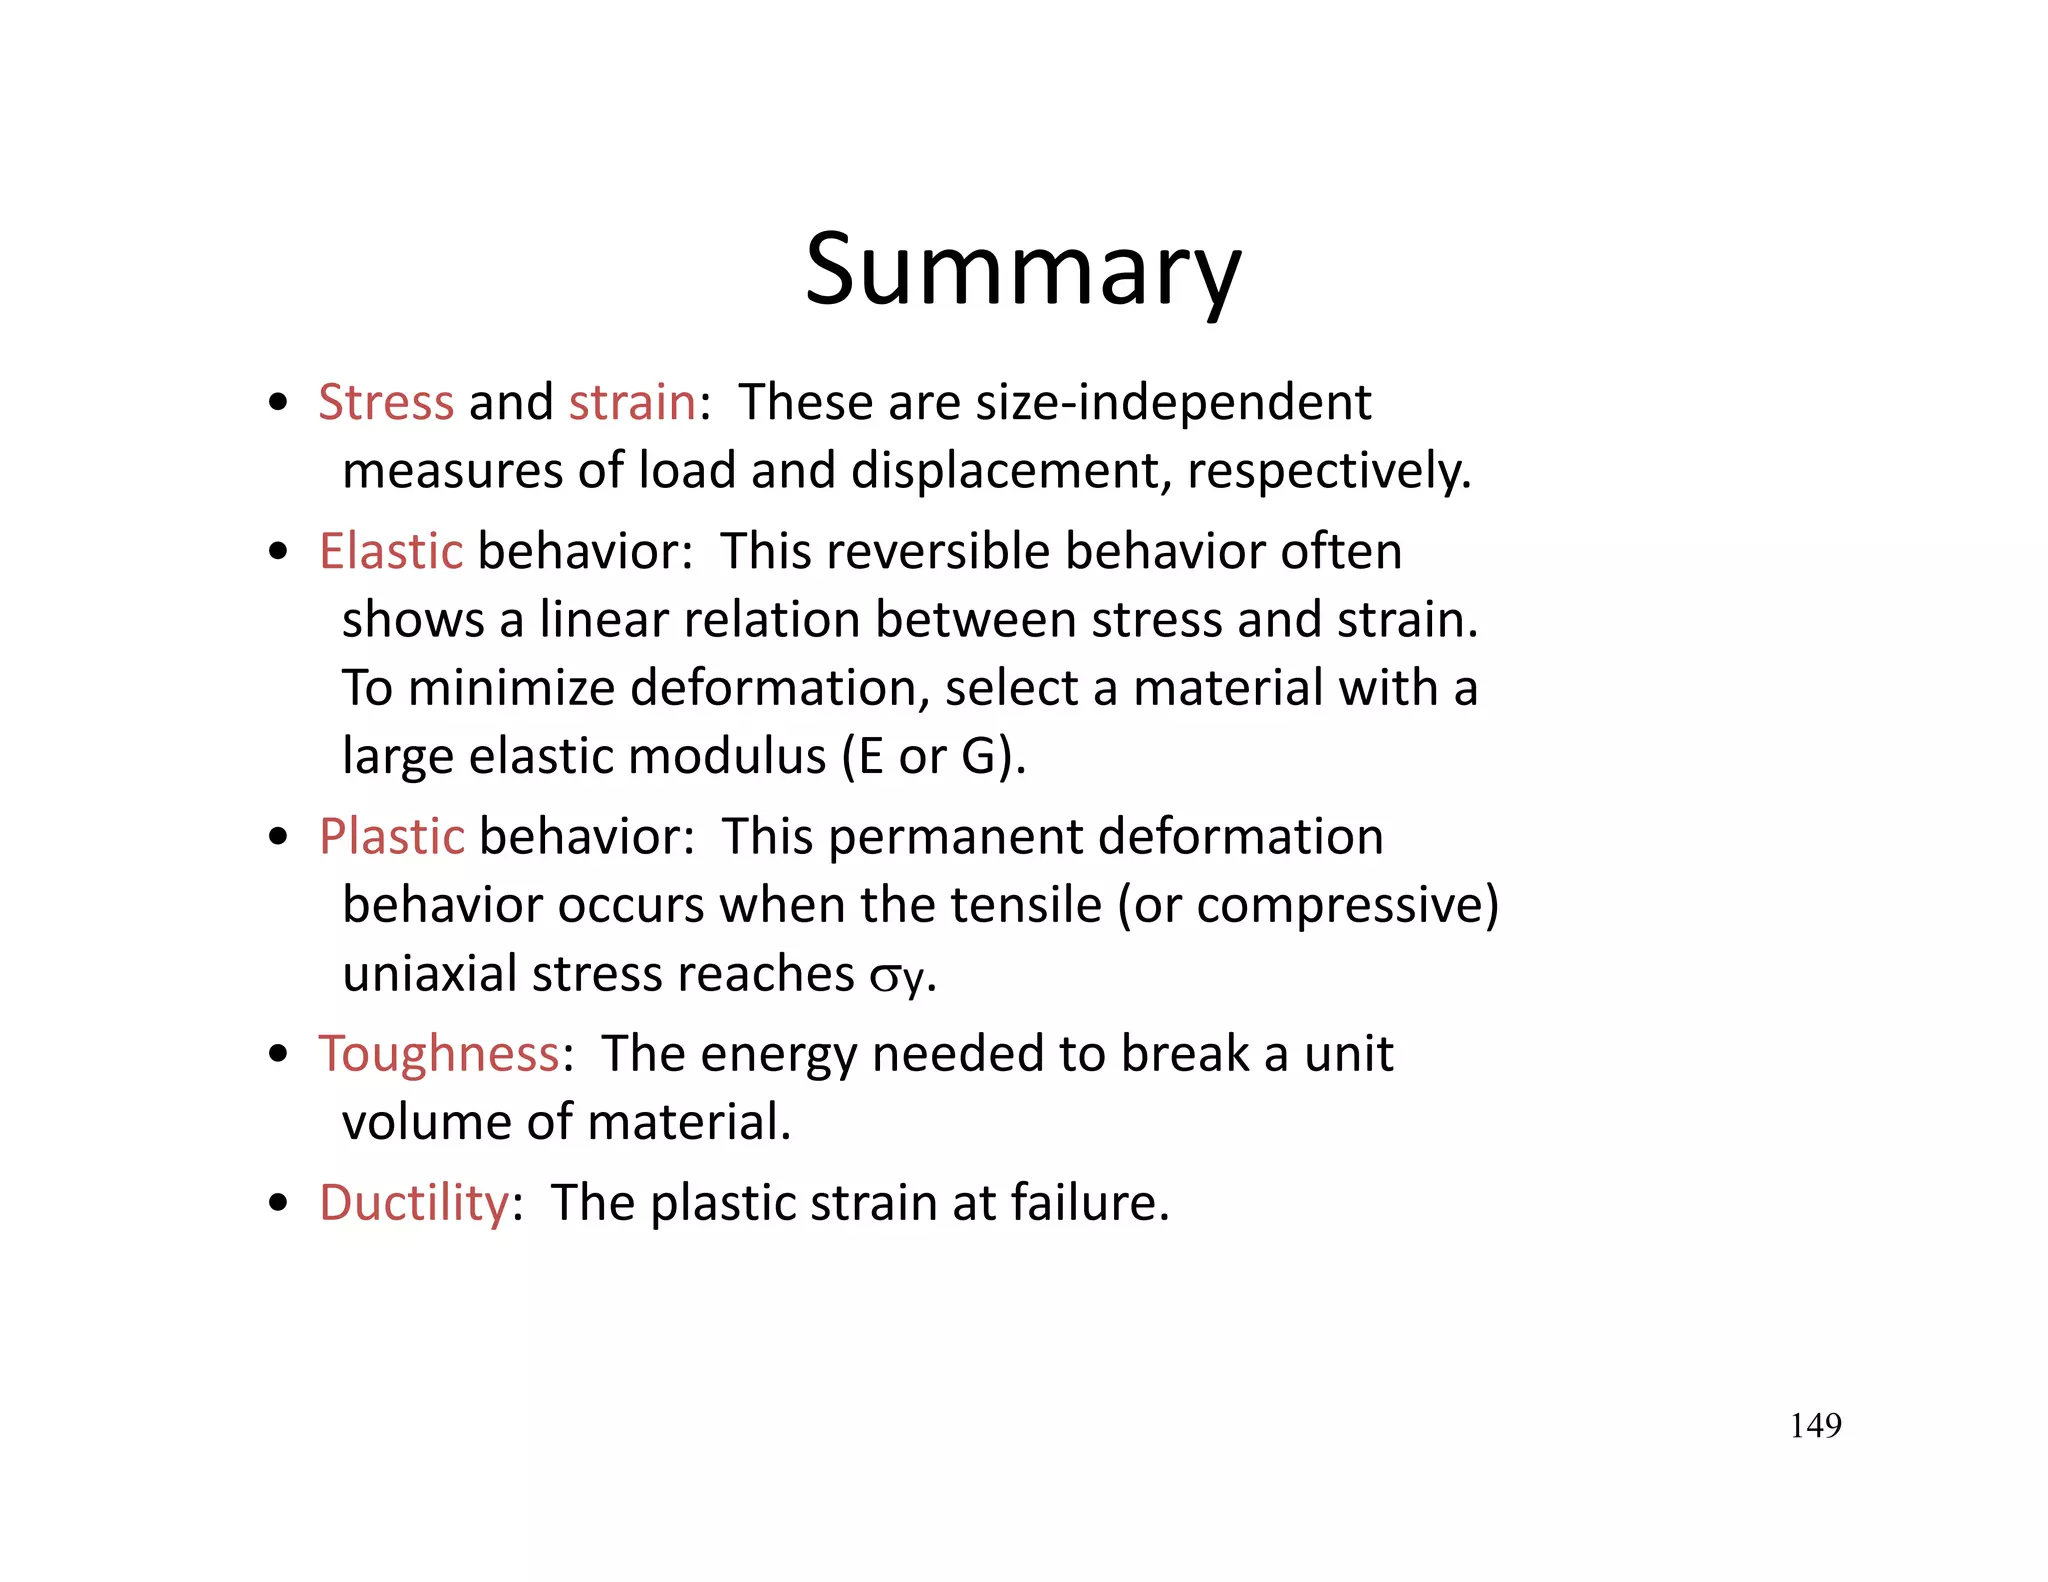
![• CO1 :Explain basic concepts of structure, mechanical and physical
properties of engineering materials. [PO1, LO1].
• CO2 ;Apply the basics concepts to identify the relationships
between properties and structure of materials. [PO3, LO3, SS1].
• CO3 :Choose the suitable material for appropriate engineering
applications. [PO3, LO3, SS1].
Course Outcome](https://image.slidesharecdn.com/9cztb0vaqk6kf4x1vwe8-signature-d98e614c44bb5d5fcfc79eb5ed8fdbf00bc1e22d961d7a0f5fed49408756051c-poli-140724113841-phpapp02/75/Mec281-lecture-3-2048.jpg)


![TRANSITION ELEMENT
Cr [Z = 24] 1s2 2s2 2p6 3s2 3p6 4s1 3d5 (correct) halfly filled
Mo [Z = 42] … 5s1 4d5 (correct) halfly filled
Cu [Z = 29] 1s2 2s2 2p6 3s2 3p6 4s1 3d10 (correct) completely filled
Ag [Z = 47] … 5s1 4d10 (correct) completely filled
Au [Z = 79] …6s1 5d10 (correct) completely filled](https://image.slidesharecdn.com/9cztb0vaqk6kf4x1vwe8-signature-d98e614c44bb5d5fcfc79eb5ed8fdbf00bc1e22d961d7a0f5fed49408756051c-poli-140724113841-phpapp02/75/Mec281-lecture-34-2048.jpg)
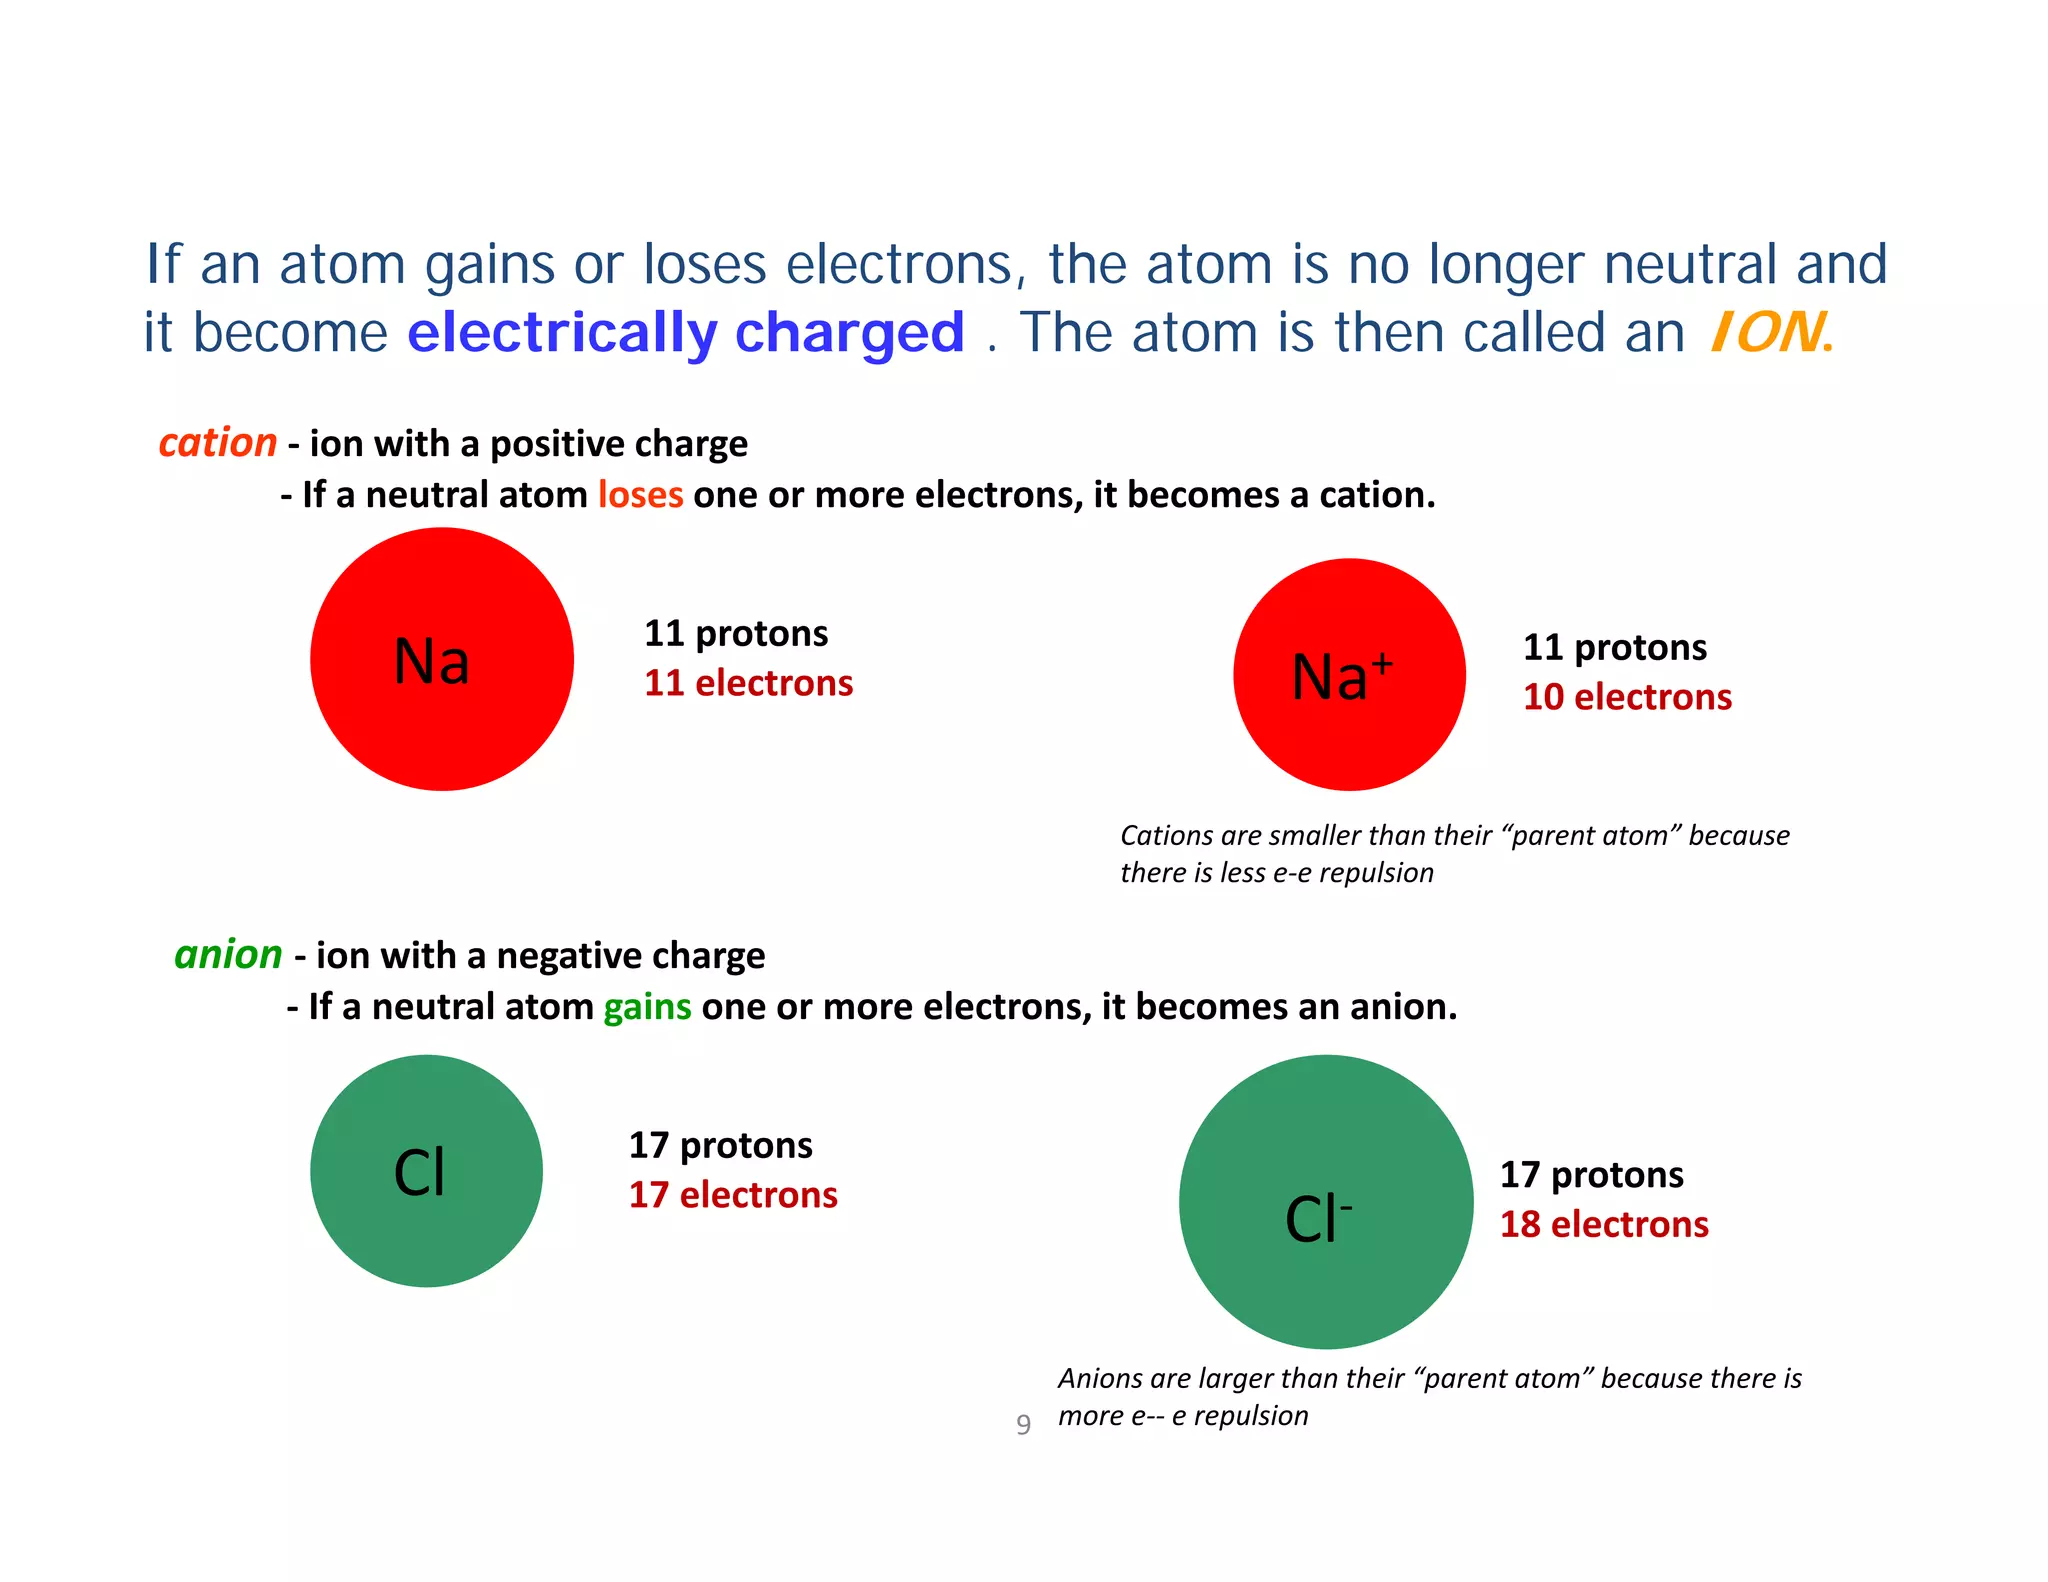
![Answer: TEST 1 [July 2011]
1a] With the aid of sketches, describe the Bohr Model of the
sodium [Na] and its ion in terms of valence electron , number of
electron and shell.
[4 marks]](https://image.slidesharecdn.com/9cztb0vaqk6kf4x1vwe8-signature-d98e614c44bb5d5fcfc79eb5ed8fdbf00bc1e22d961d7a0f5fed49408756051c-poli-140724113841-phpapp02/75/Mec281-lecture-36-2048.jpg)
![Exercise : Final Exam [April 2008]
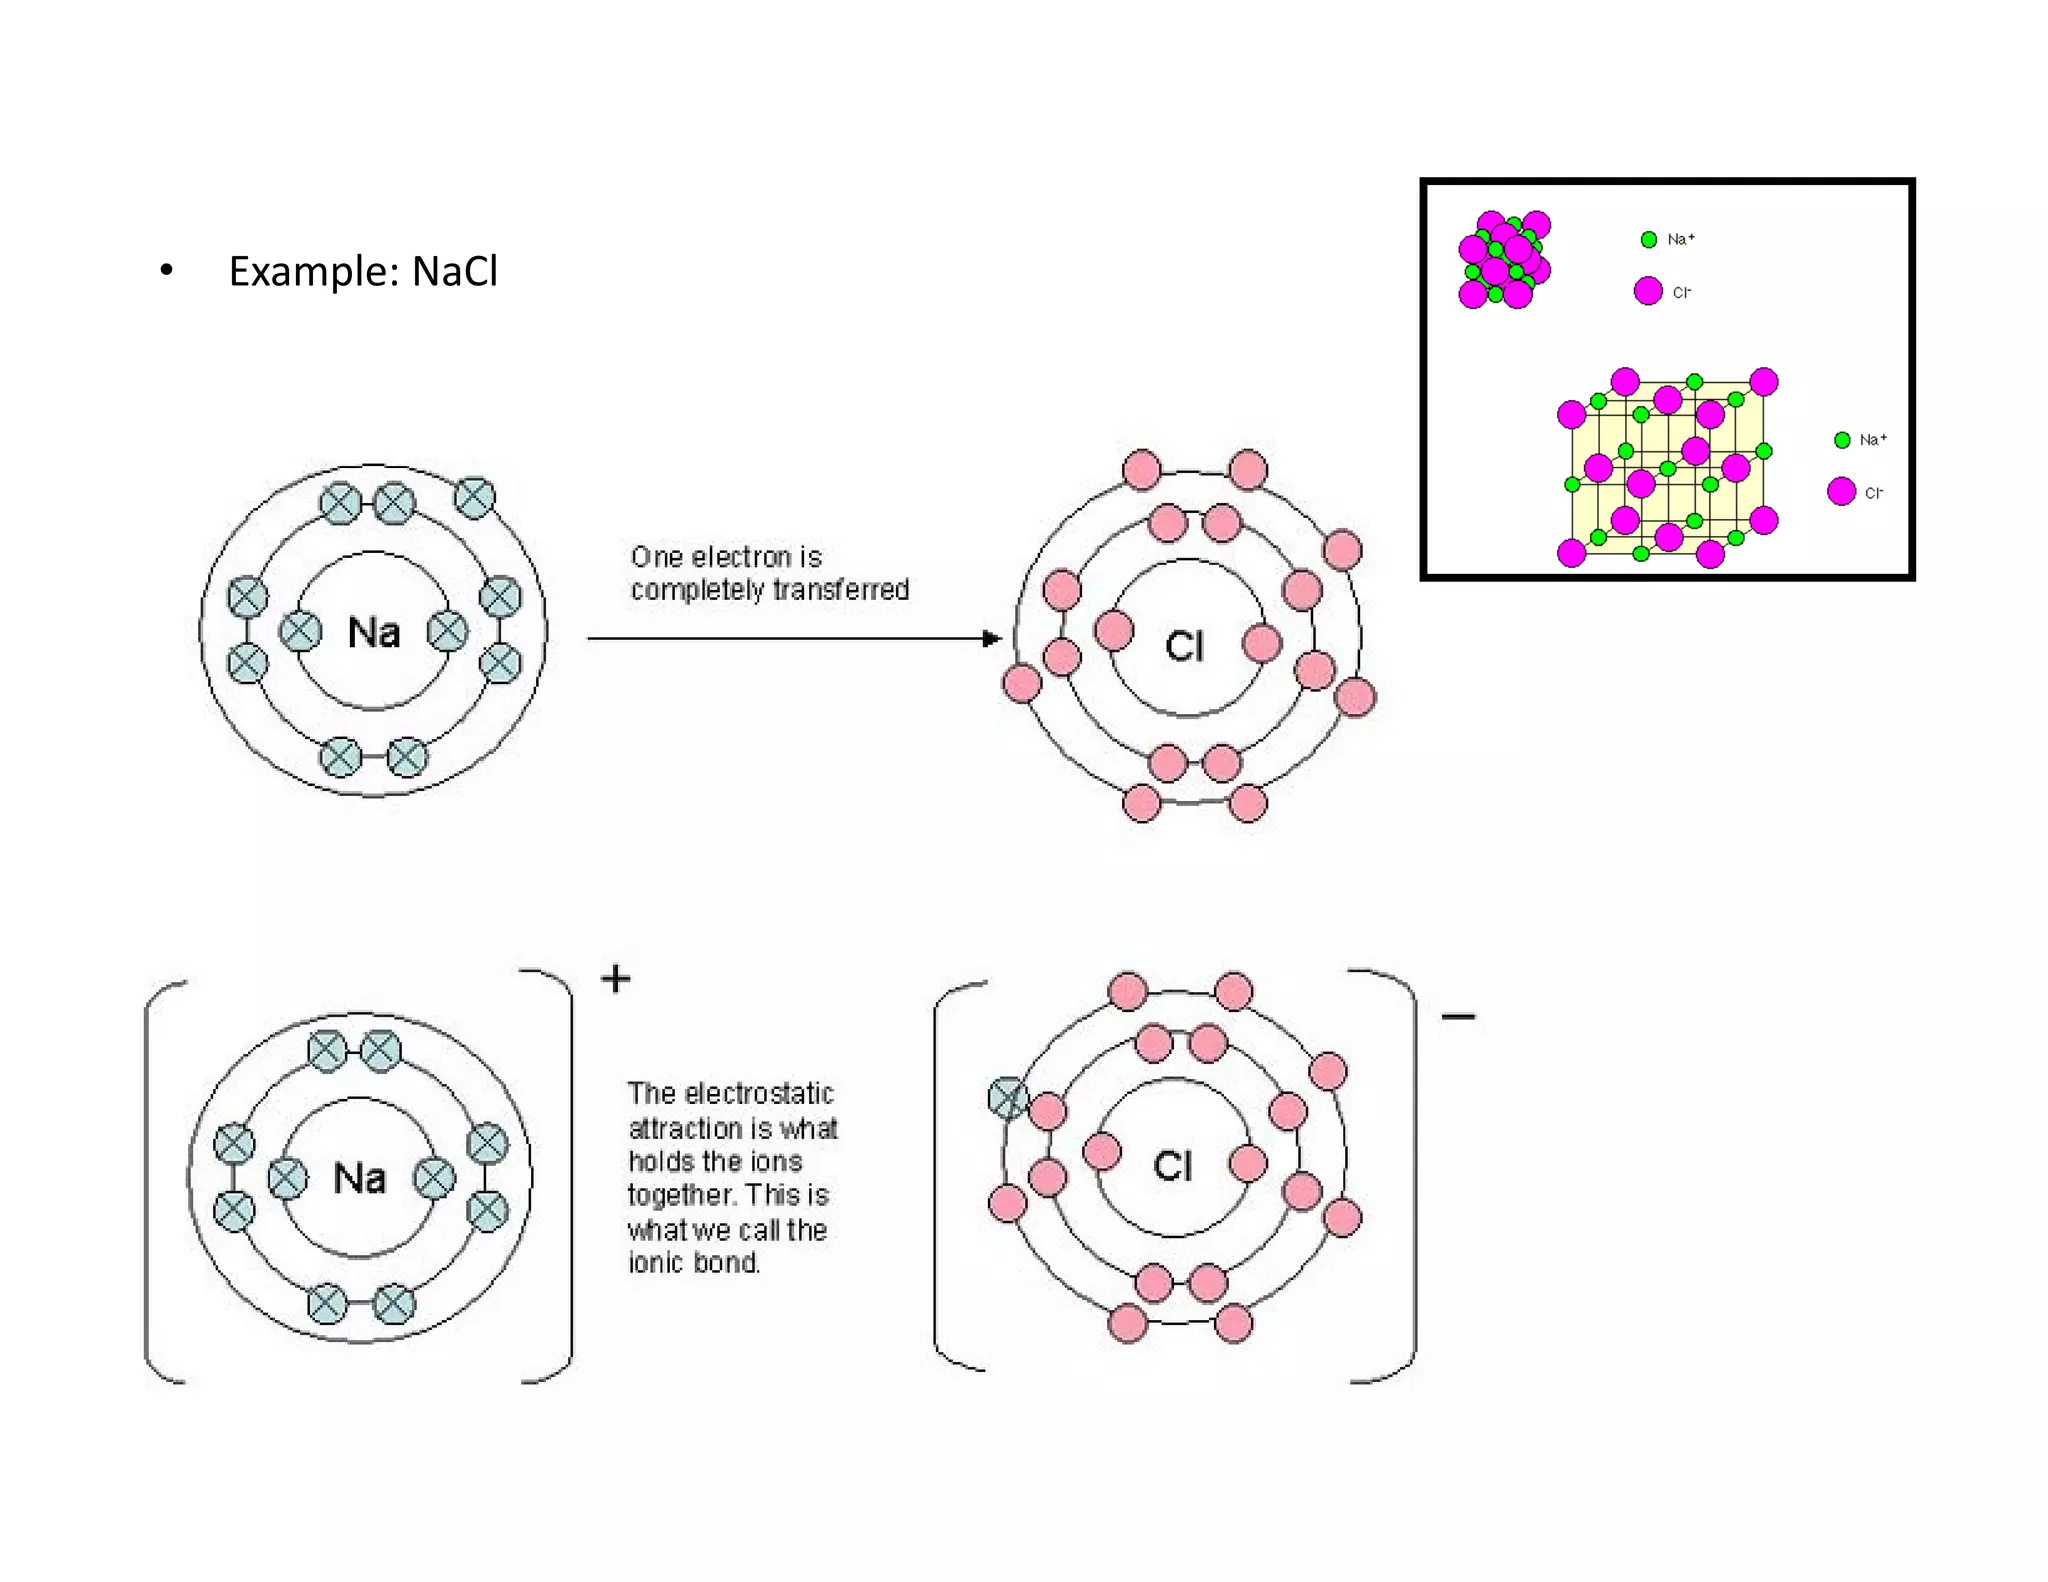
1c] With the aid of sketches, describe how Sodium and Chlorine
atoms are joined.
[3 marks]](https://image.slidesharecdn.com/9cztb0vaqk6kf4x1vwe8-signature-d98e614c44bb5d5fcfc79eb5ed8fdbf00bc1e22d961d7a0f5fed49408756051c-poli-140724113841-phpapp02/75/Mec281-lecture-42-2048.jpg)
![Exercise : Final Exam [March 2002]
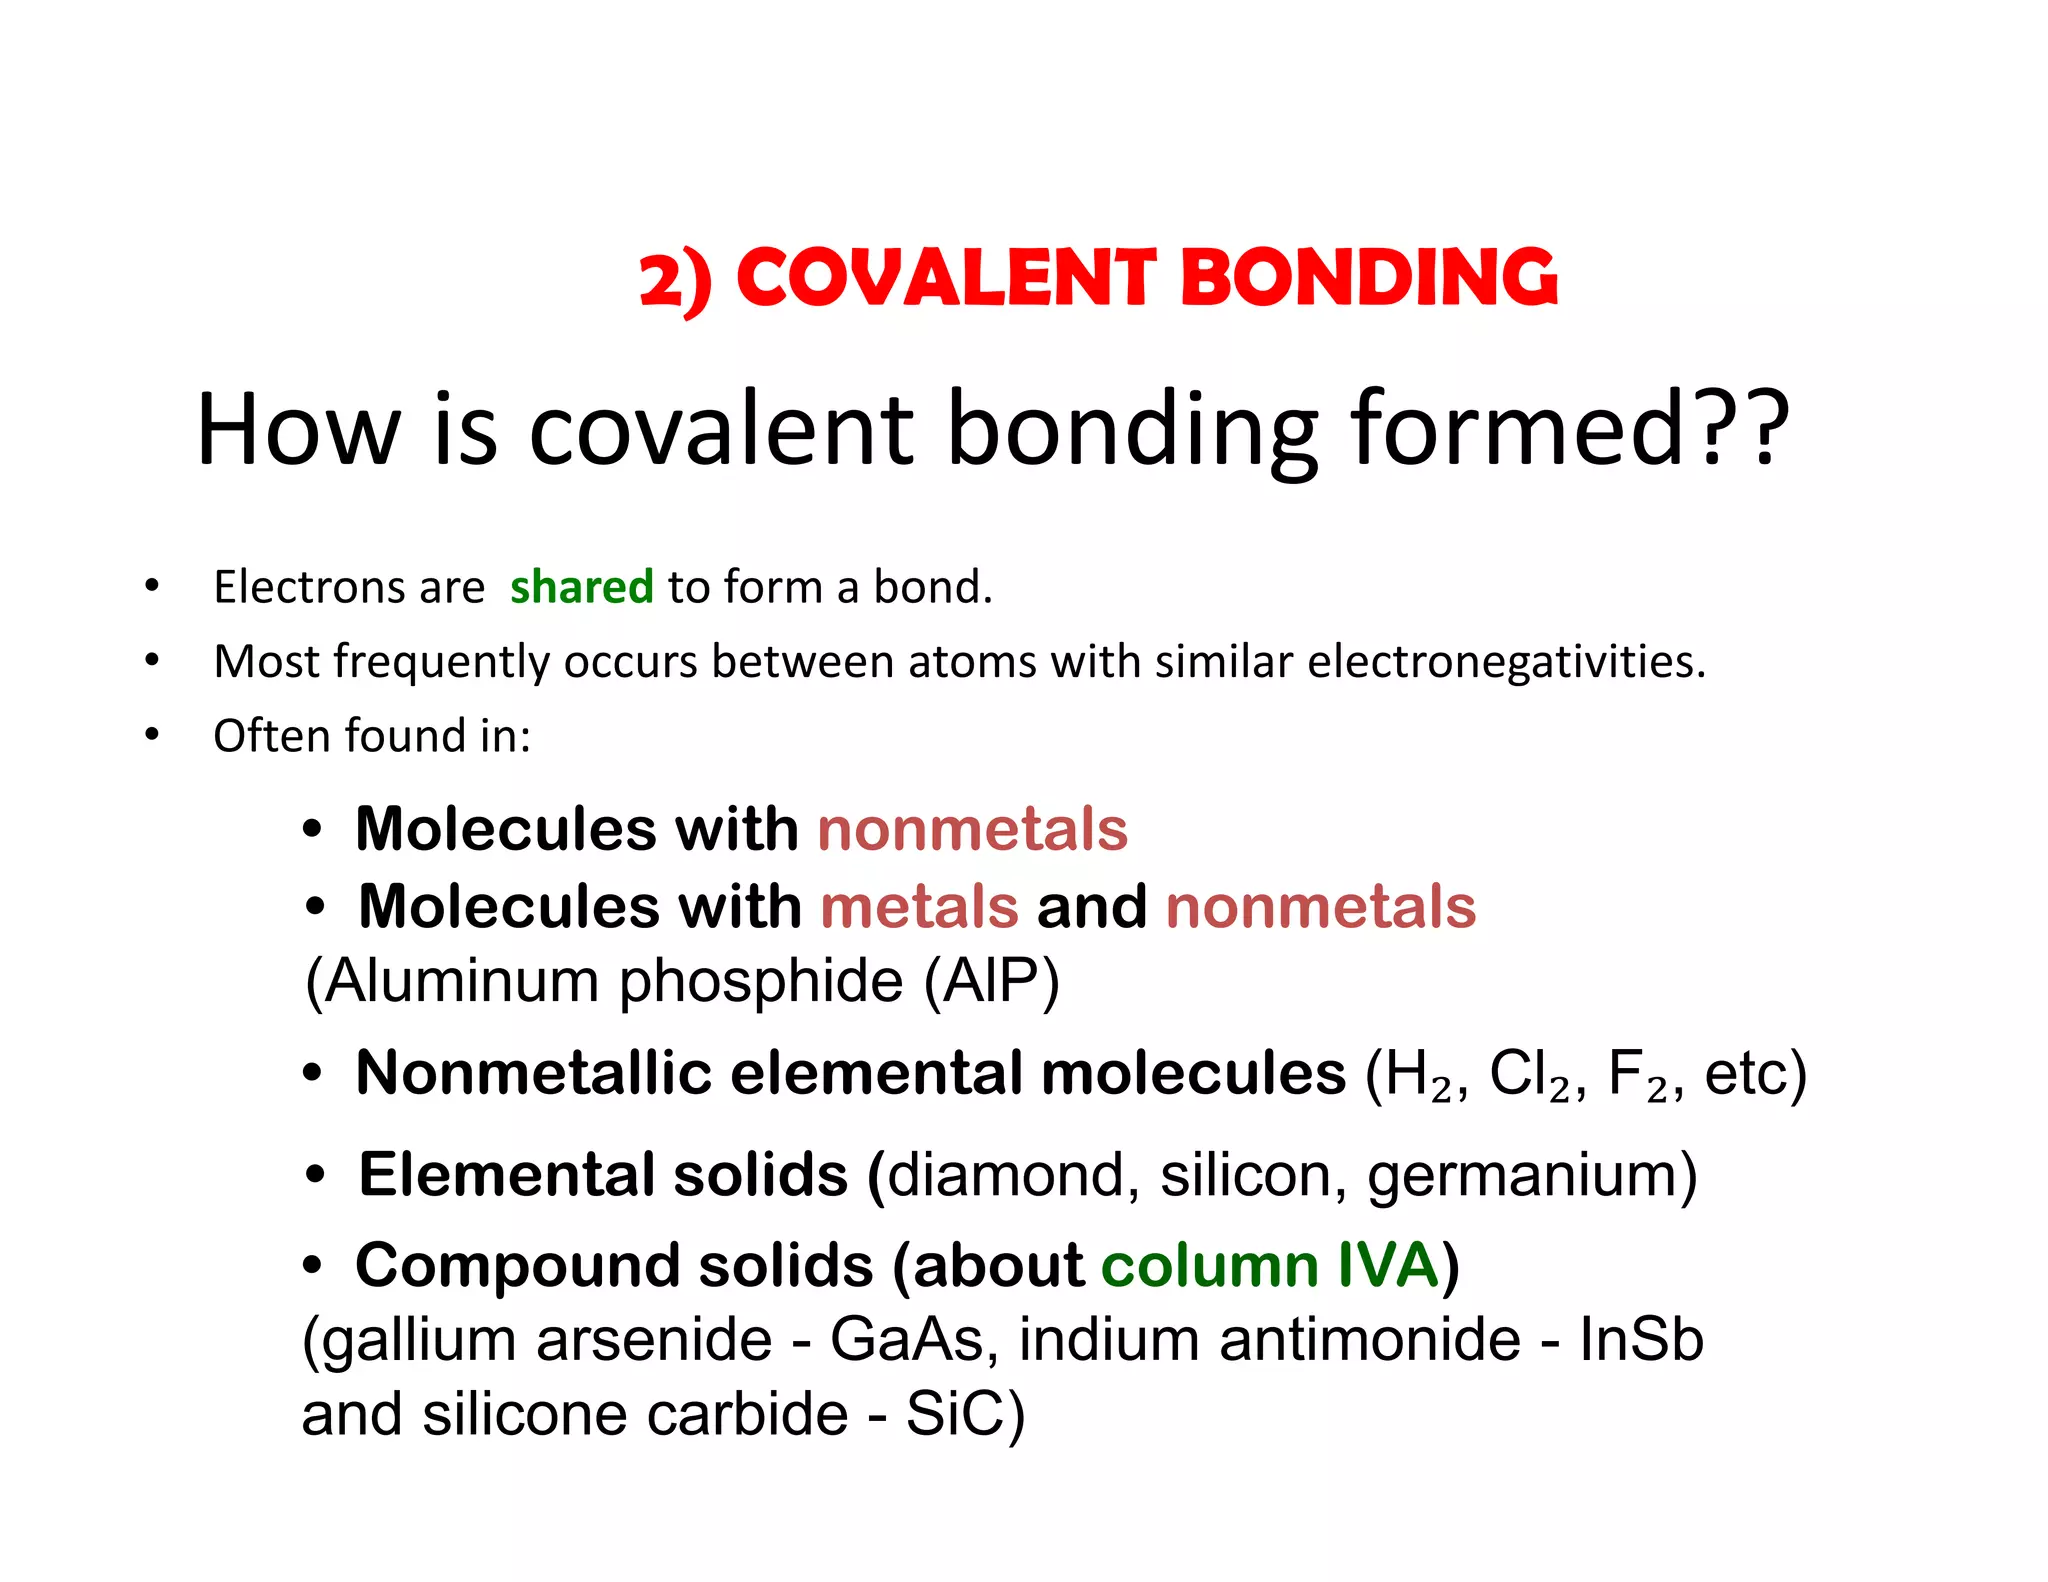
1a] Briefly describe differences between metallic bond and covalent bond.
Support your answer with an example and simple sketch.
(7 Marks)](https://image.slidesharecdn.com/9cztb0vaqk6kf4x1vwe8-signature-d98e614c44bb5d5fcfc79eb5ed8fdbf00bc1e22d961d7a0f5fed49408756051c-poli-140724113841-phpapp02/75/Mec281-lecture-59-2048.jpg)
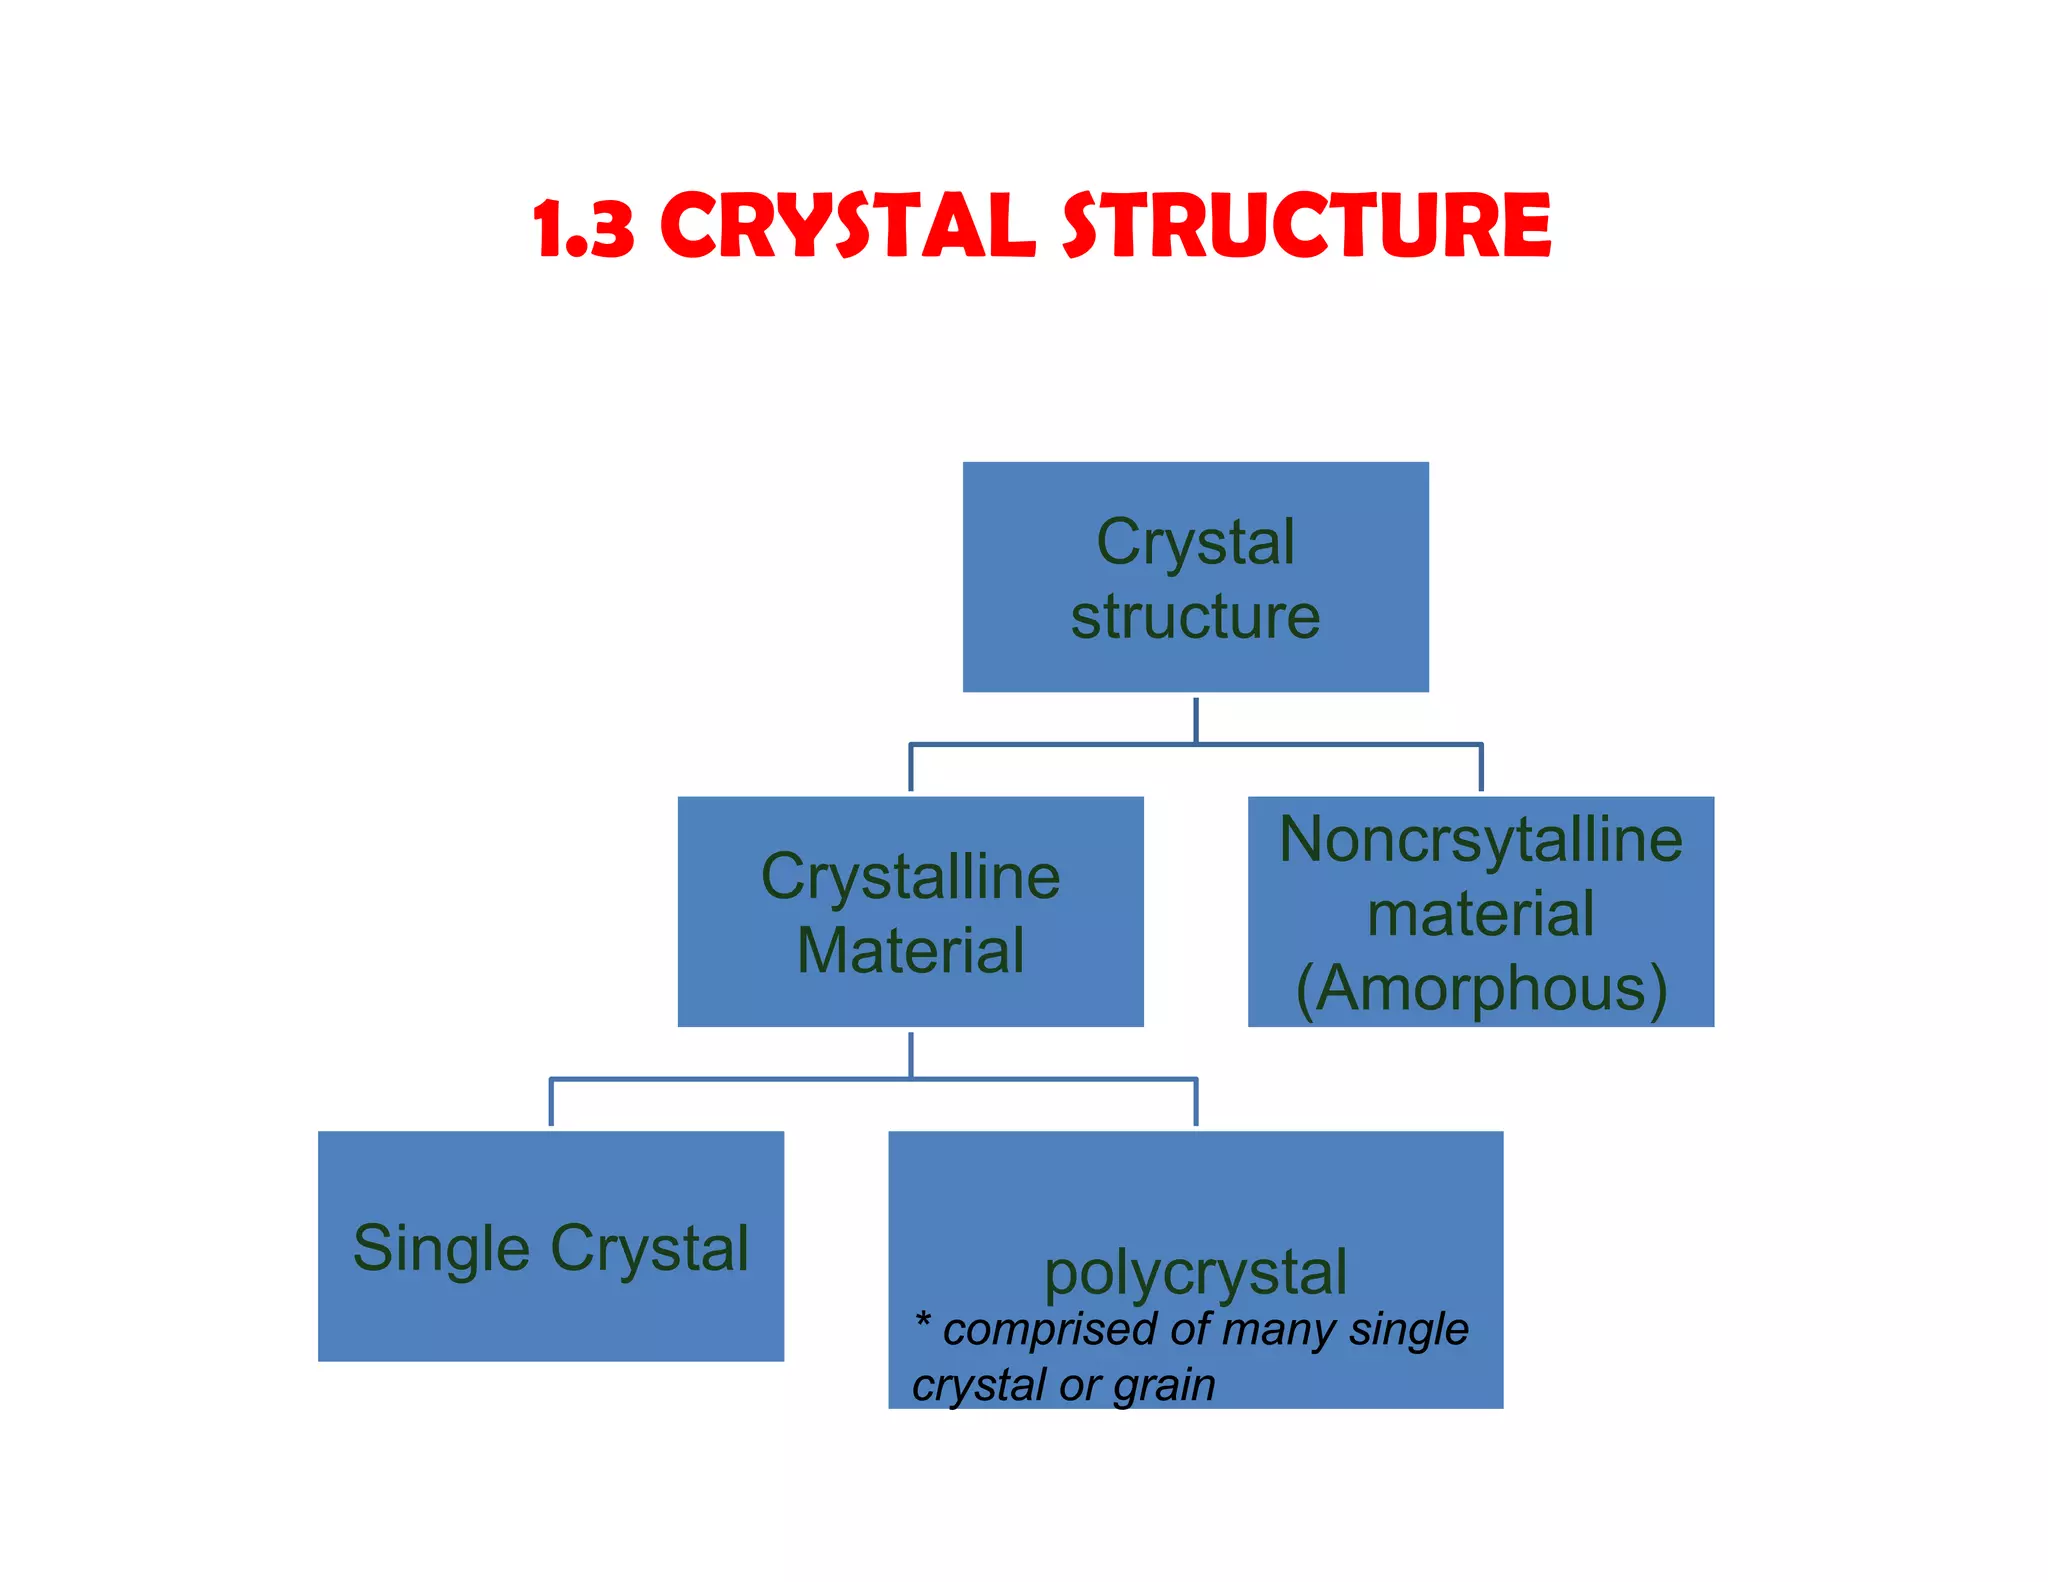
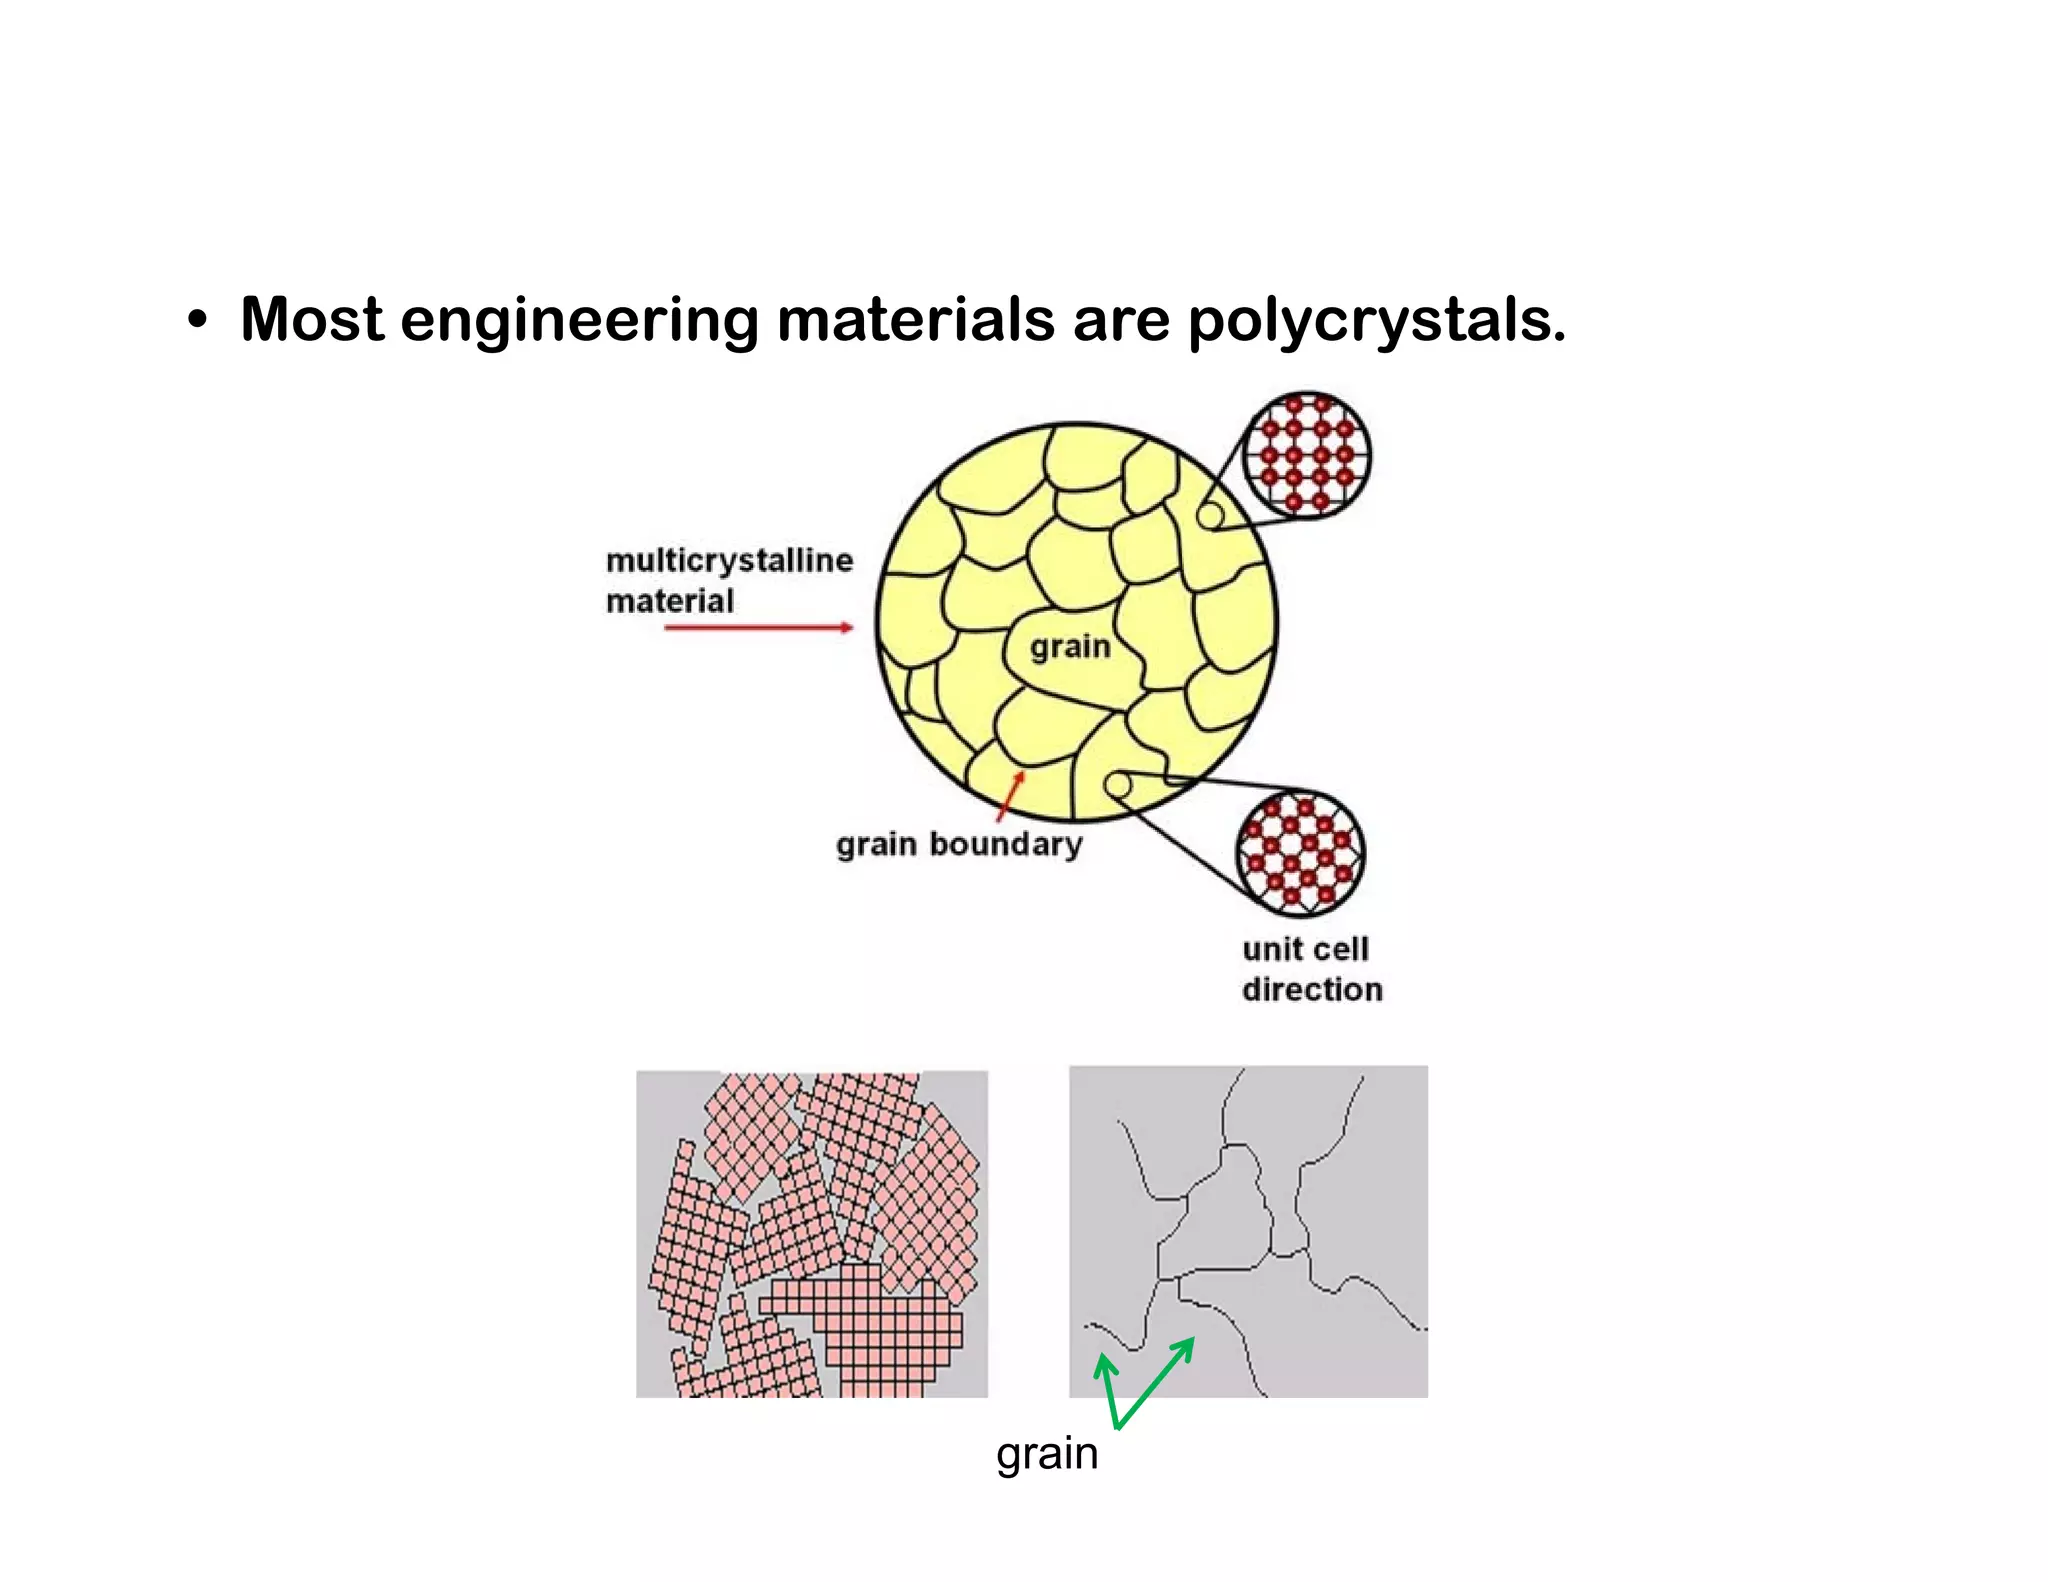
![1a] With the aid of sketches, explain the following terms :
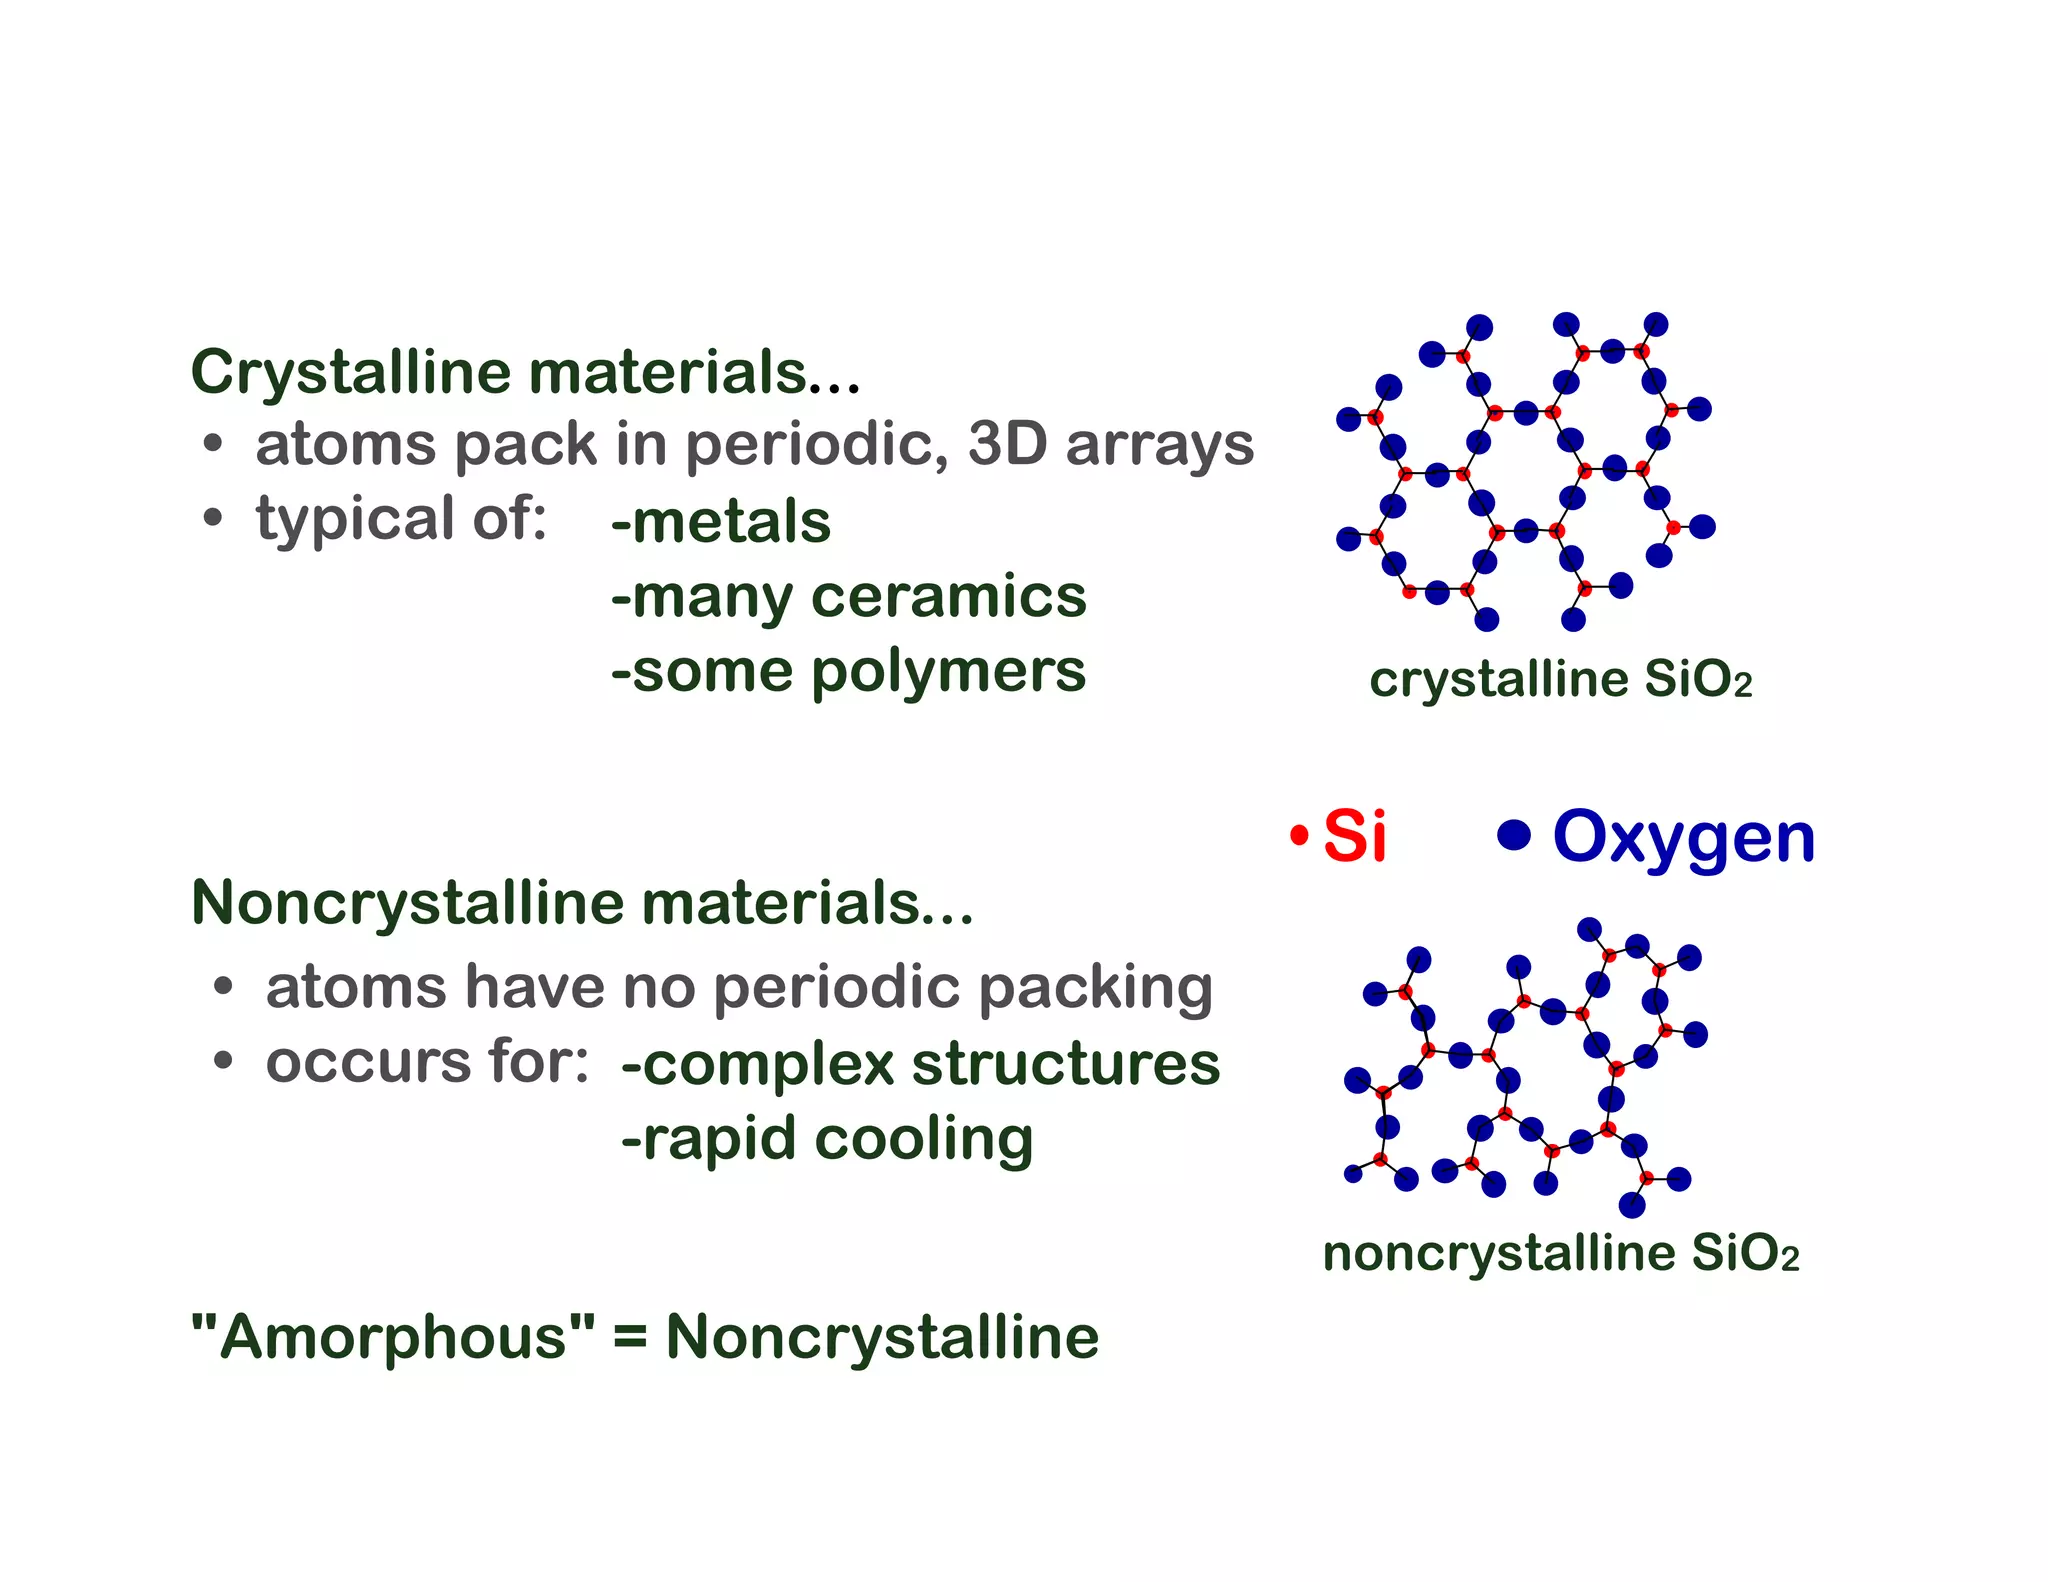
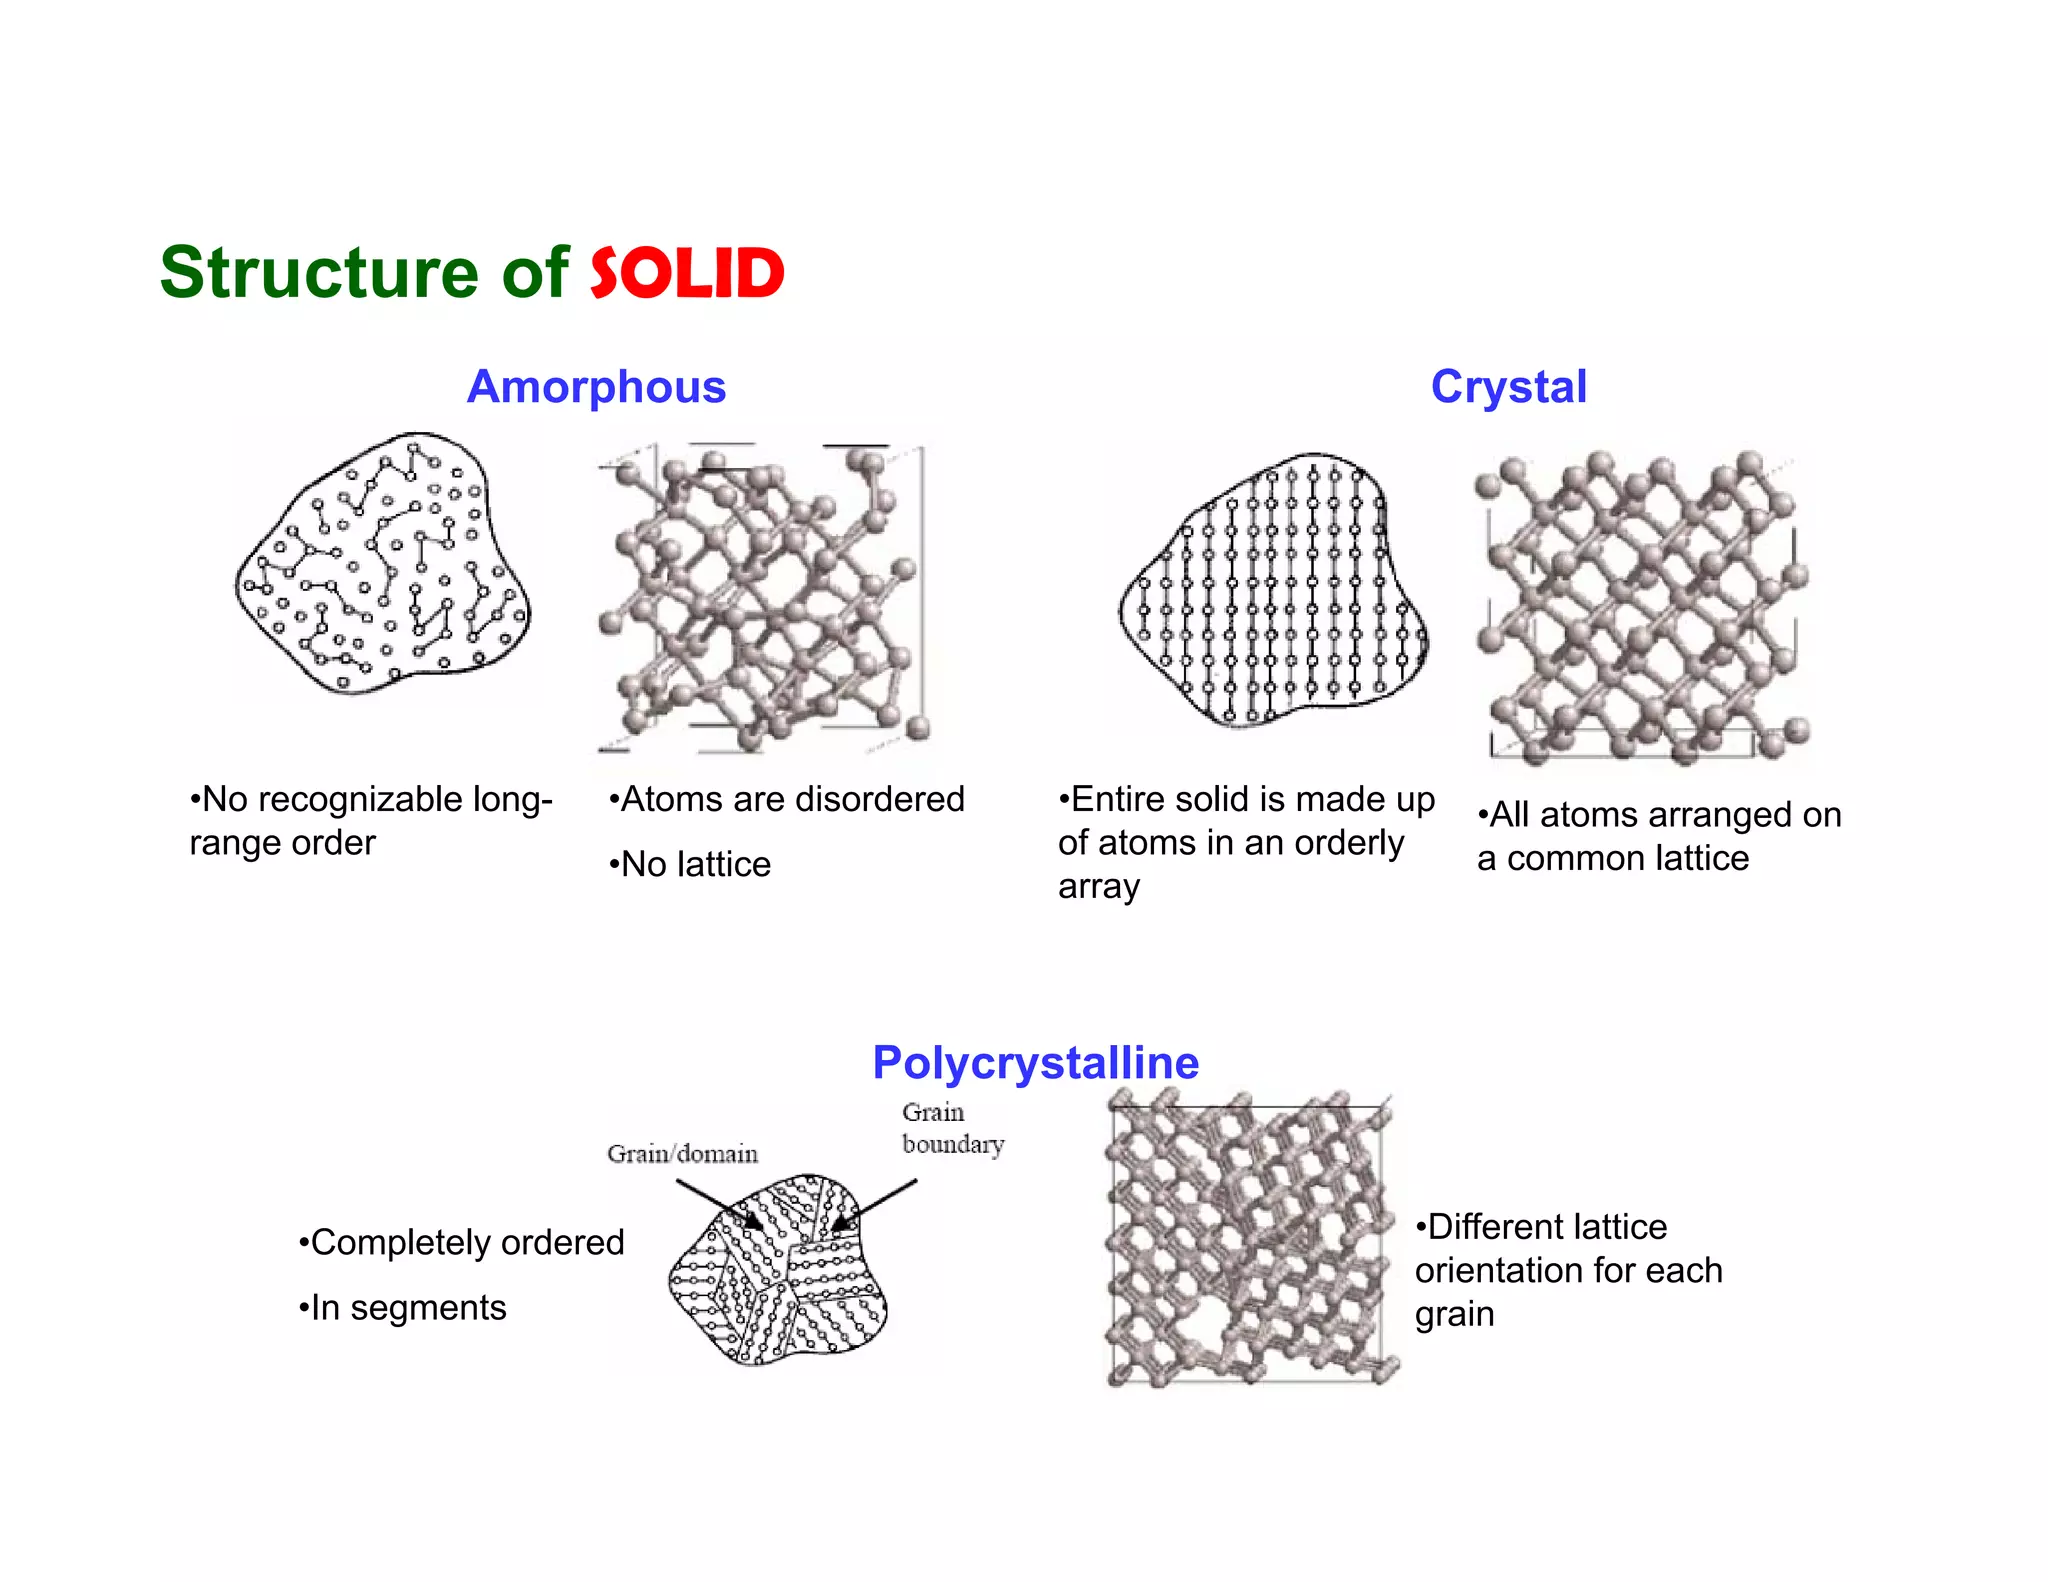
i. Crystalline materials
ii. Amorphous materials
iii. Single crystalline
iv. Polycrystalline
[8 marks]
QUESTION : FINAL EXAM [OCT 2012]](https://image.slidesharecdn.com/9cztb0vaqk6kf4x1vwe8-signature-d98e614c44bb5d5fcfc79eb5ed8fdbf00bc1e22d961d7a0f5fed49408756051c-poli-140724113841-phpapp02/75/Mec281-lecture-66-2048.jpg)
![74
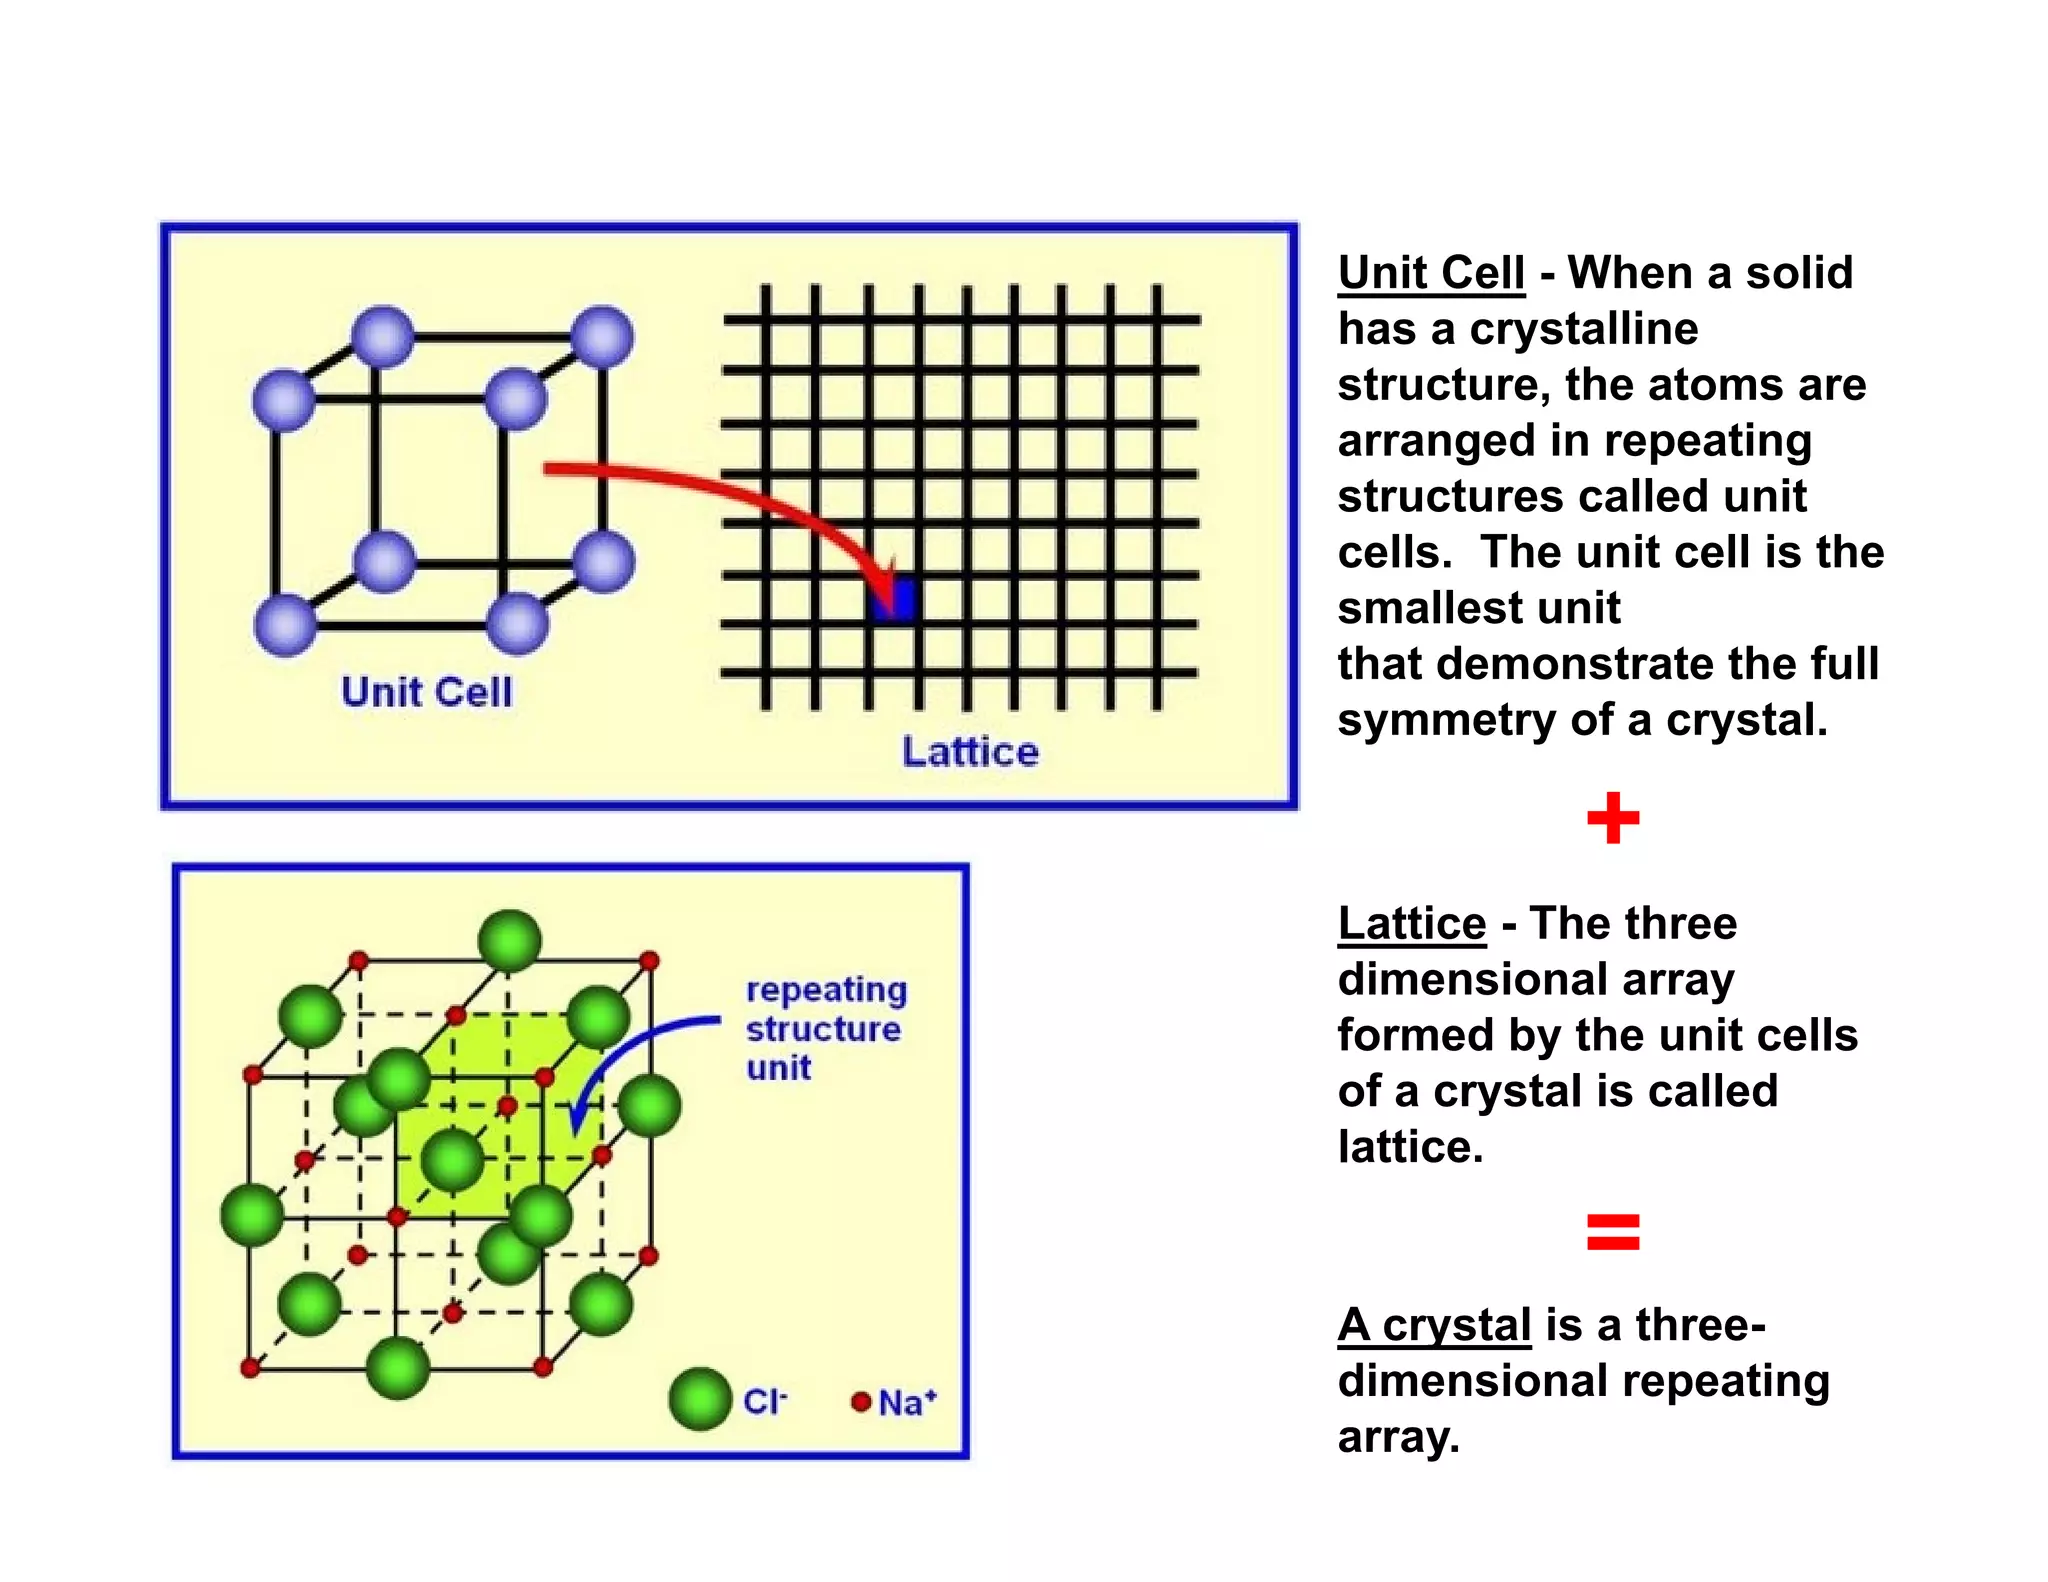
1a] Give the definition of a unit cell. Briefly describe lattice constant in the unit cell.
[ 4 marks]
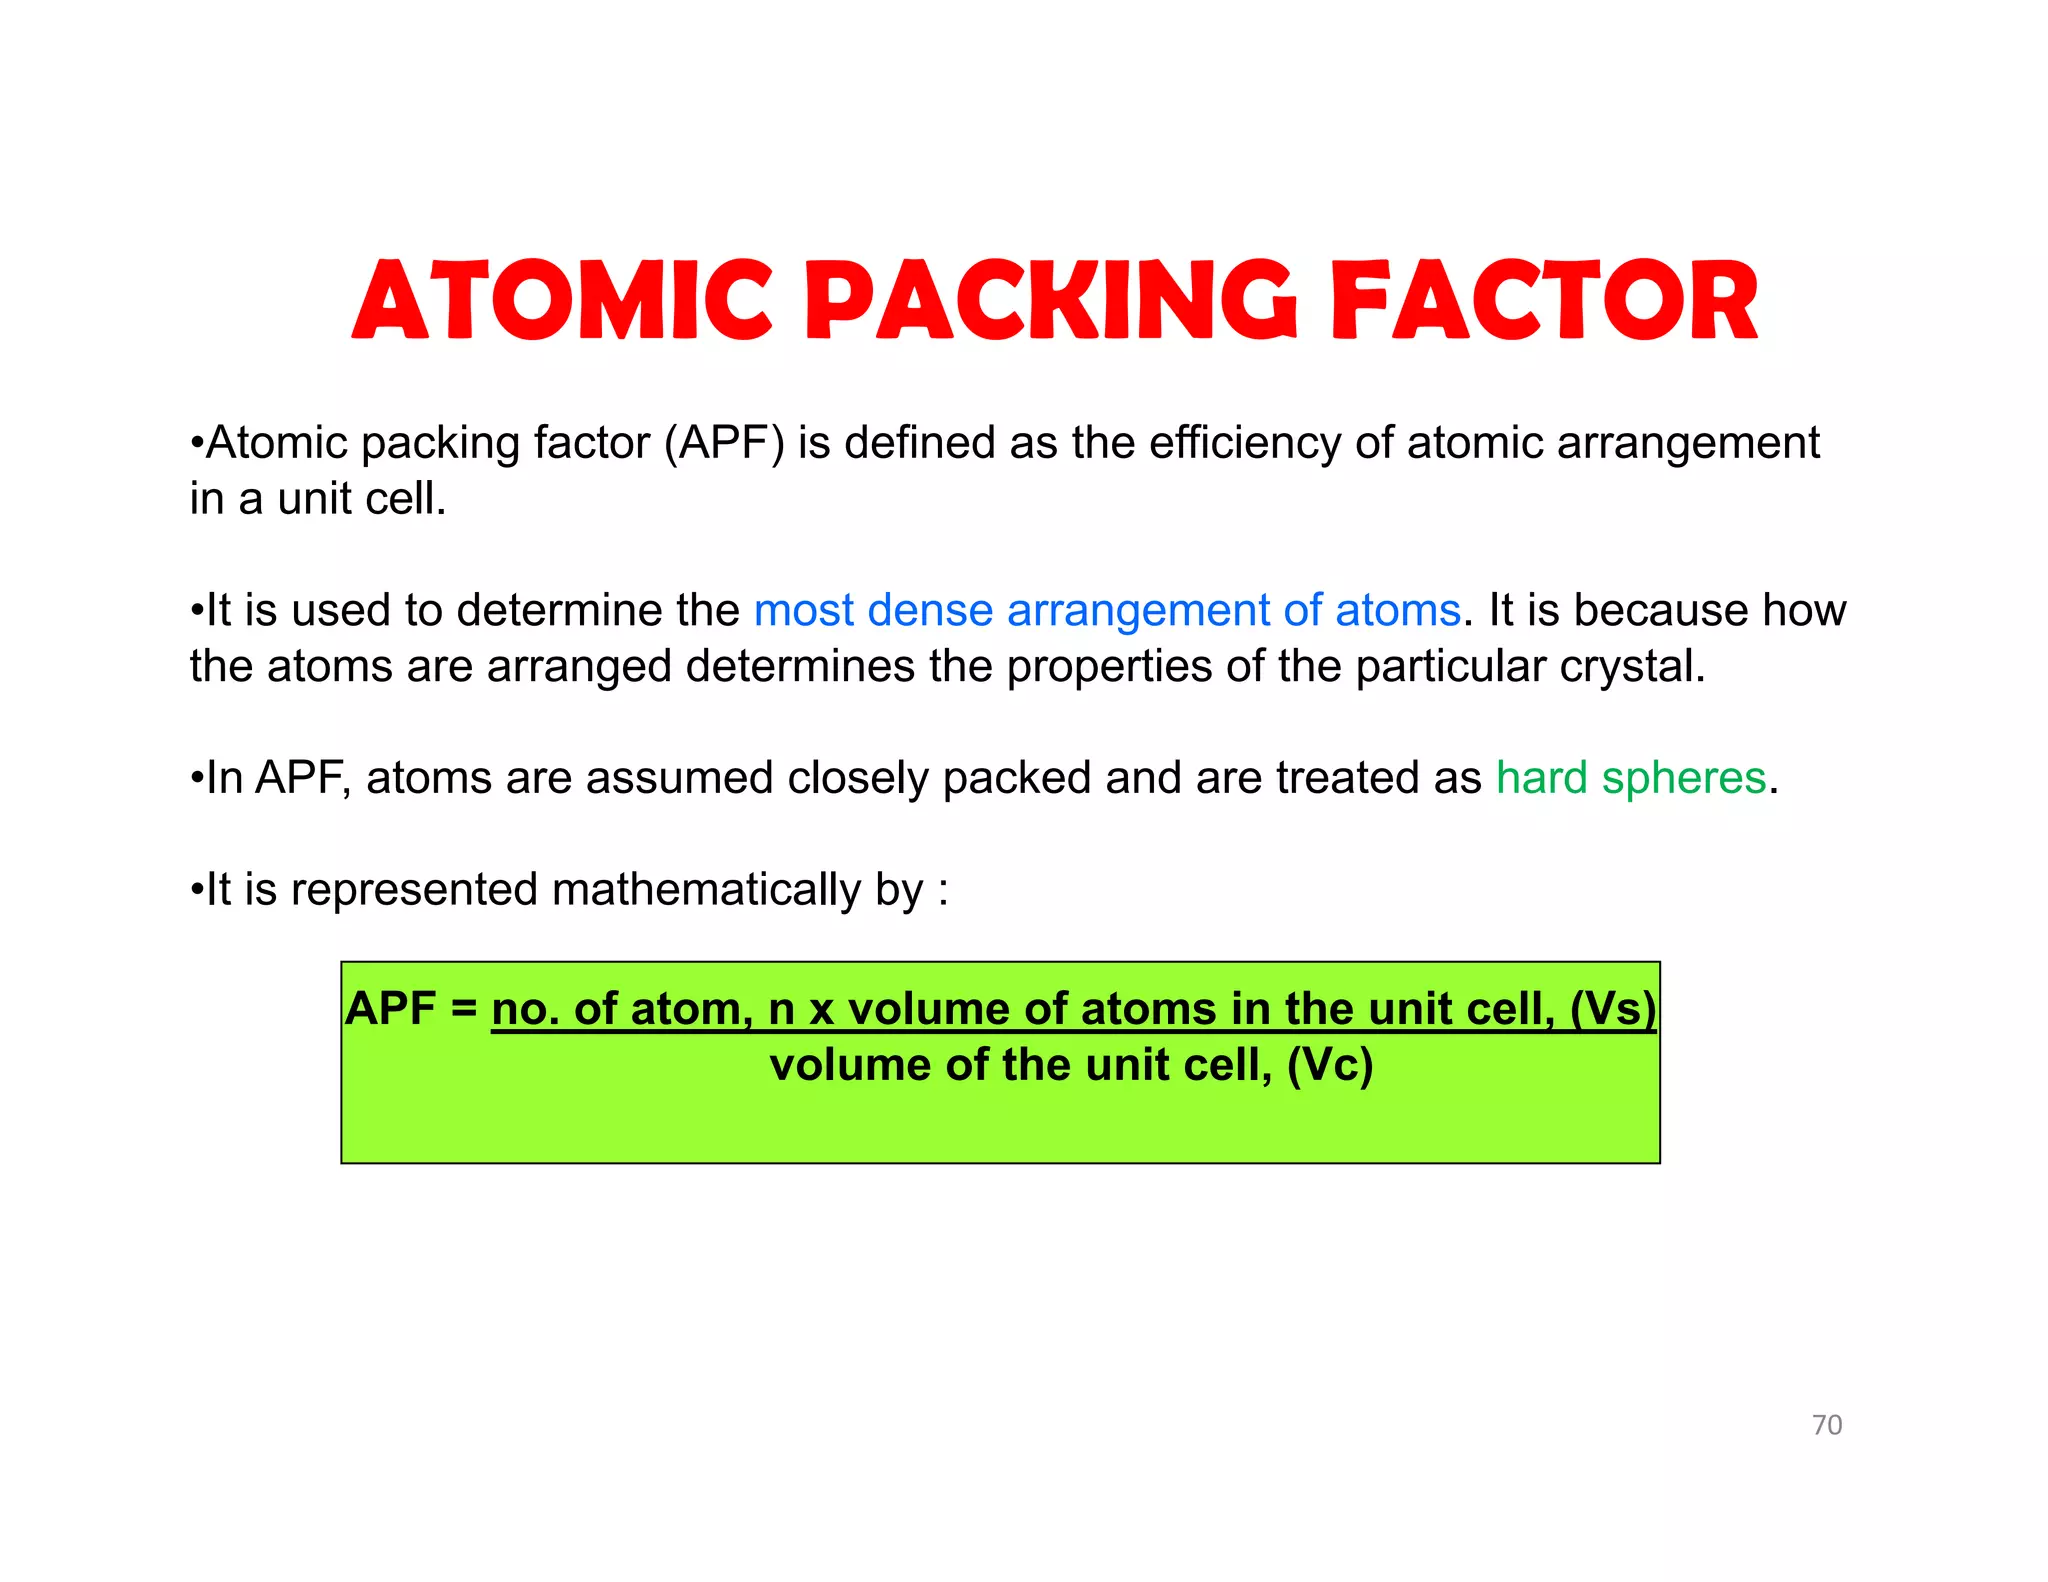
1b] Give the definition of APF for a unit cell and calculate the APF for FCC.
[4 marks]
QUESTION : FINAL EXAM [Oct 2010]](https://image.slidesharecdn.com/9cztb0vaqk6kf4x1vwe8-signature-d98e614c44bb5d5fcfc79eb5ed8fdbf00bc1e22d961d7a0f5fed49408756051c-poli-140724113841-phpapp02/75/Mec281-lecture-82-2048.jpg)

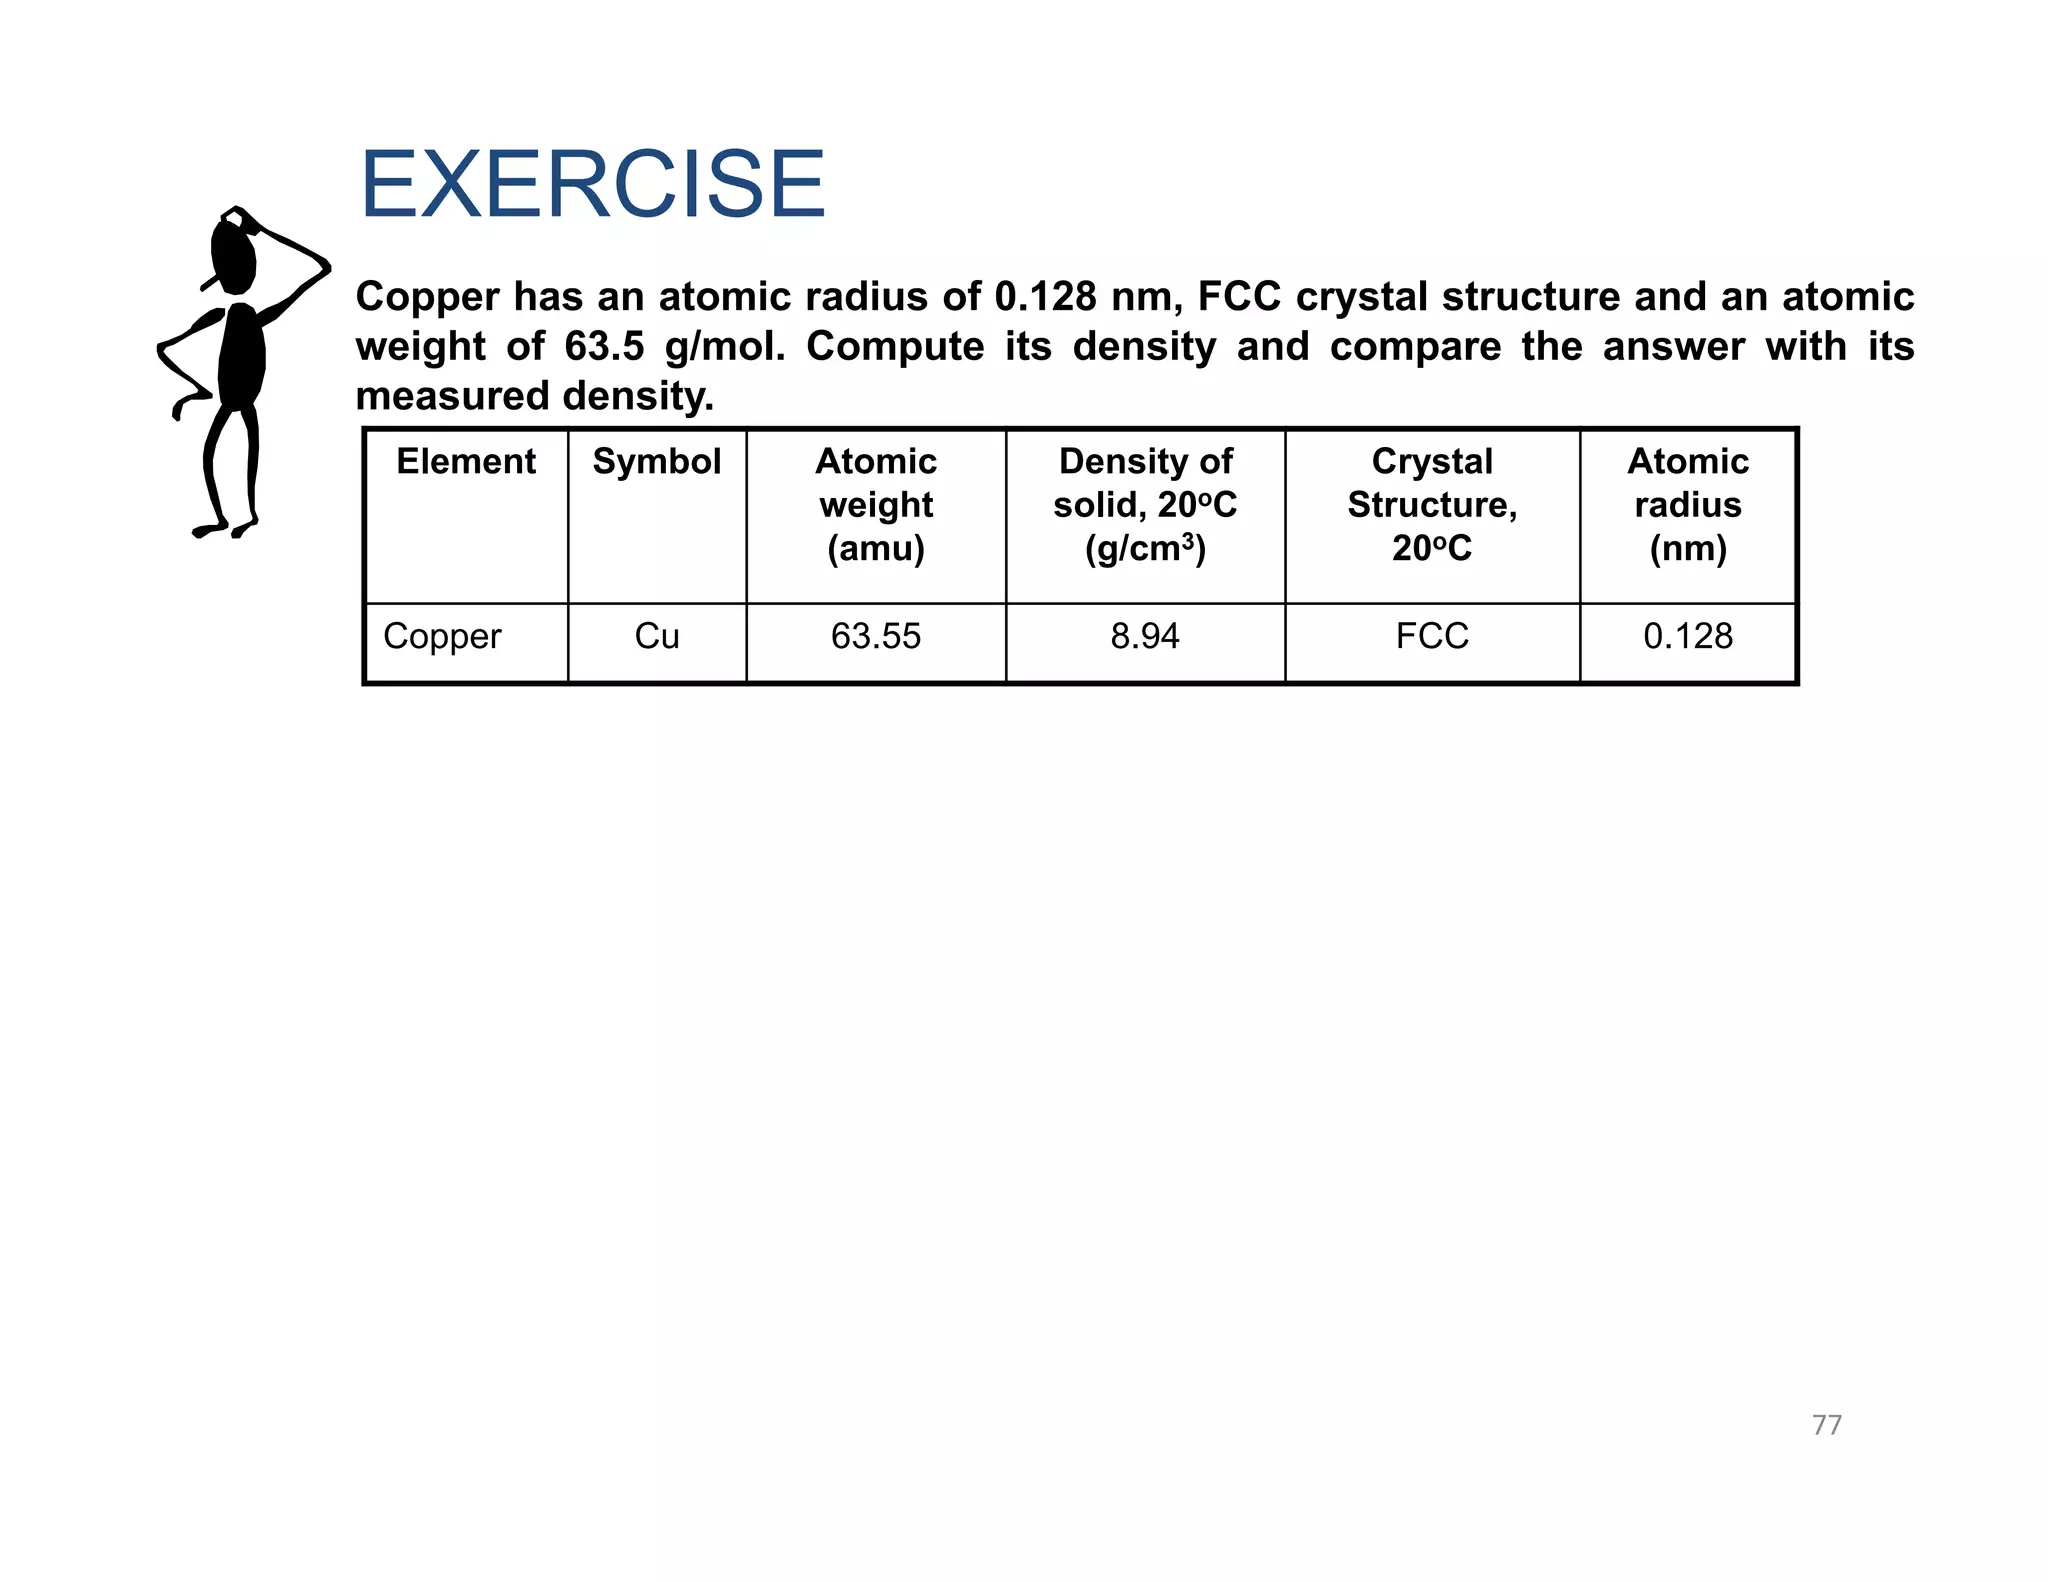
![78
1b] Platinum has a FCC structure, a lattice parameter of 0.393 nm and an atomic weight
of 195.09 g/mol. Determine :
i. Atomic radius [in cm]
ii. Density of platinum
[ 6marks]
QUESTION : TEST 1 [August 2012]](https://image.slidesharecdn.com/9cztb0vaqk6kf4x1vwe8-signature-d98e614c44bb5d5fcfc79eb5ed8fdbf00bc1e22d961d7a0f5fed49408756051c-poli-140724113841-phpapp02/75/Mec281-lecture-86-2048.jpg)
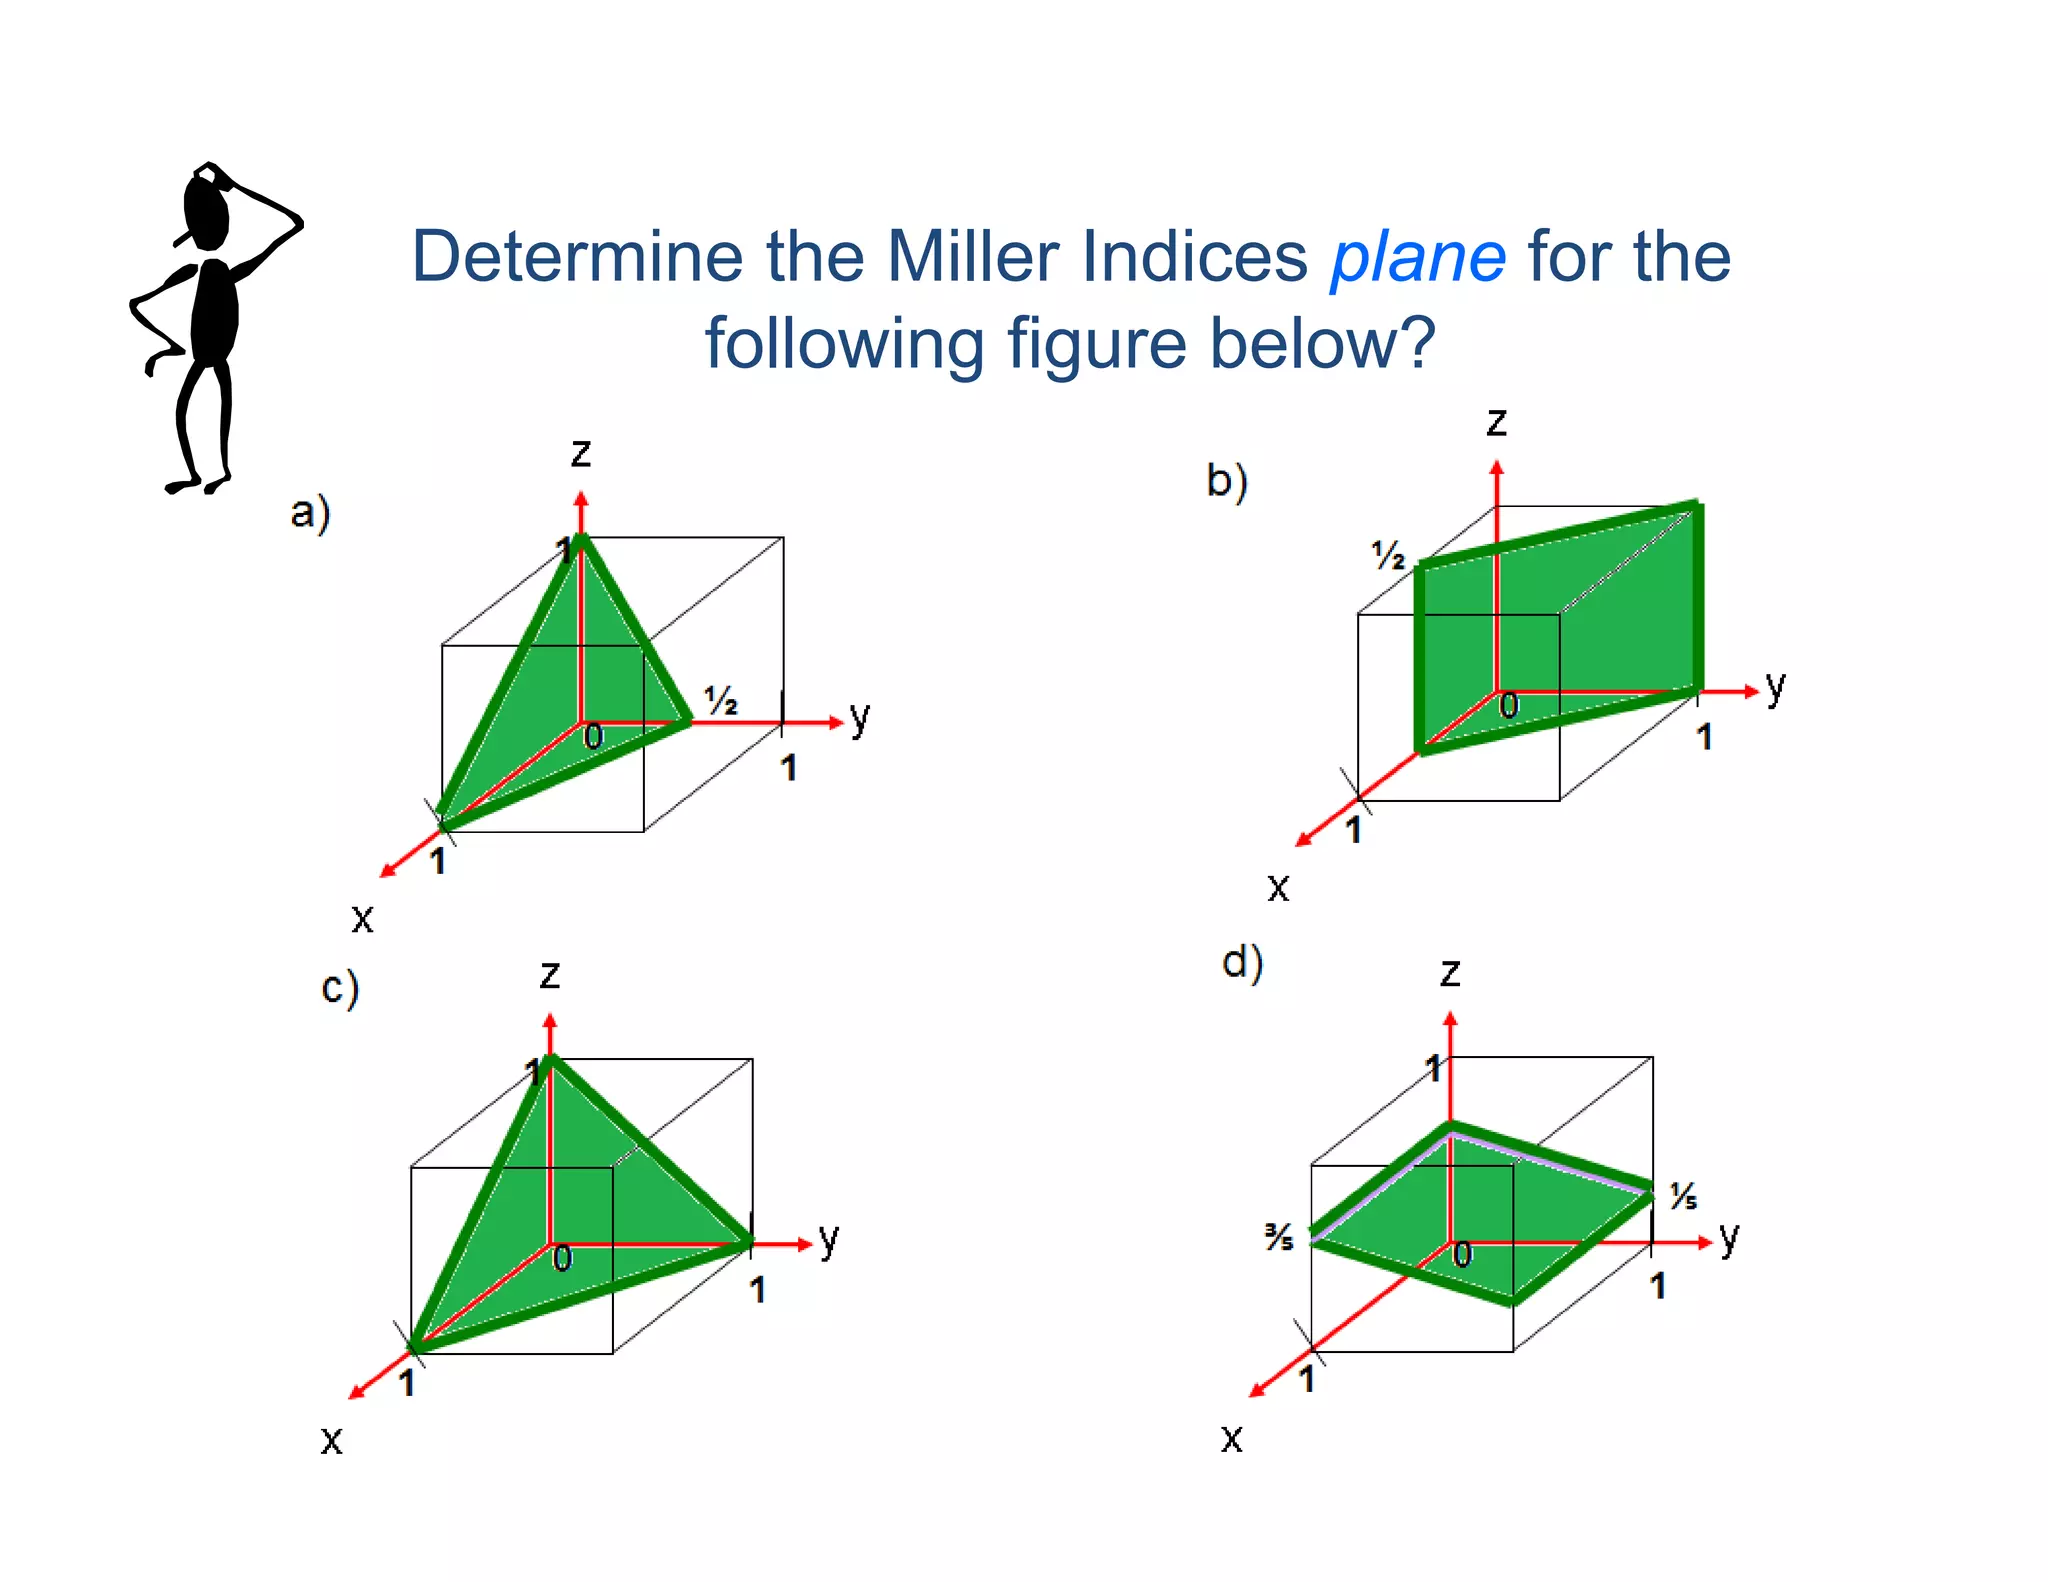
![79
Miller indices is used to label the planes and directions of atoms in a crystal.
Why Miller indices is important?
To determine the shapes of single crystals, the interpretation of X-ray
diffraction patterns and the movement of a dislocation , which may determine
the mechanical properties of the material.
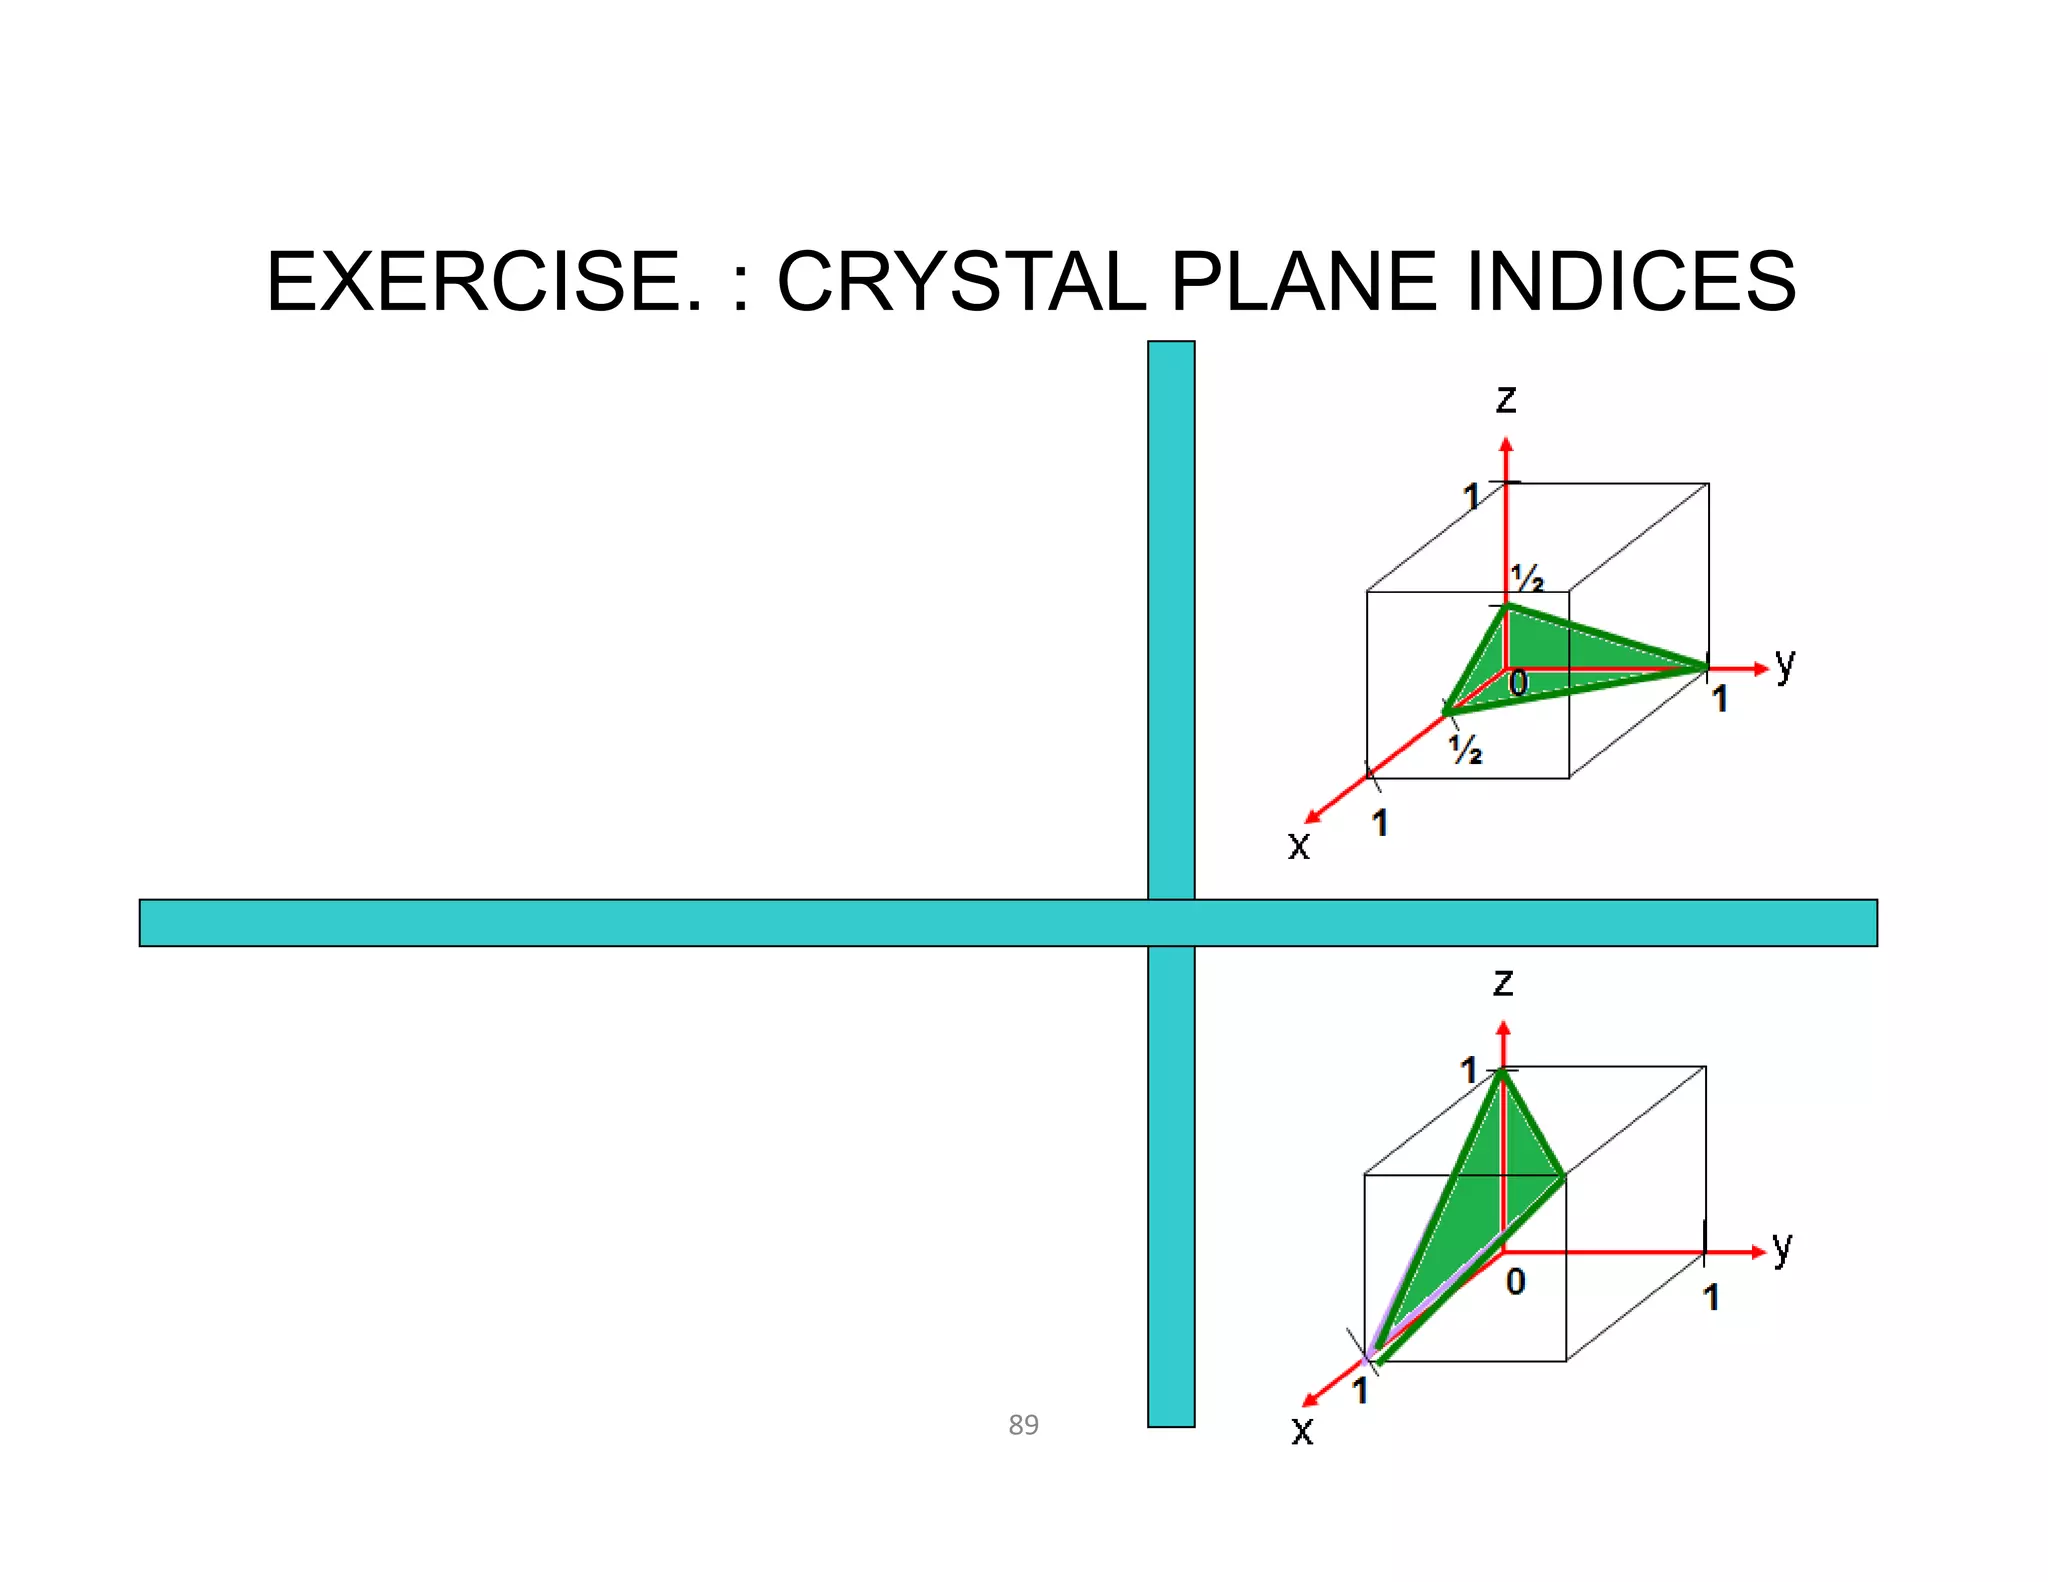
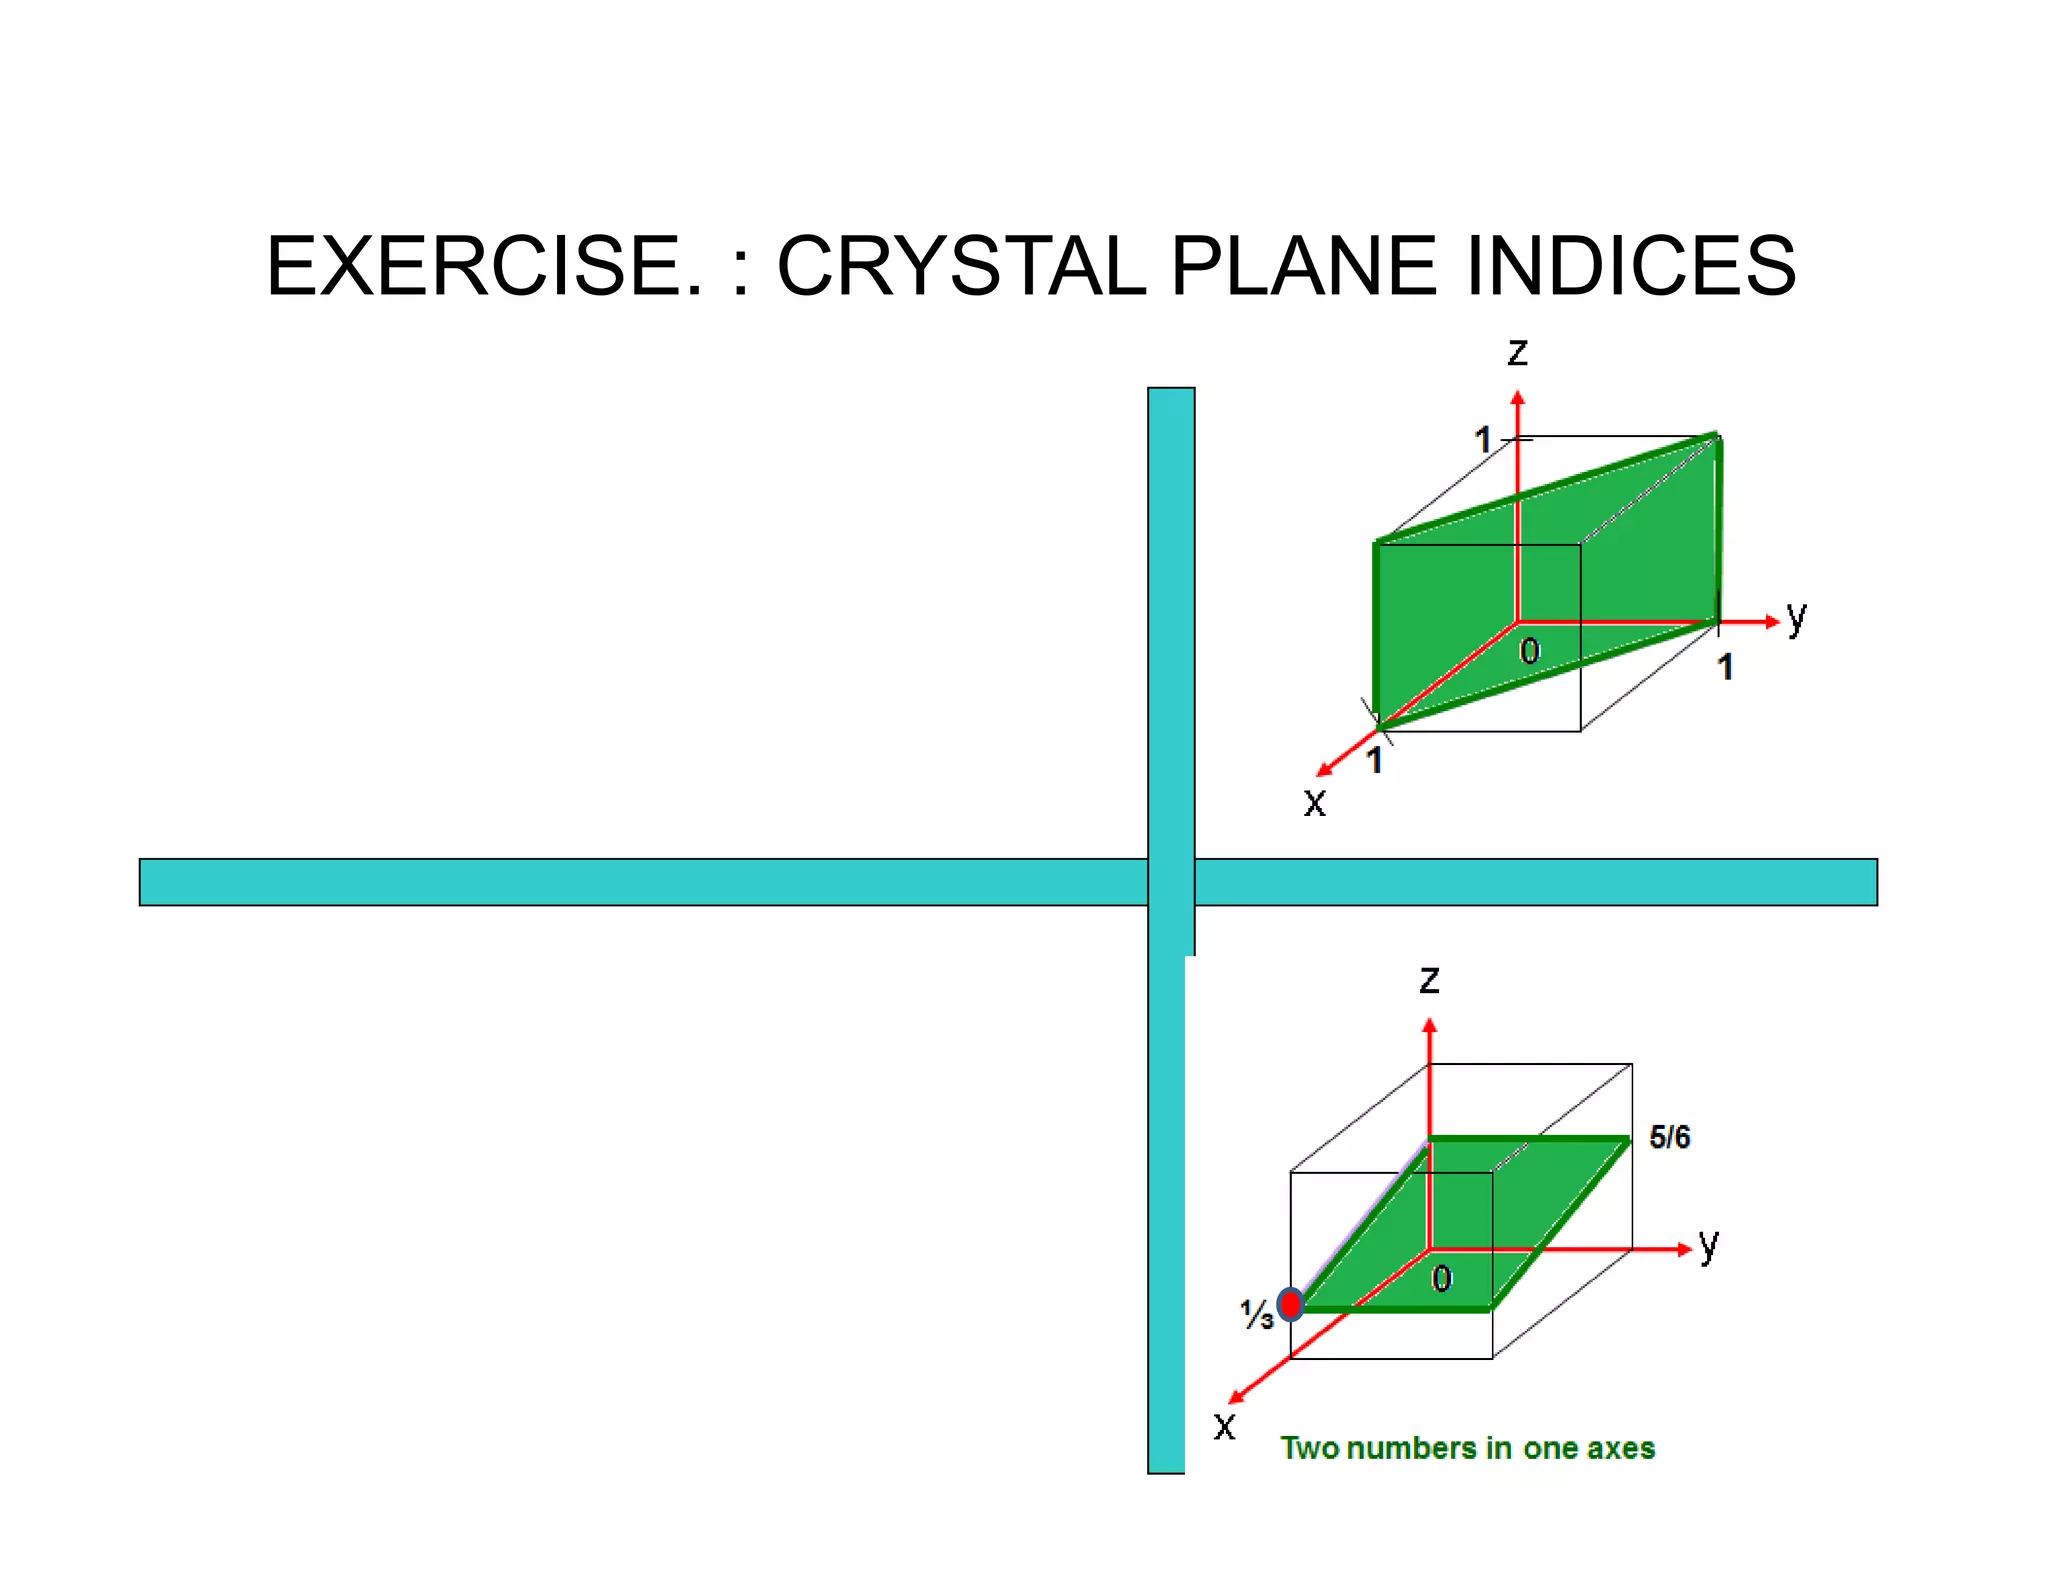
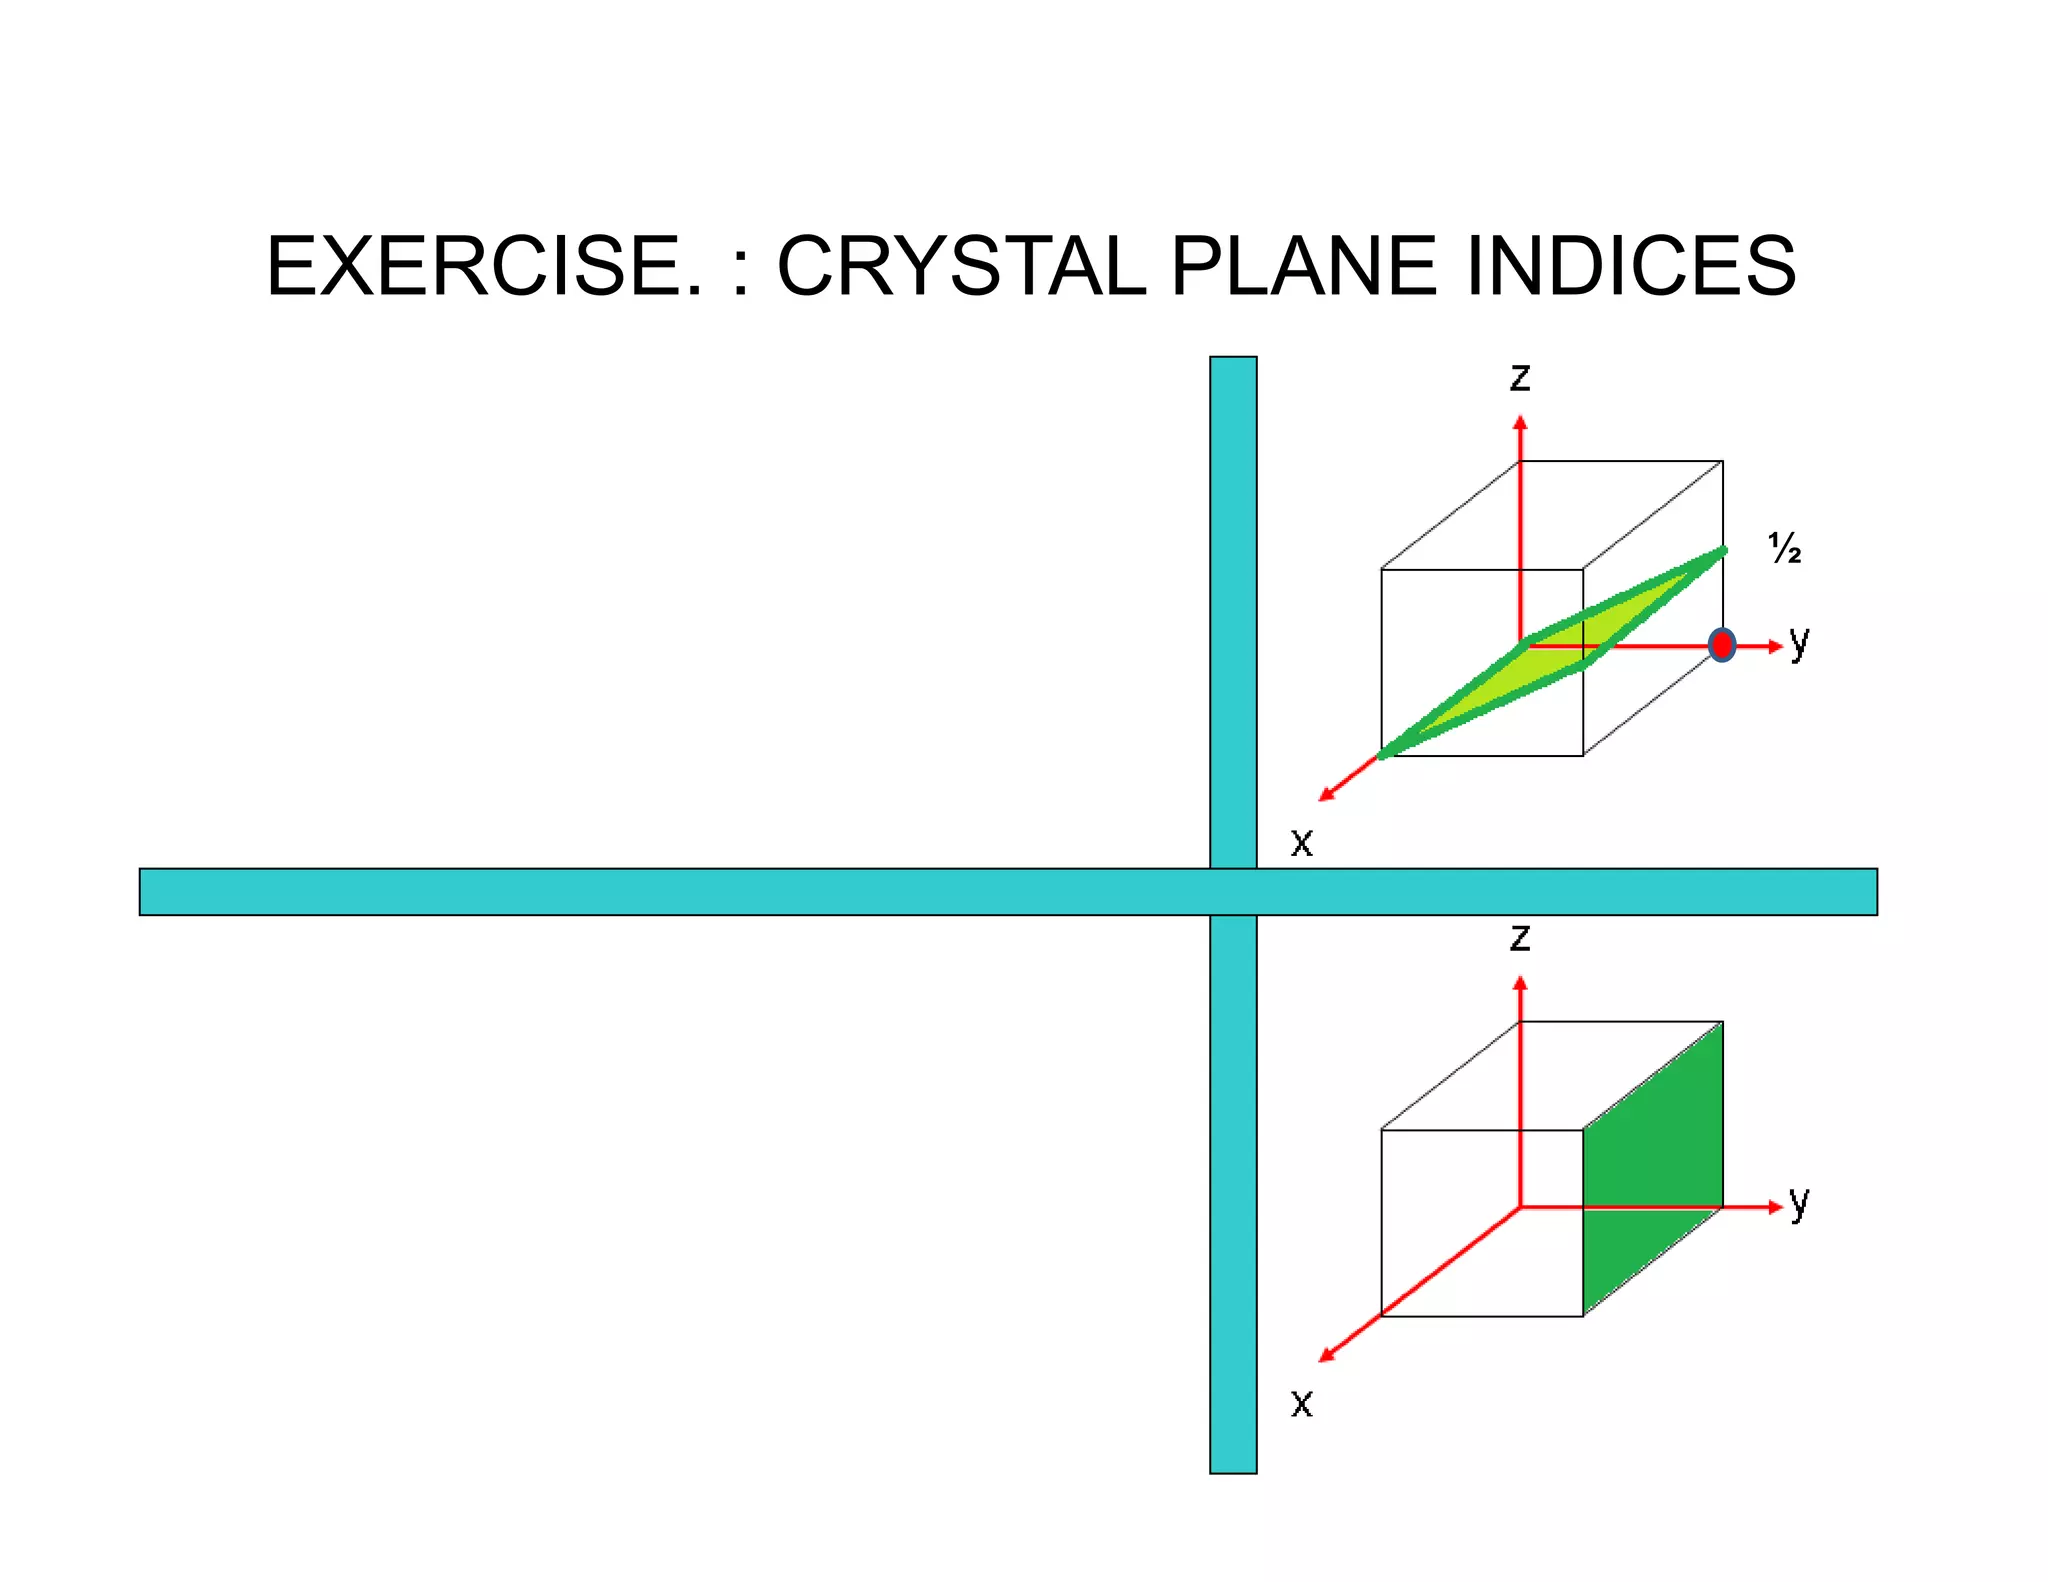
MILLER INDICES
Miller indices
• (h k l) : a specific crystal plane or face
• {h k l} : a family of equivalent planes
• [h k l] : a specific crystal direction
• <h k l> : a family of equivalent directions
Figure : Planes of the form {110} in cubic systems](https://image.slidesharecdn.com/9cztb0vaqk6kf4x1vwe8-signature-d98e614c44bb5d5fcfc79eb5ed8fdbf00bc1e22d961d7a0f5fed49408756051c-poli-140724113841-phpapp02/75/Mec281-lecture-87-2048.jpg)
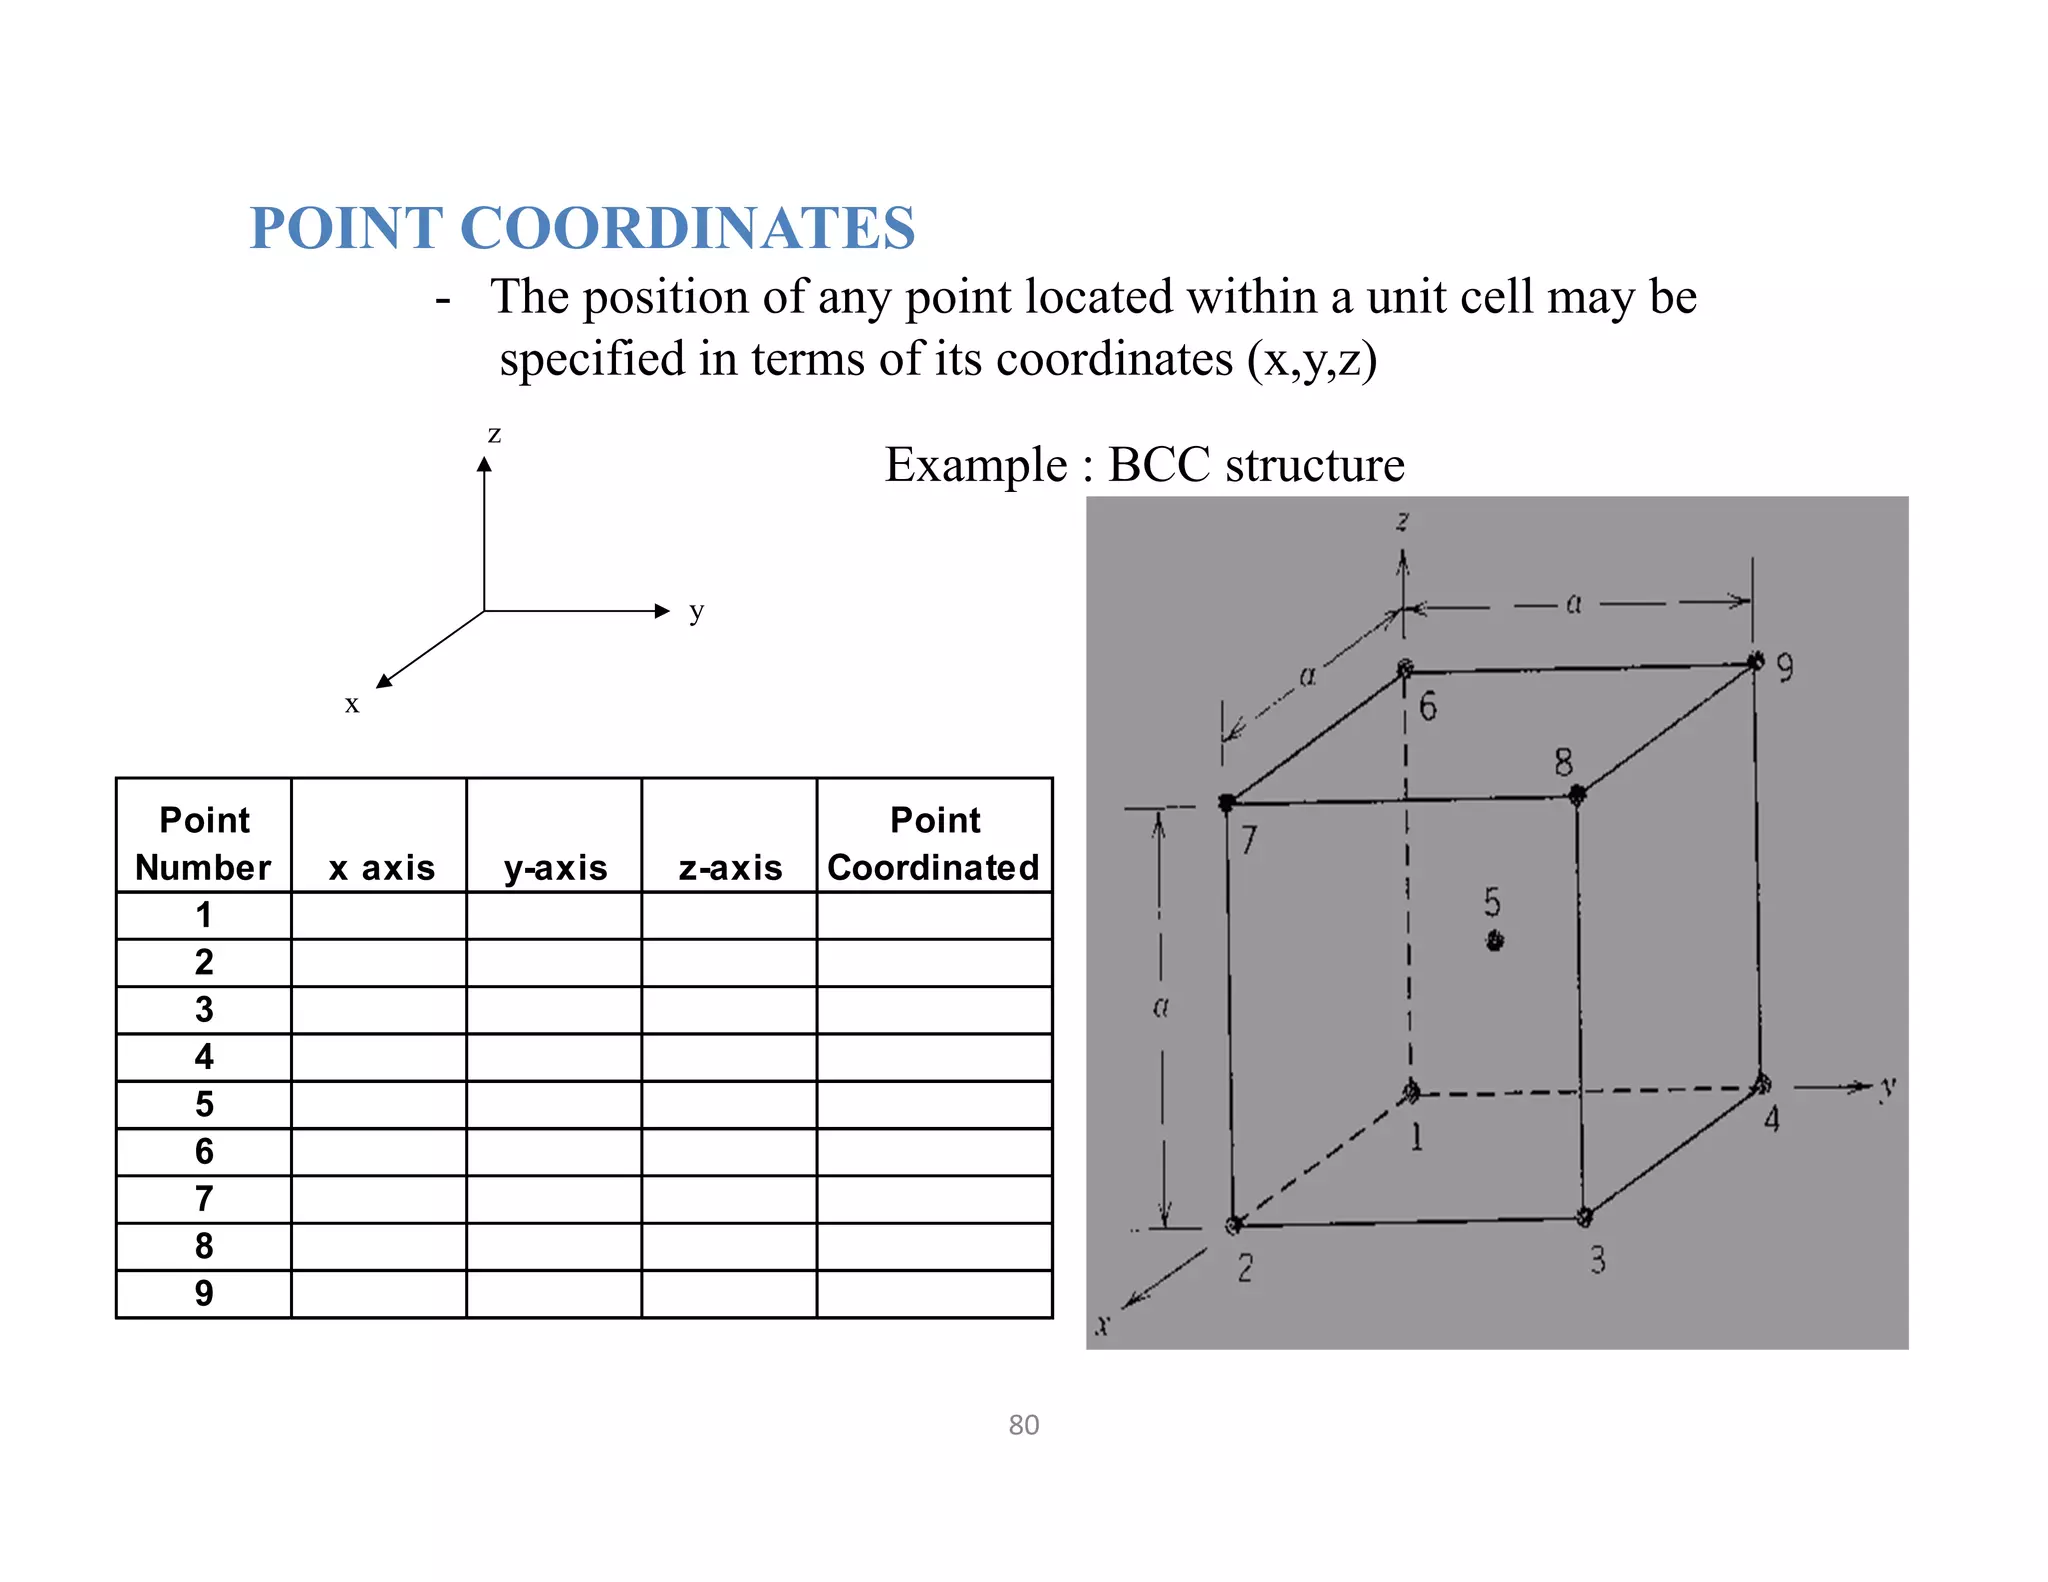
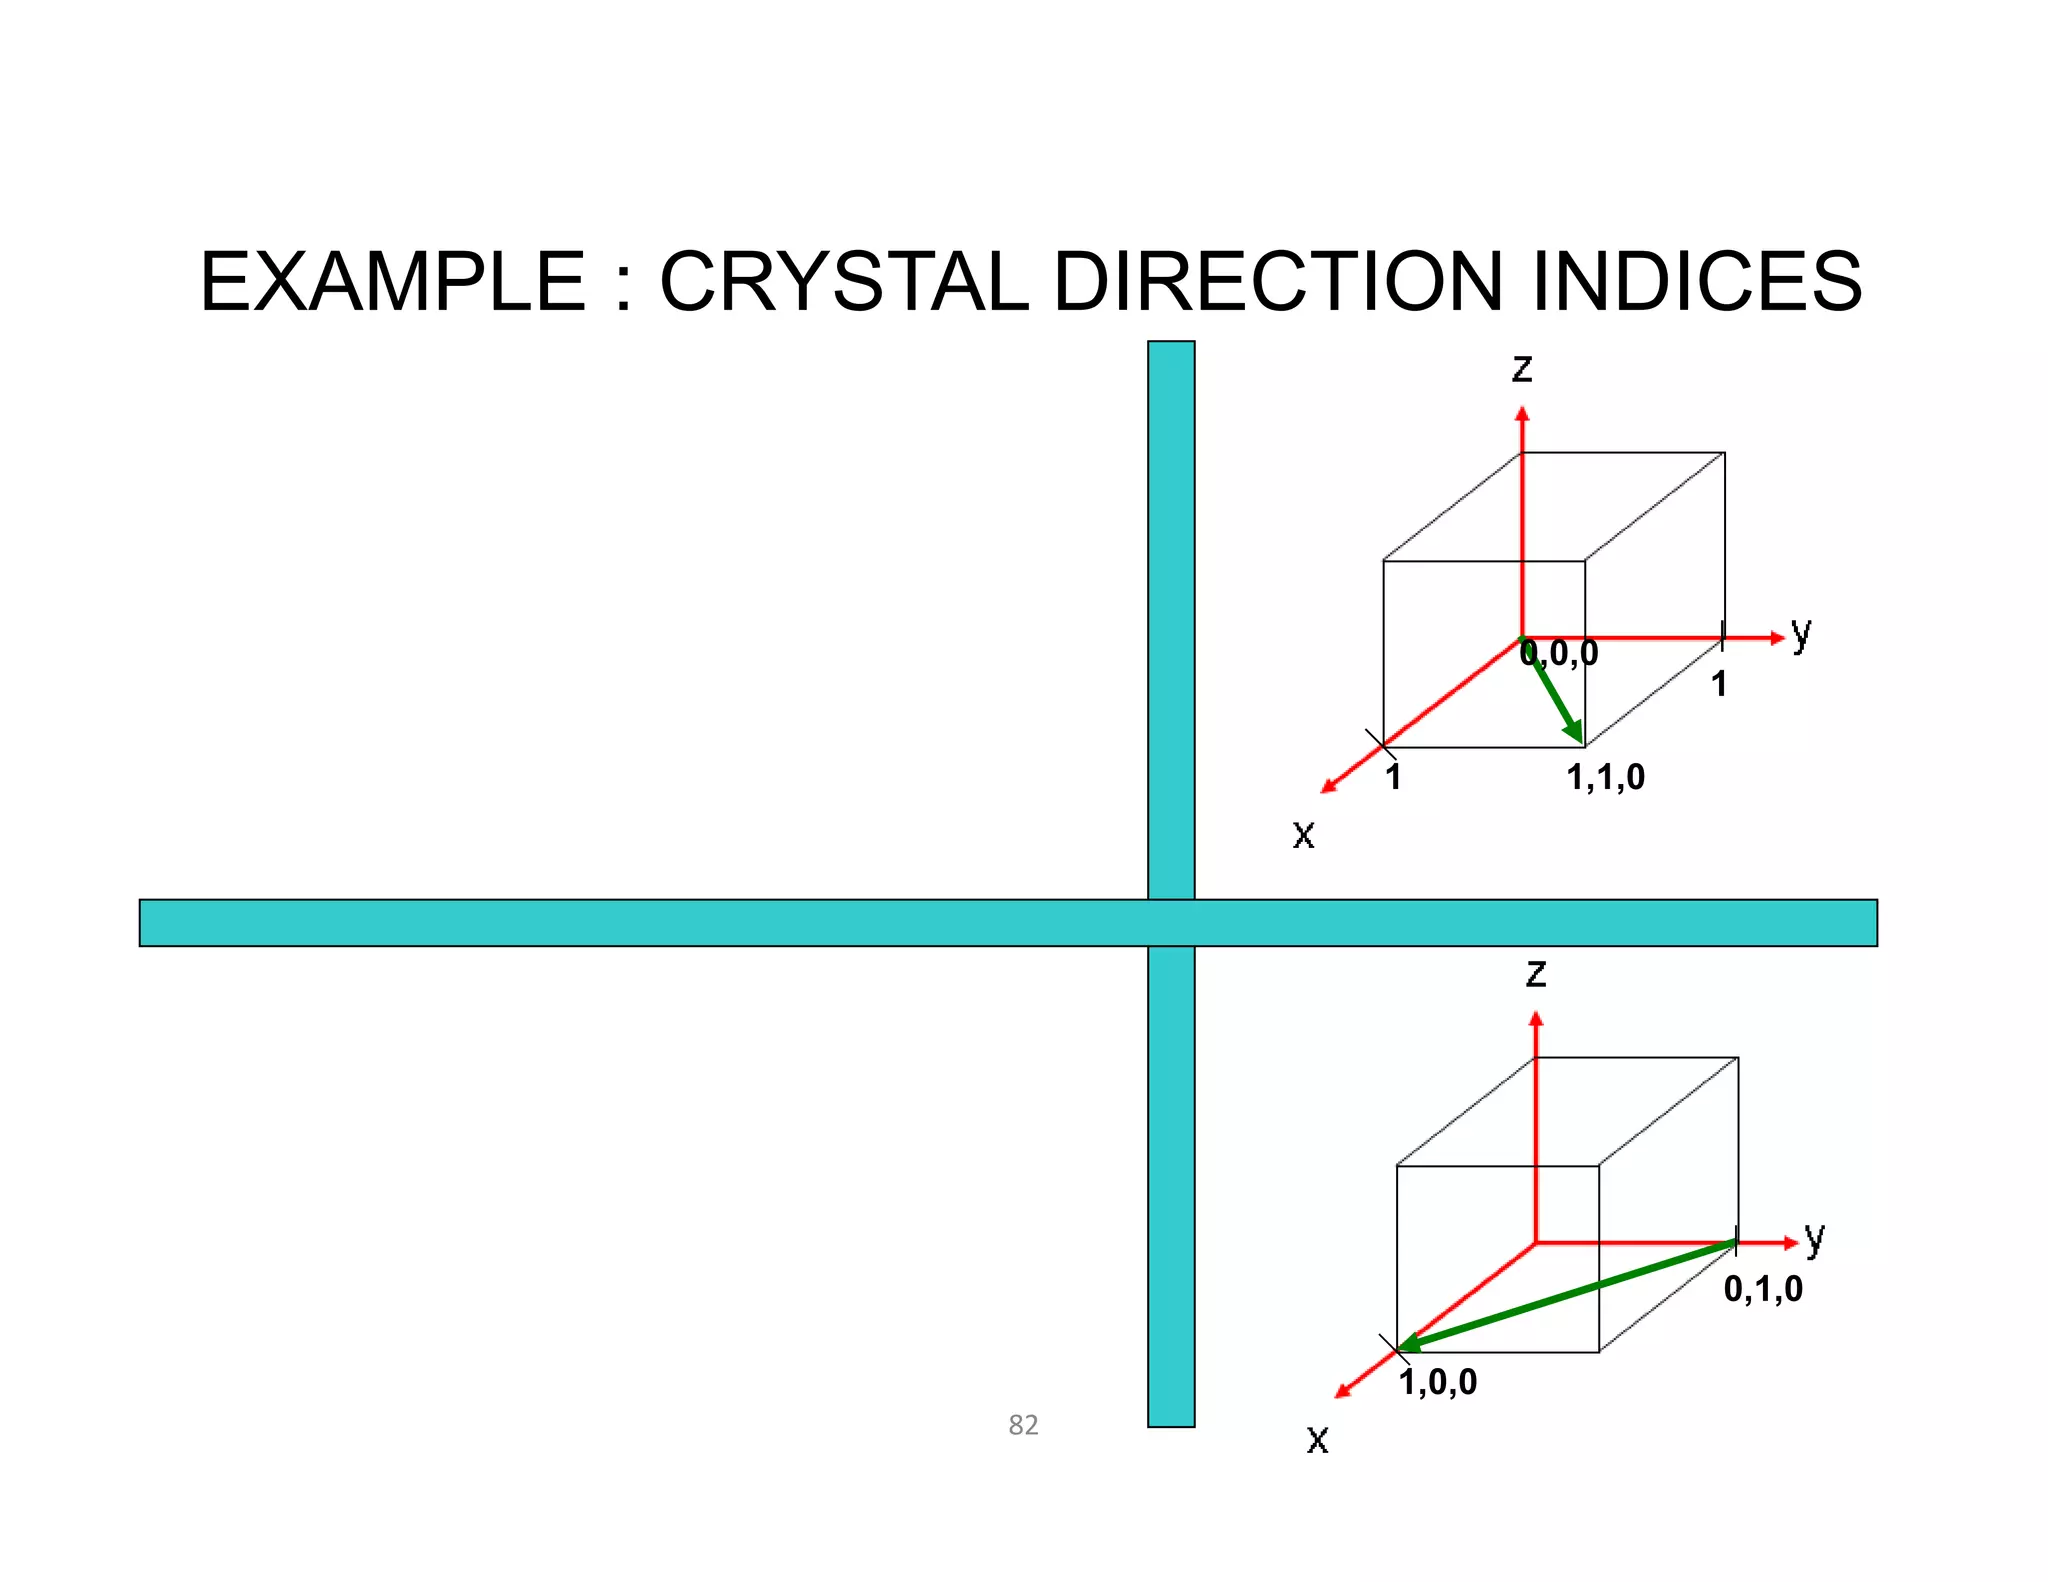
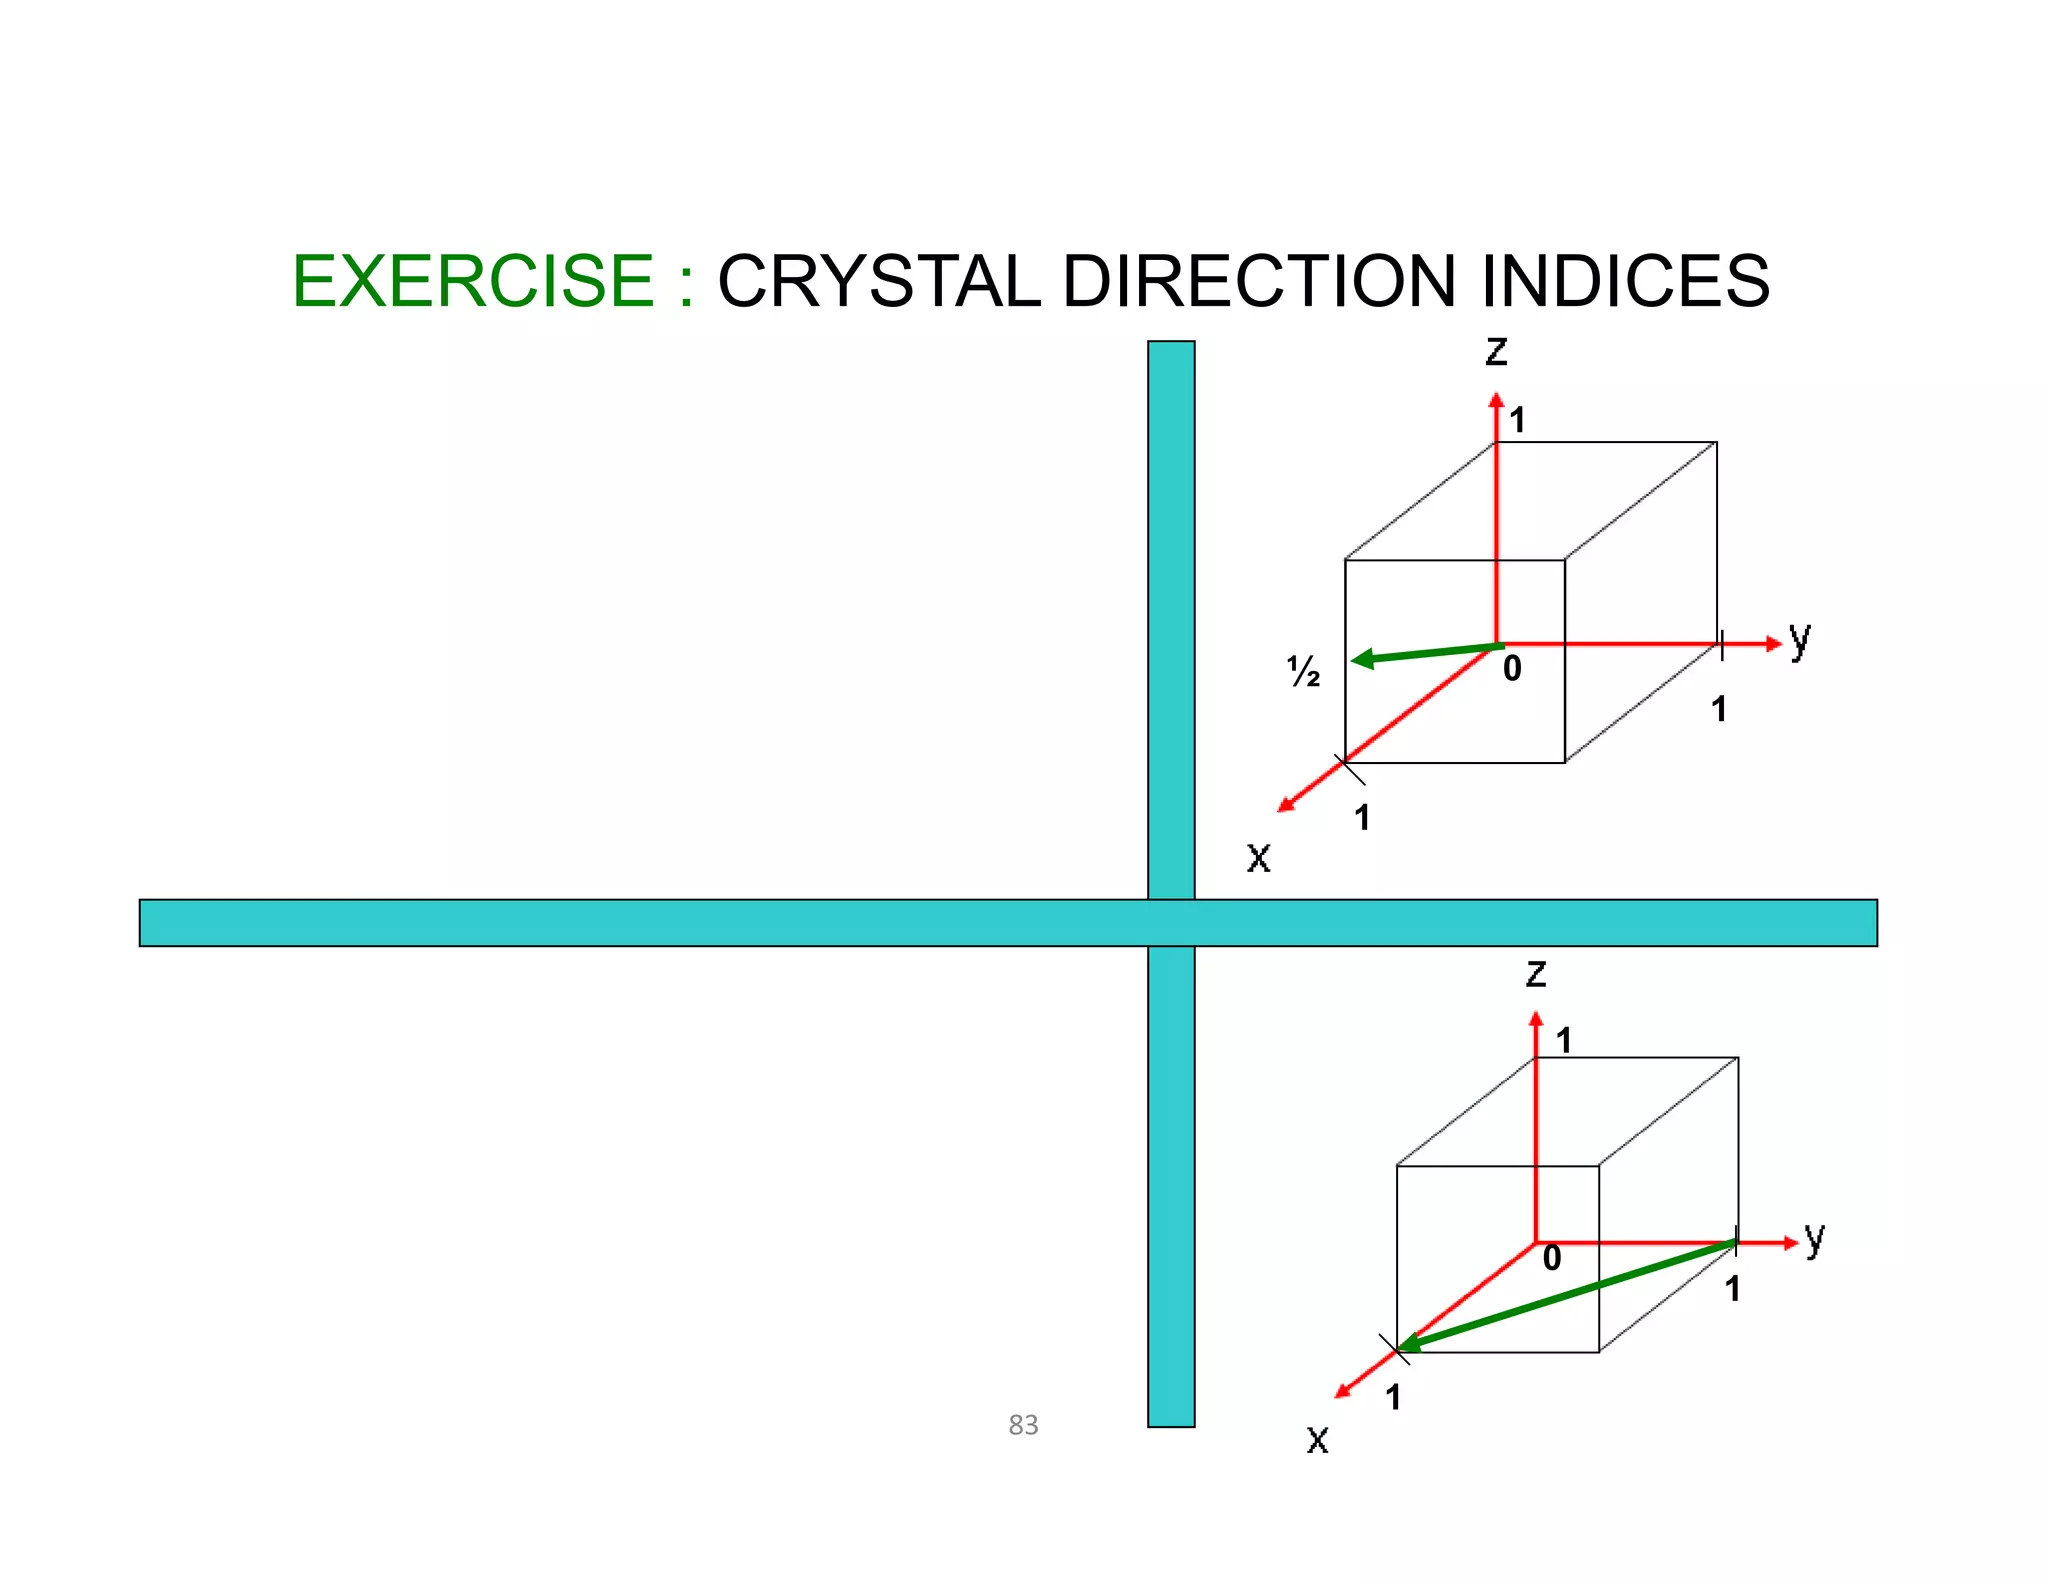
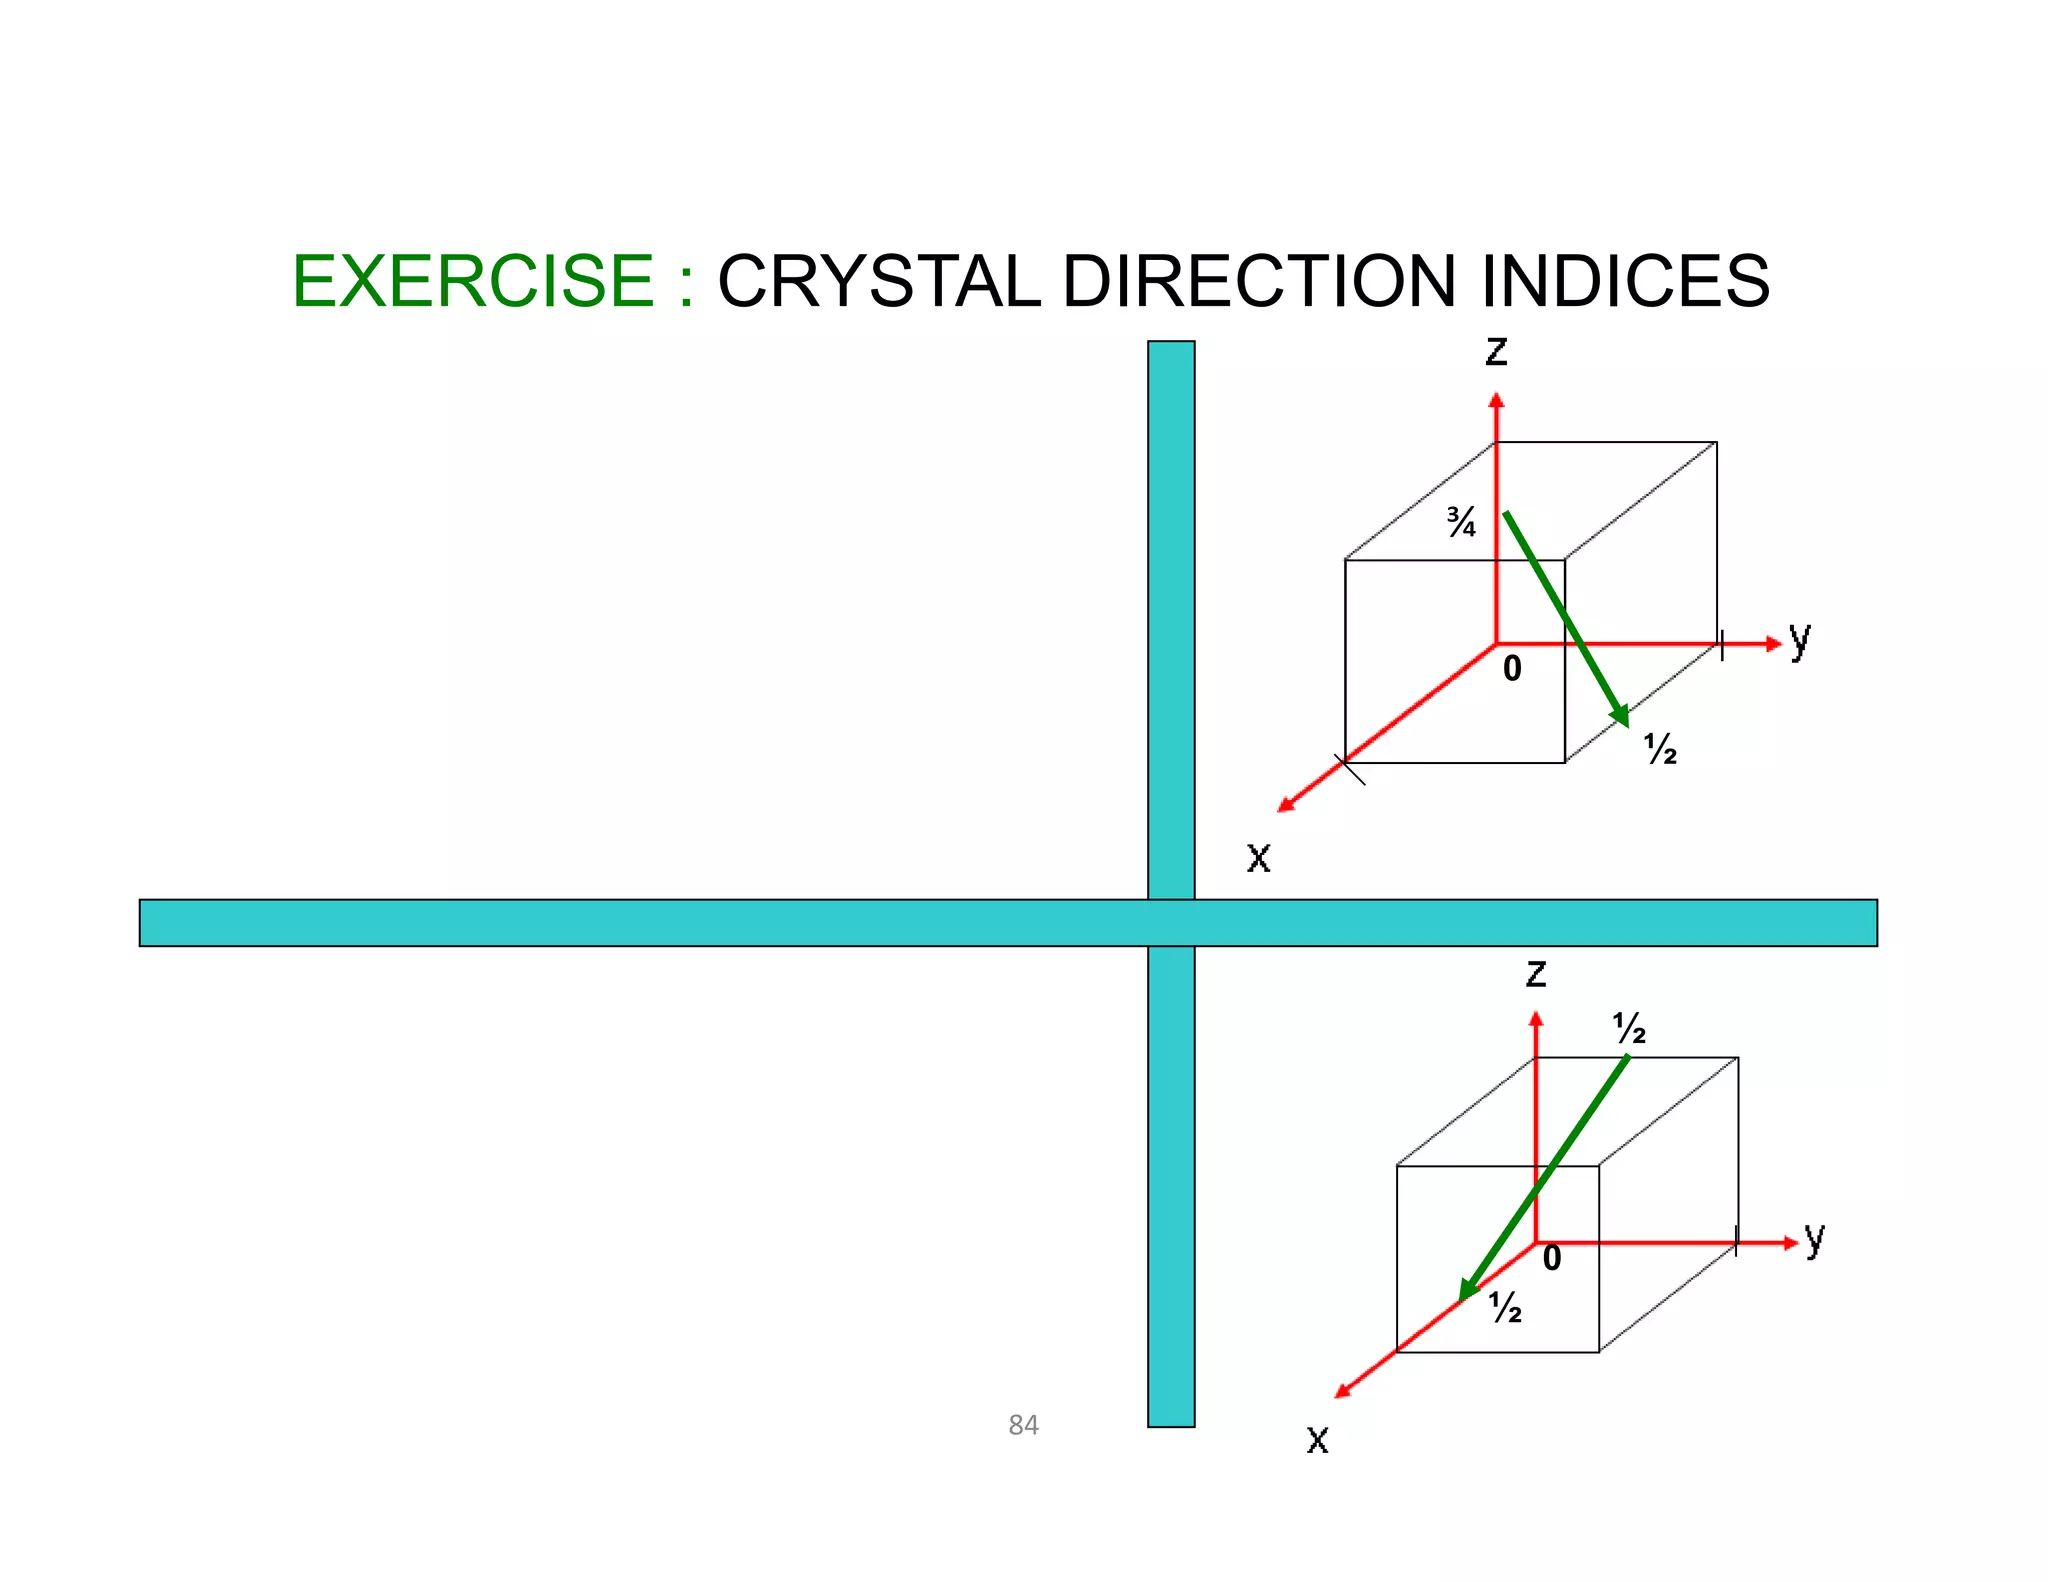
![81
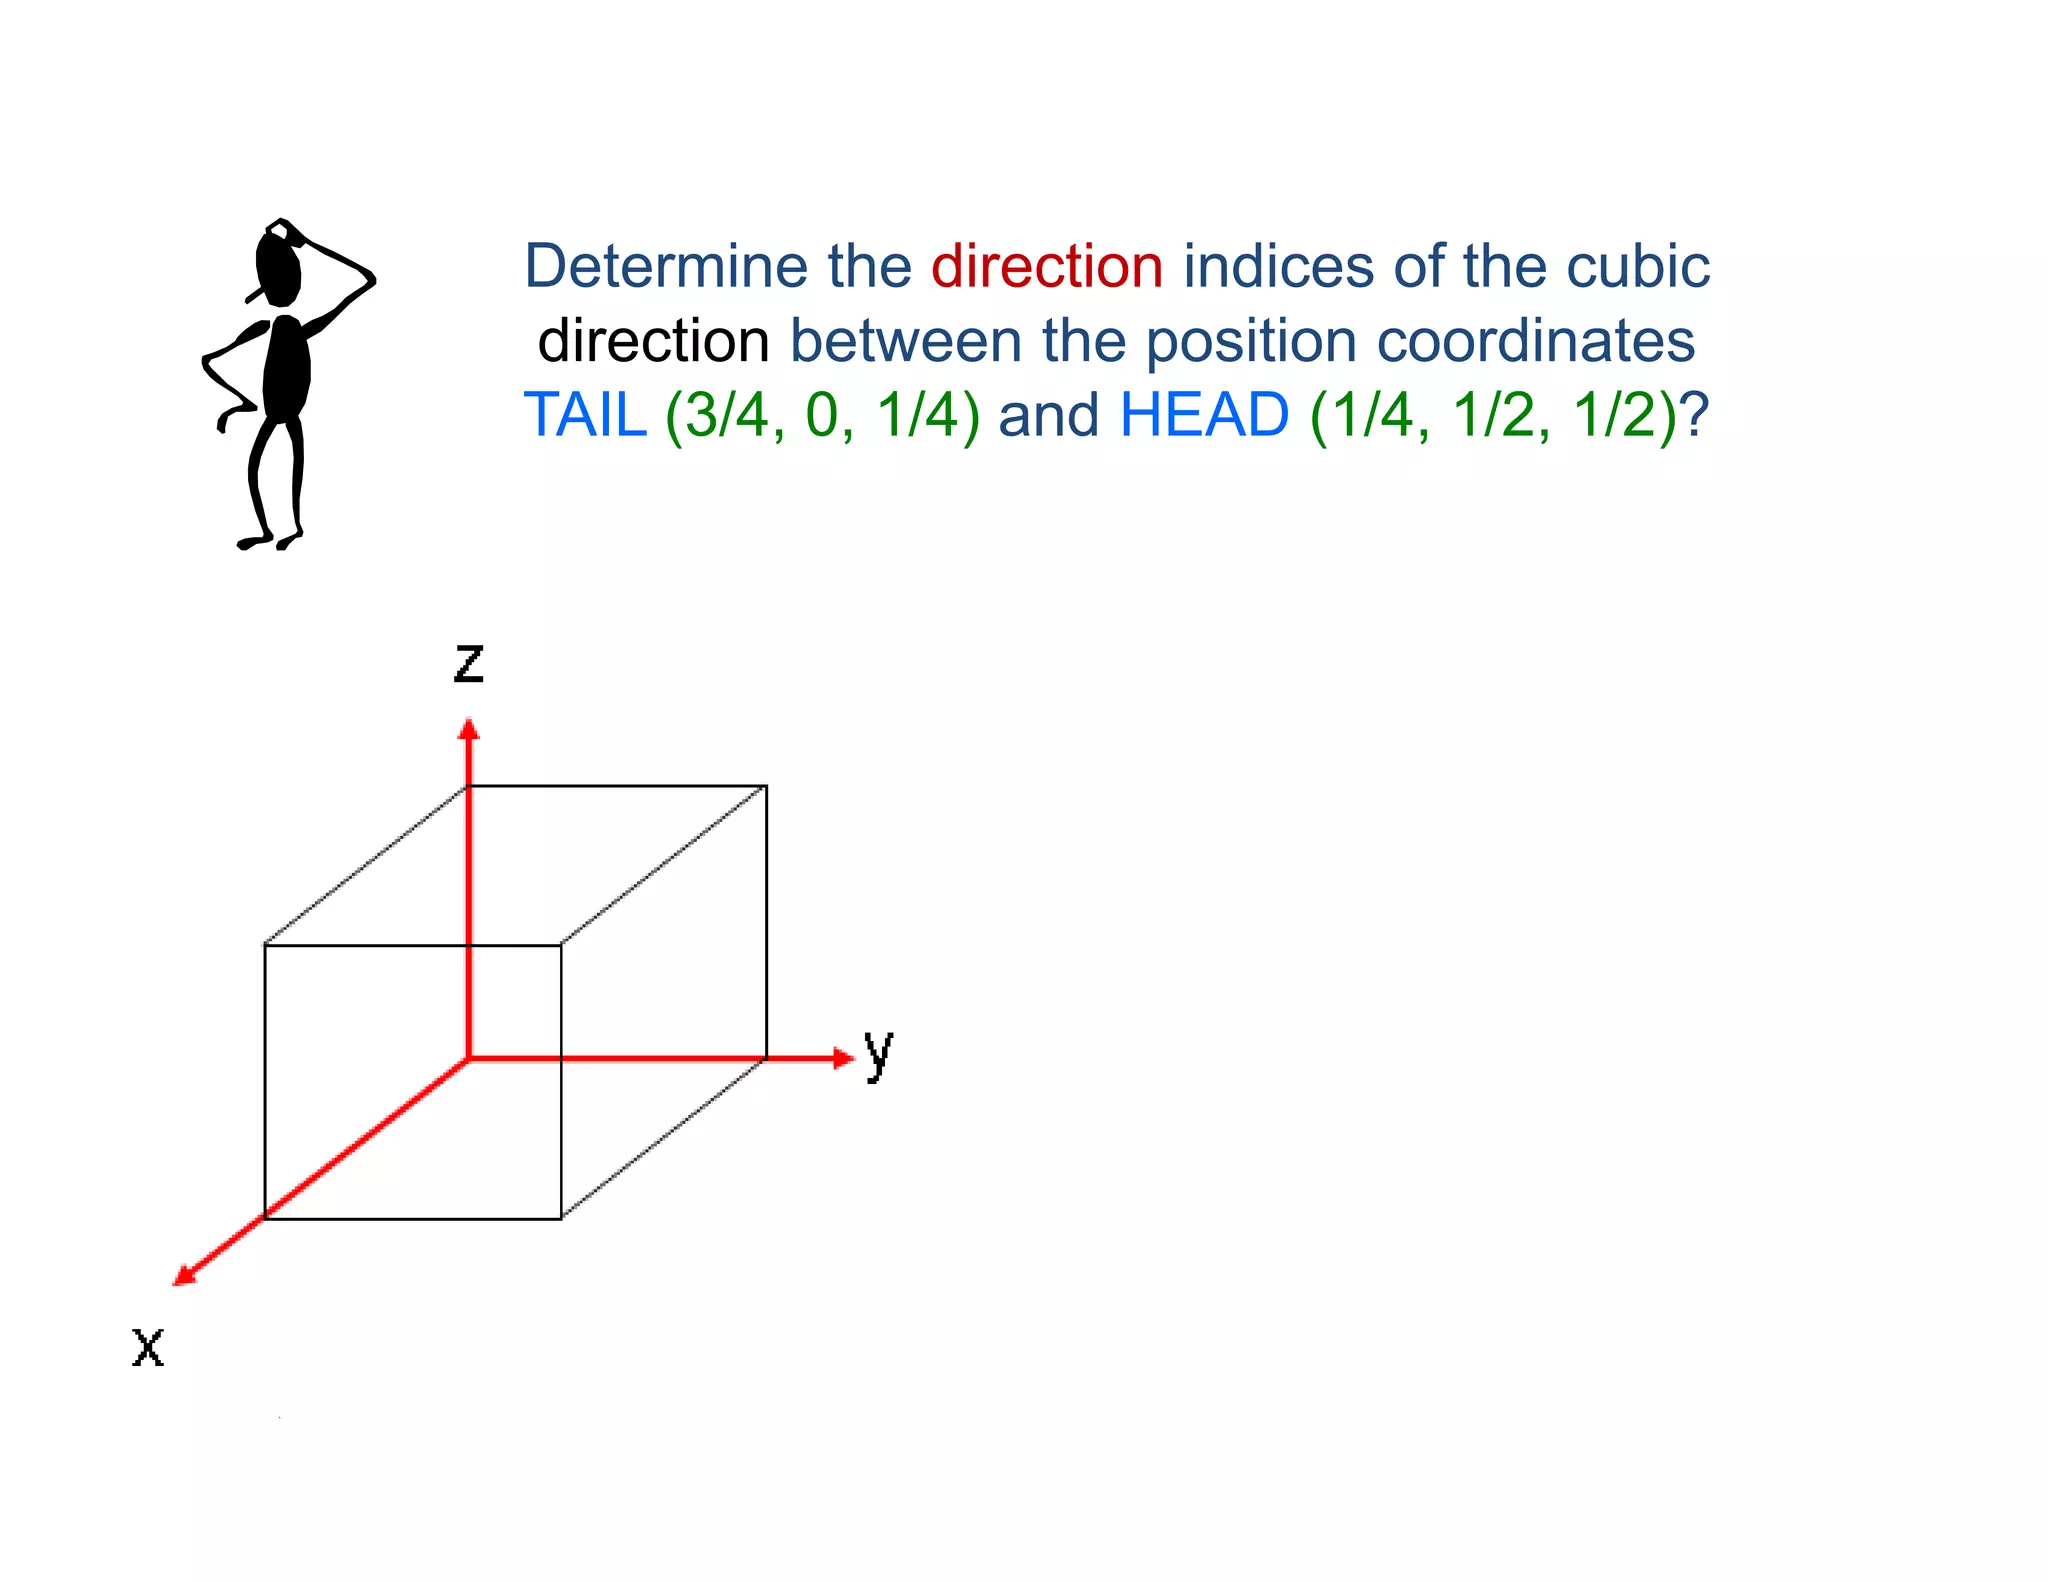
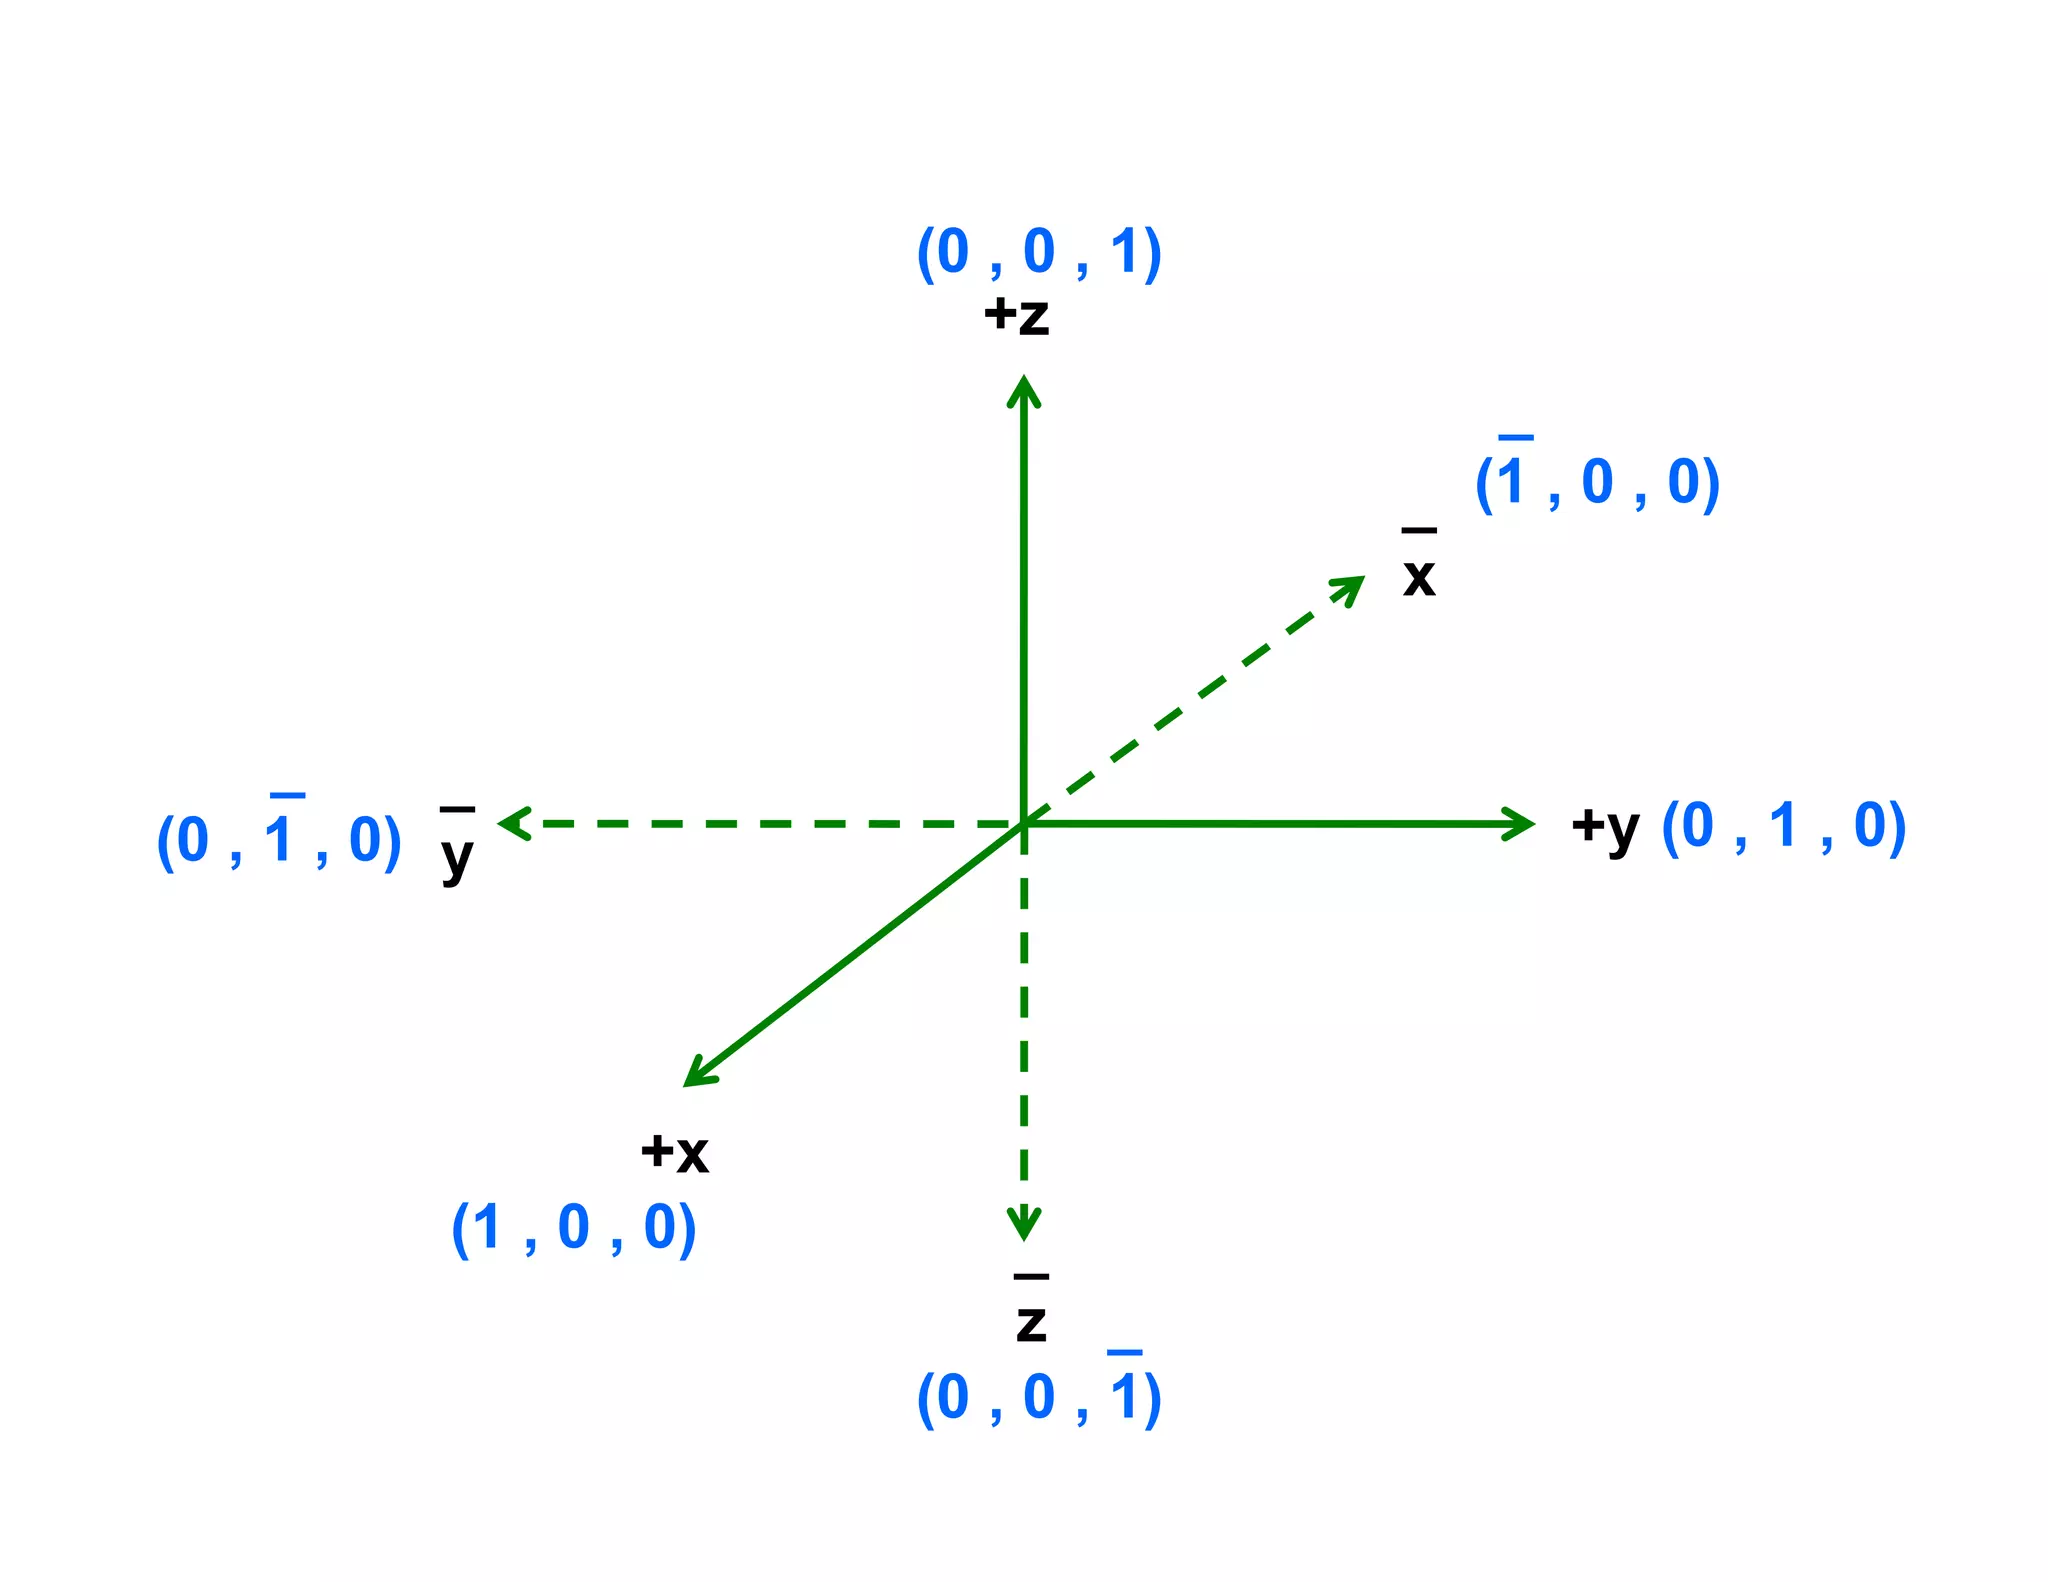
MILLER INDICES OF A DIRECTION
How to determine crystal direction indices?
i) Determine the length of the vector
projection on each of the three axes,
based on .
ii) These three numbers are expressed as the
smallest integers and negative quantities
are indicated with an overbar.
iii) Label the direction [hkl]. Figure : Examples of direction
Axis X Y Z
Head (H) x2 y2 z2
Tail (T) x1 y1 z1
Head (H) –Tail (T) x2-x1 y2-y1 z2-z1
Reduction (if necessary)
Enclosed [h k l]
* No reciprocal involved.](https://image.slidesharecdn.com/9cztb0vaqk6kf4x1vwe8-signature-d98e614c44bb5d5fcfc79eb5ed8fdbf00bc1e22d961d7a0f5fed49408756051c-poli-140724113841-phpapp02/75/Mec281-lecture-89-2048.jpg)
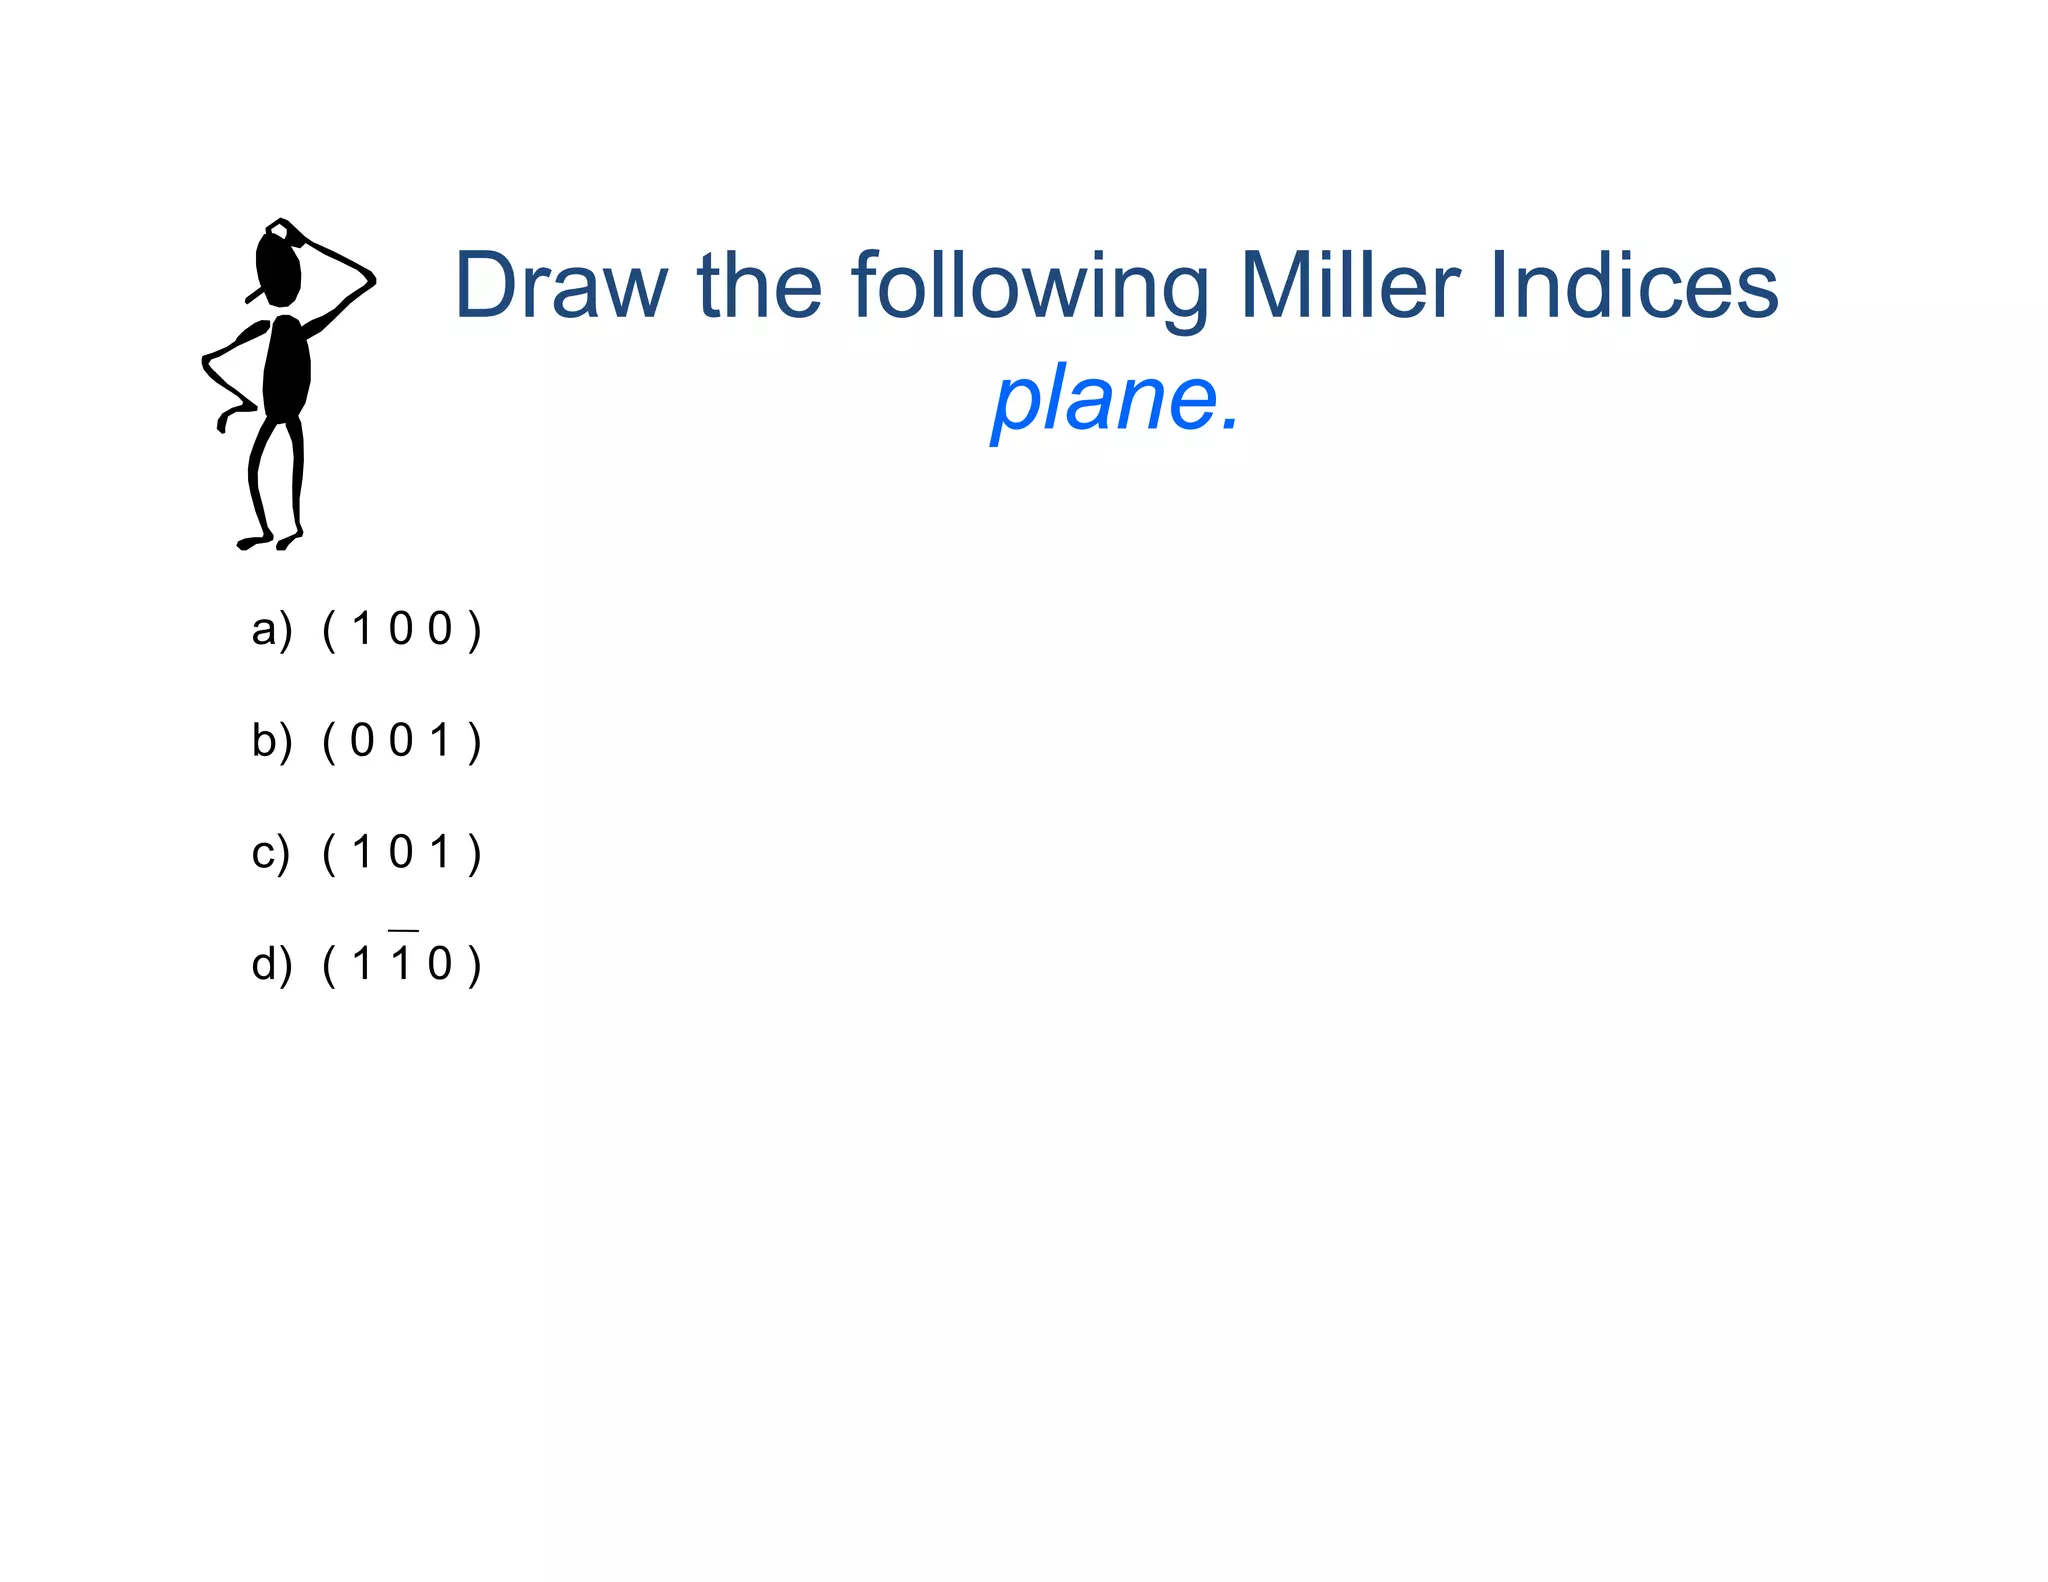
![Draw the following Miller Indices
direction.
a) [ 1 0 0 ]
b) [ 1 1 1 ]
c) [ 1 1 0 ]
d) [ 1 1 0 ]](https://image.slidesharecdn.com/9cztb0vaqk6kf4x1vwe8-signature-d98e614c44bb5d5fcfc79eb5ed8fdbf00bc1e22d961d7a0f5fed49408756051c-poli-140724113841-phpapp02/75/Mec281-lecture-94-2048.jpg)
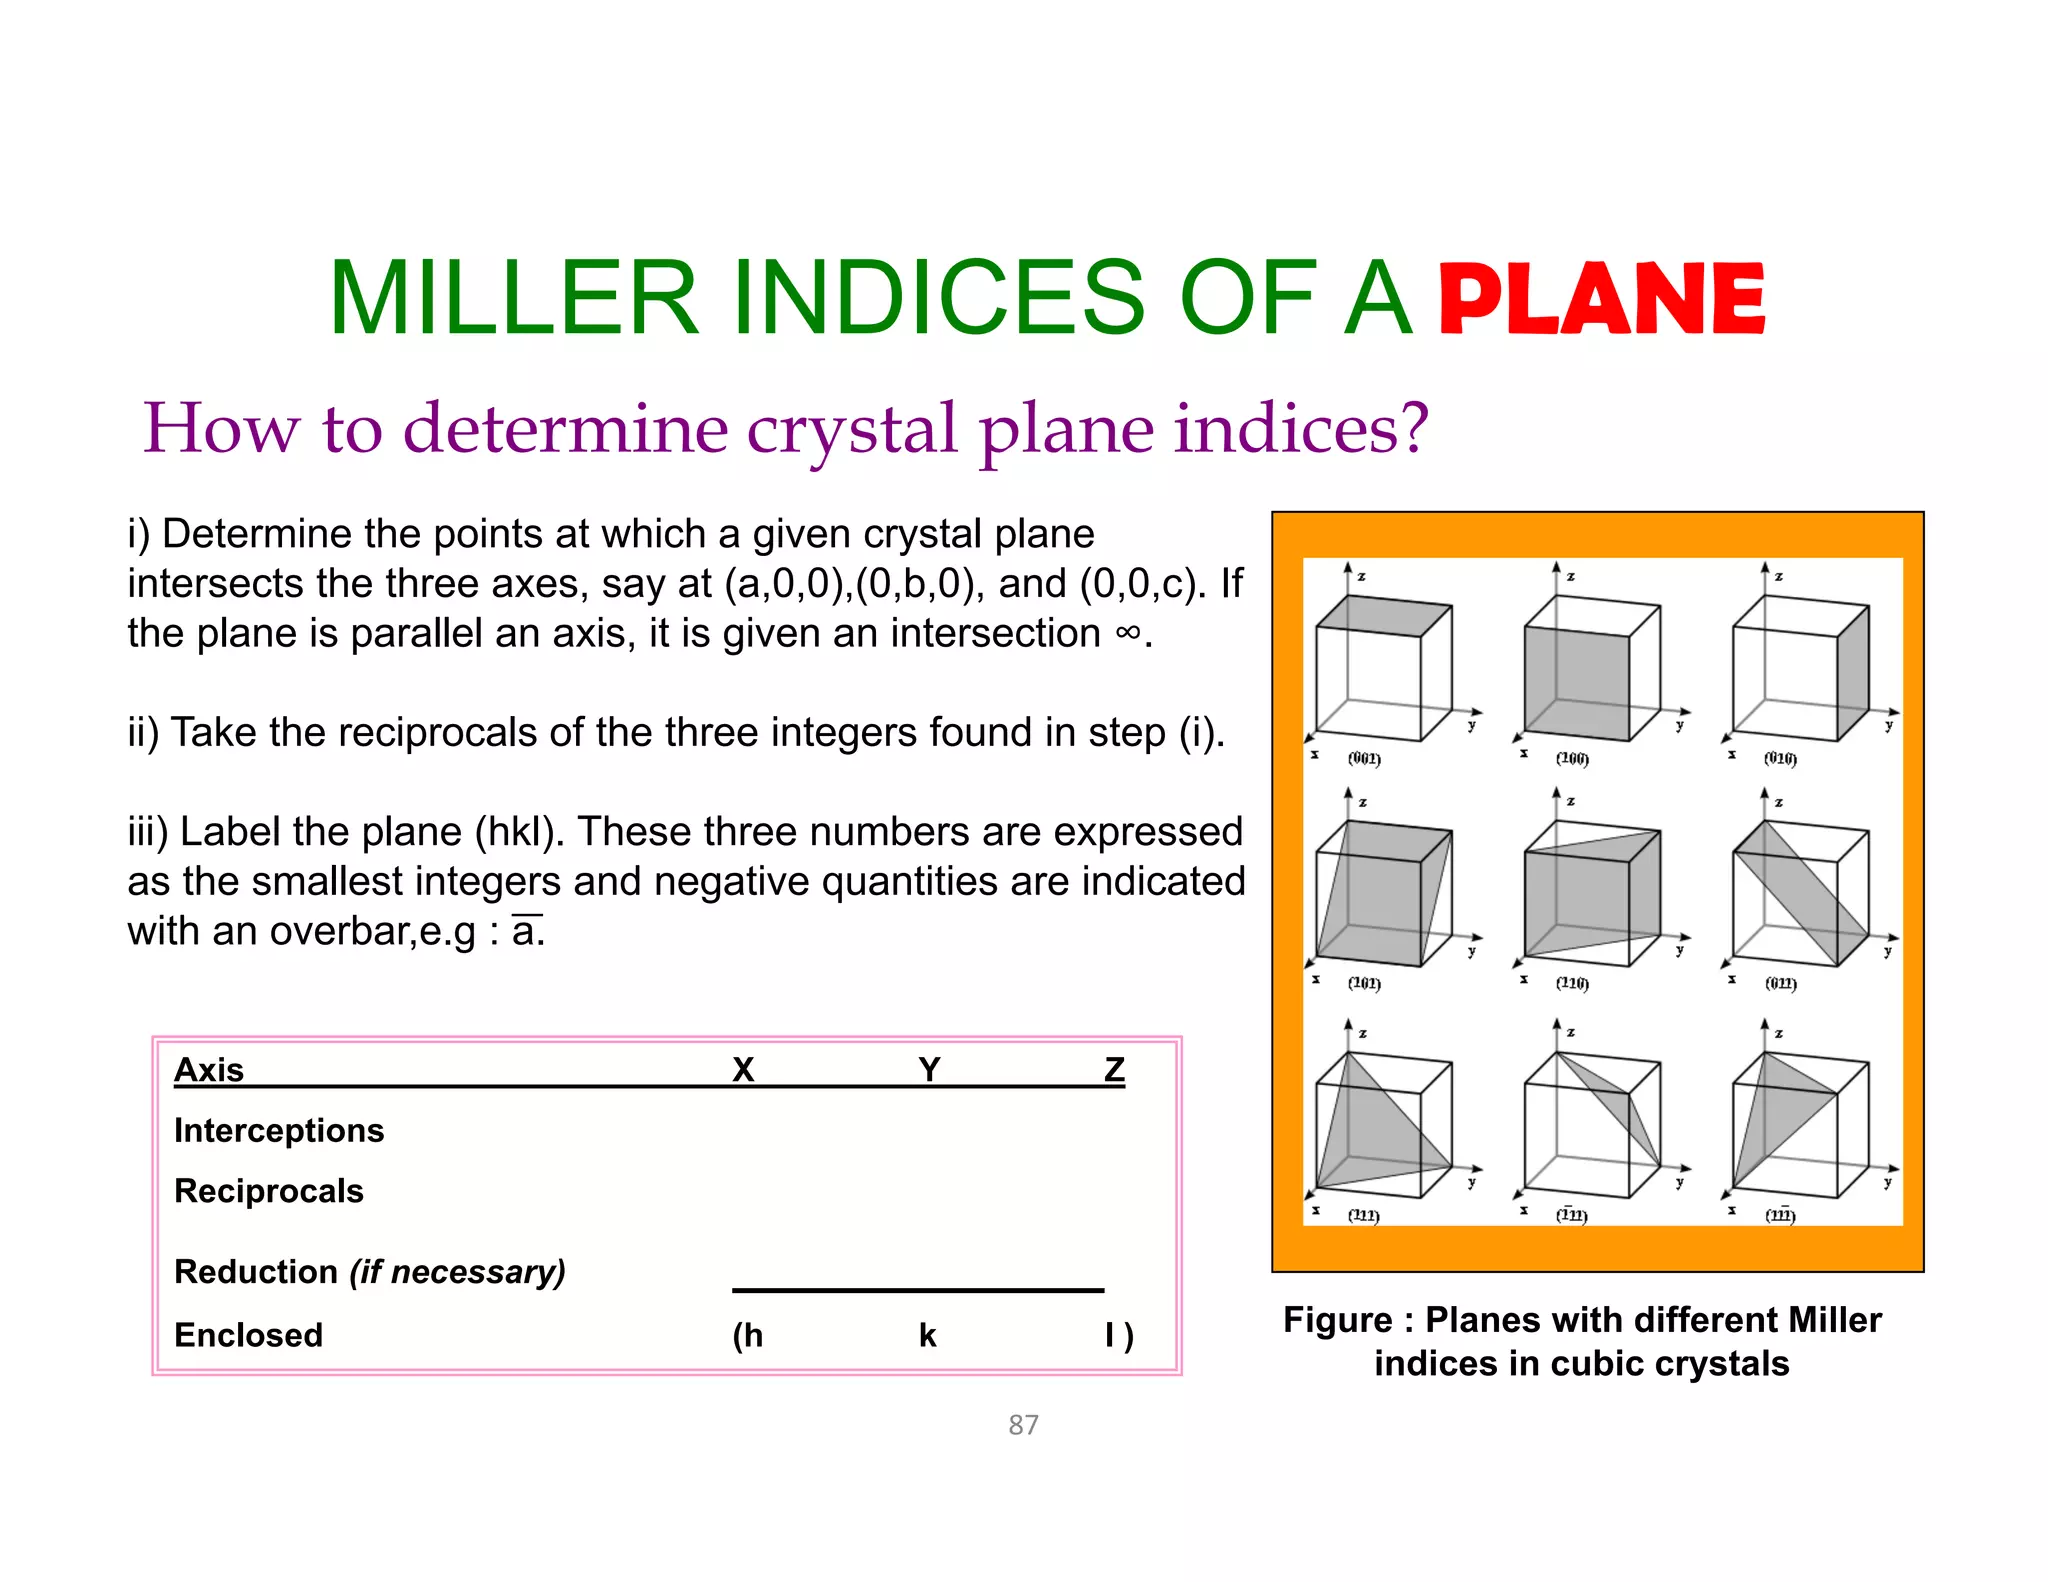
![94
NOTE (for plane and direction):
• PLANE
Make sure you enclosed your final answer in brackets (…) with no
separating commas → (hkl)
• DIRECTION
Make sure you enclosed your final answer in brackets (…) with no
separating commas → [hkl]
• FOR BOTH PLANE AND DIRECTION
Negative number should be written as follows :
-1 (WRONG)
1 (CORRECT)
Final answer for labeling the plane and direction should not have fraction
number do a reduction.](https://image.slidesharecdn.com/9cztb0vaqk6kf4x1vwe8-signature-d98e614c44bb5d5fcfc79eb5ed8fdbf00bc1e22d961d7a0f5fed49408756051c-poli-140724113841-phpapp02/75/Mec281-lecture-102-2048.jpg)

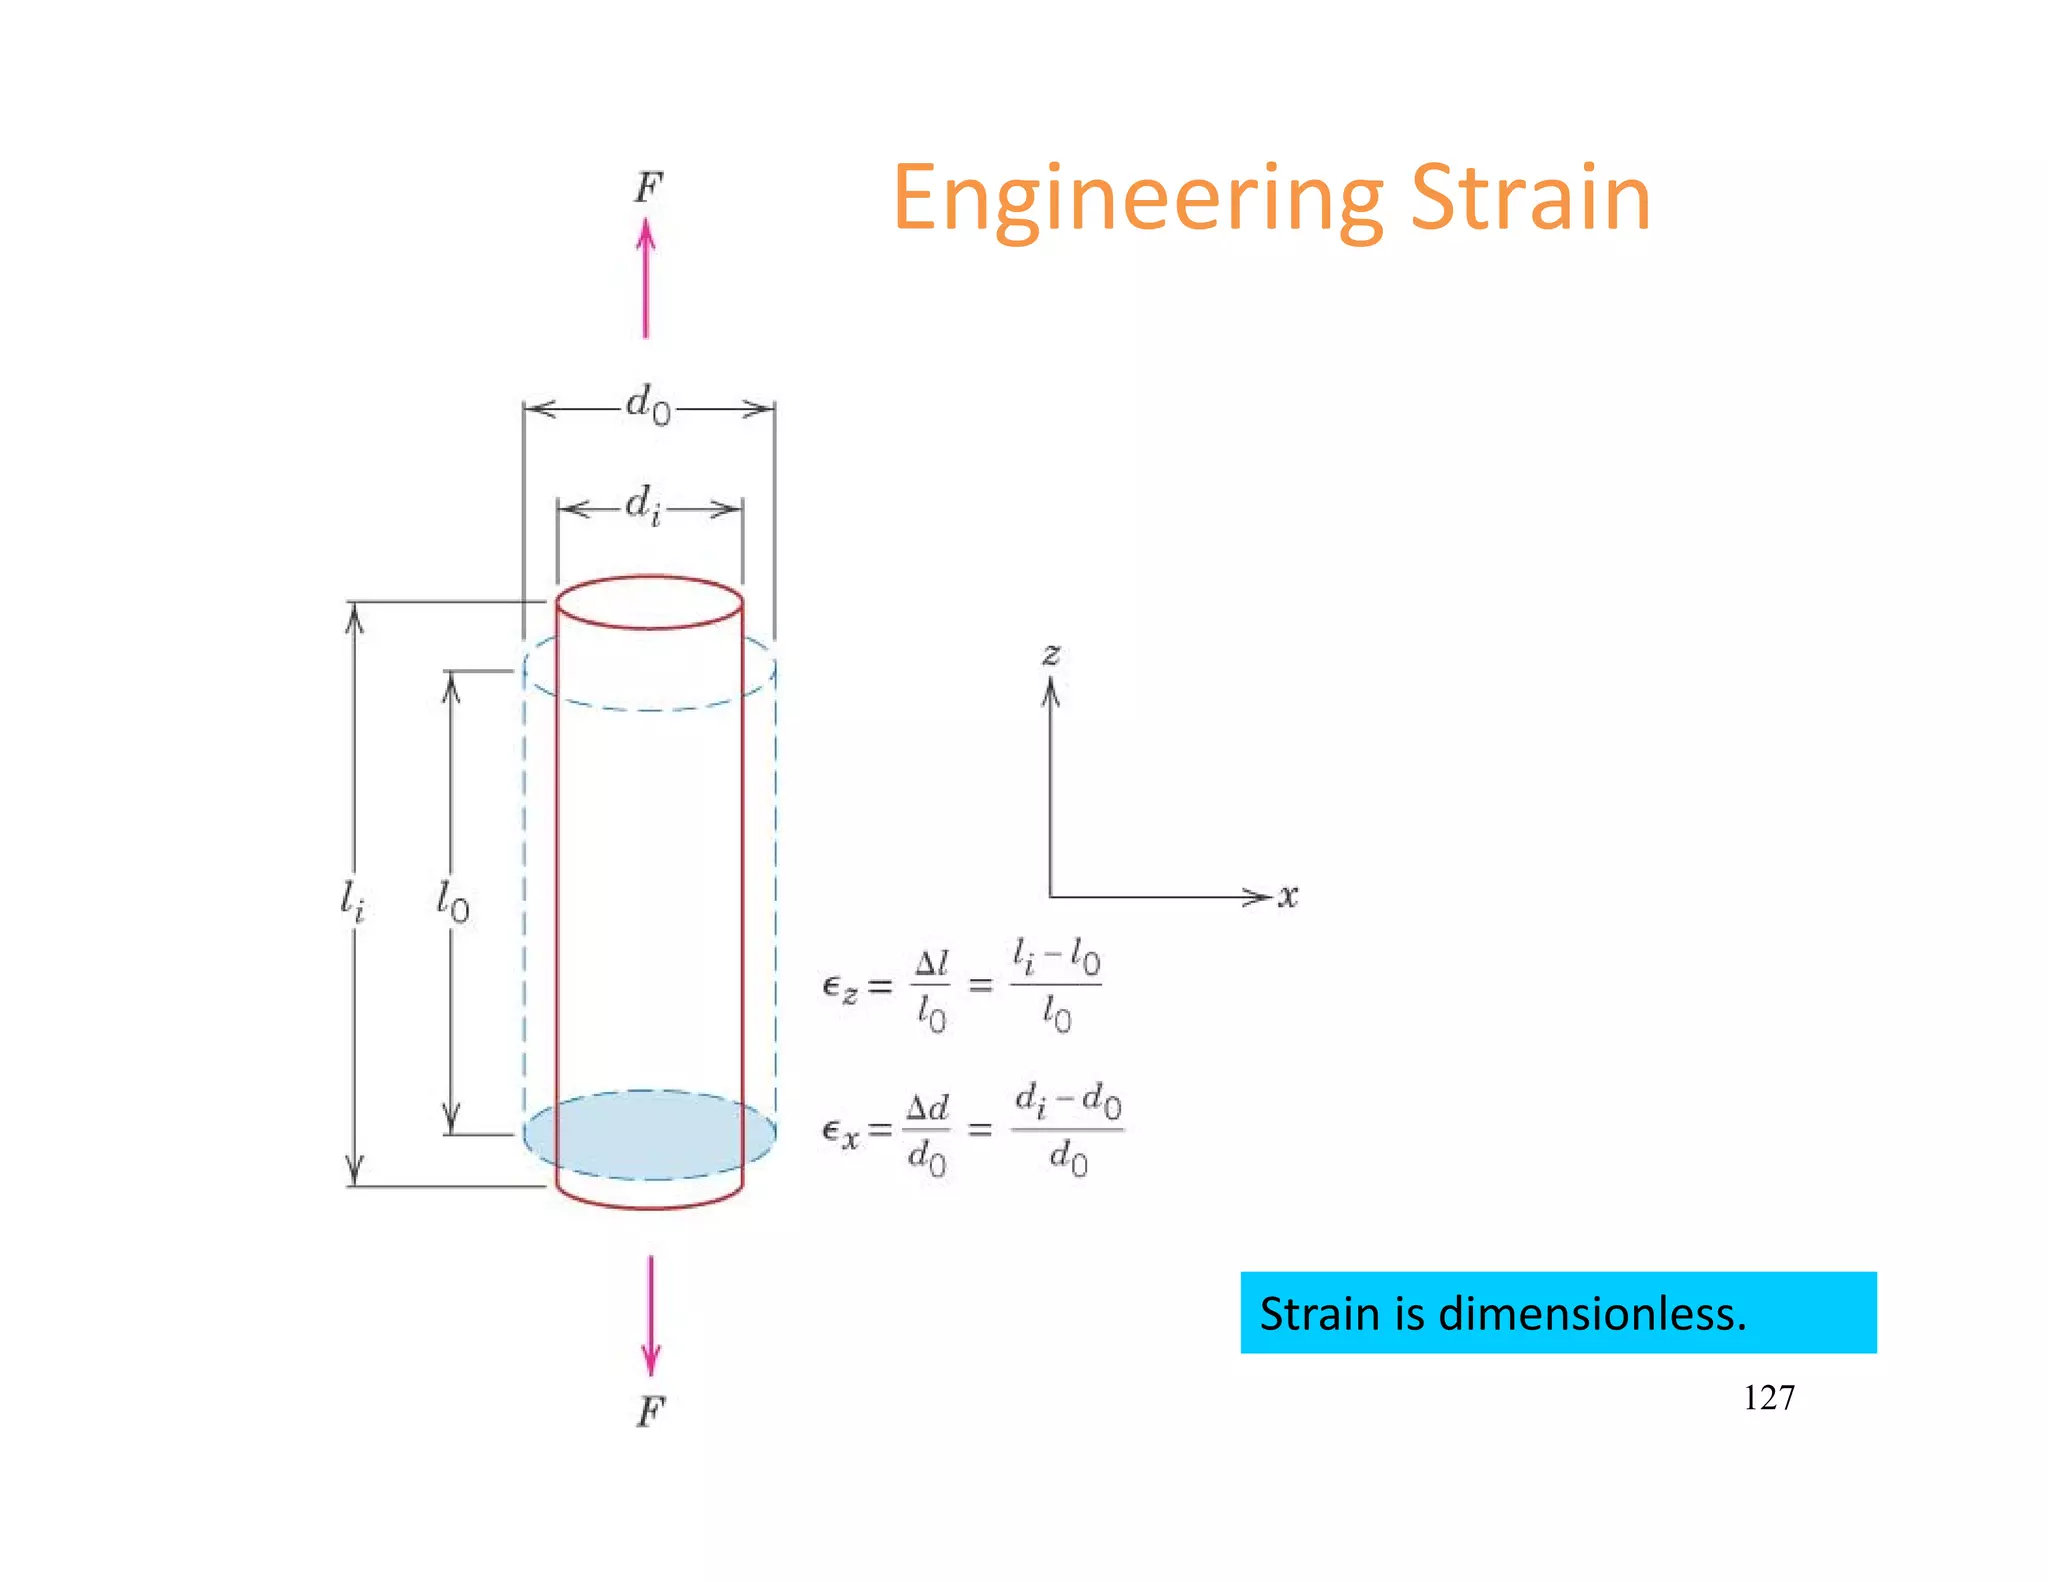
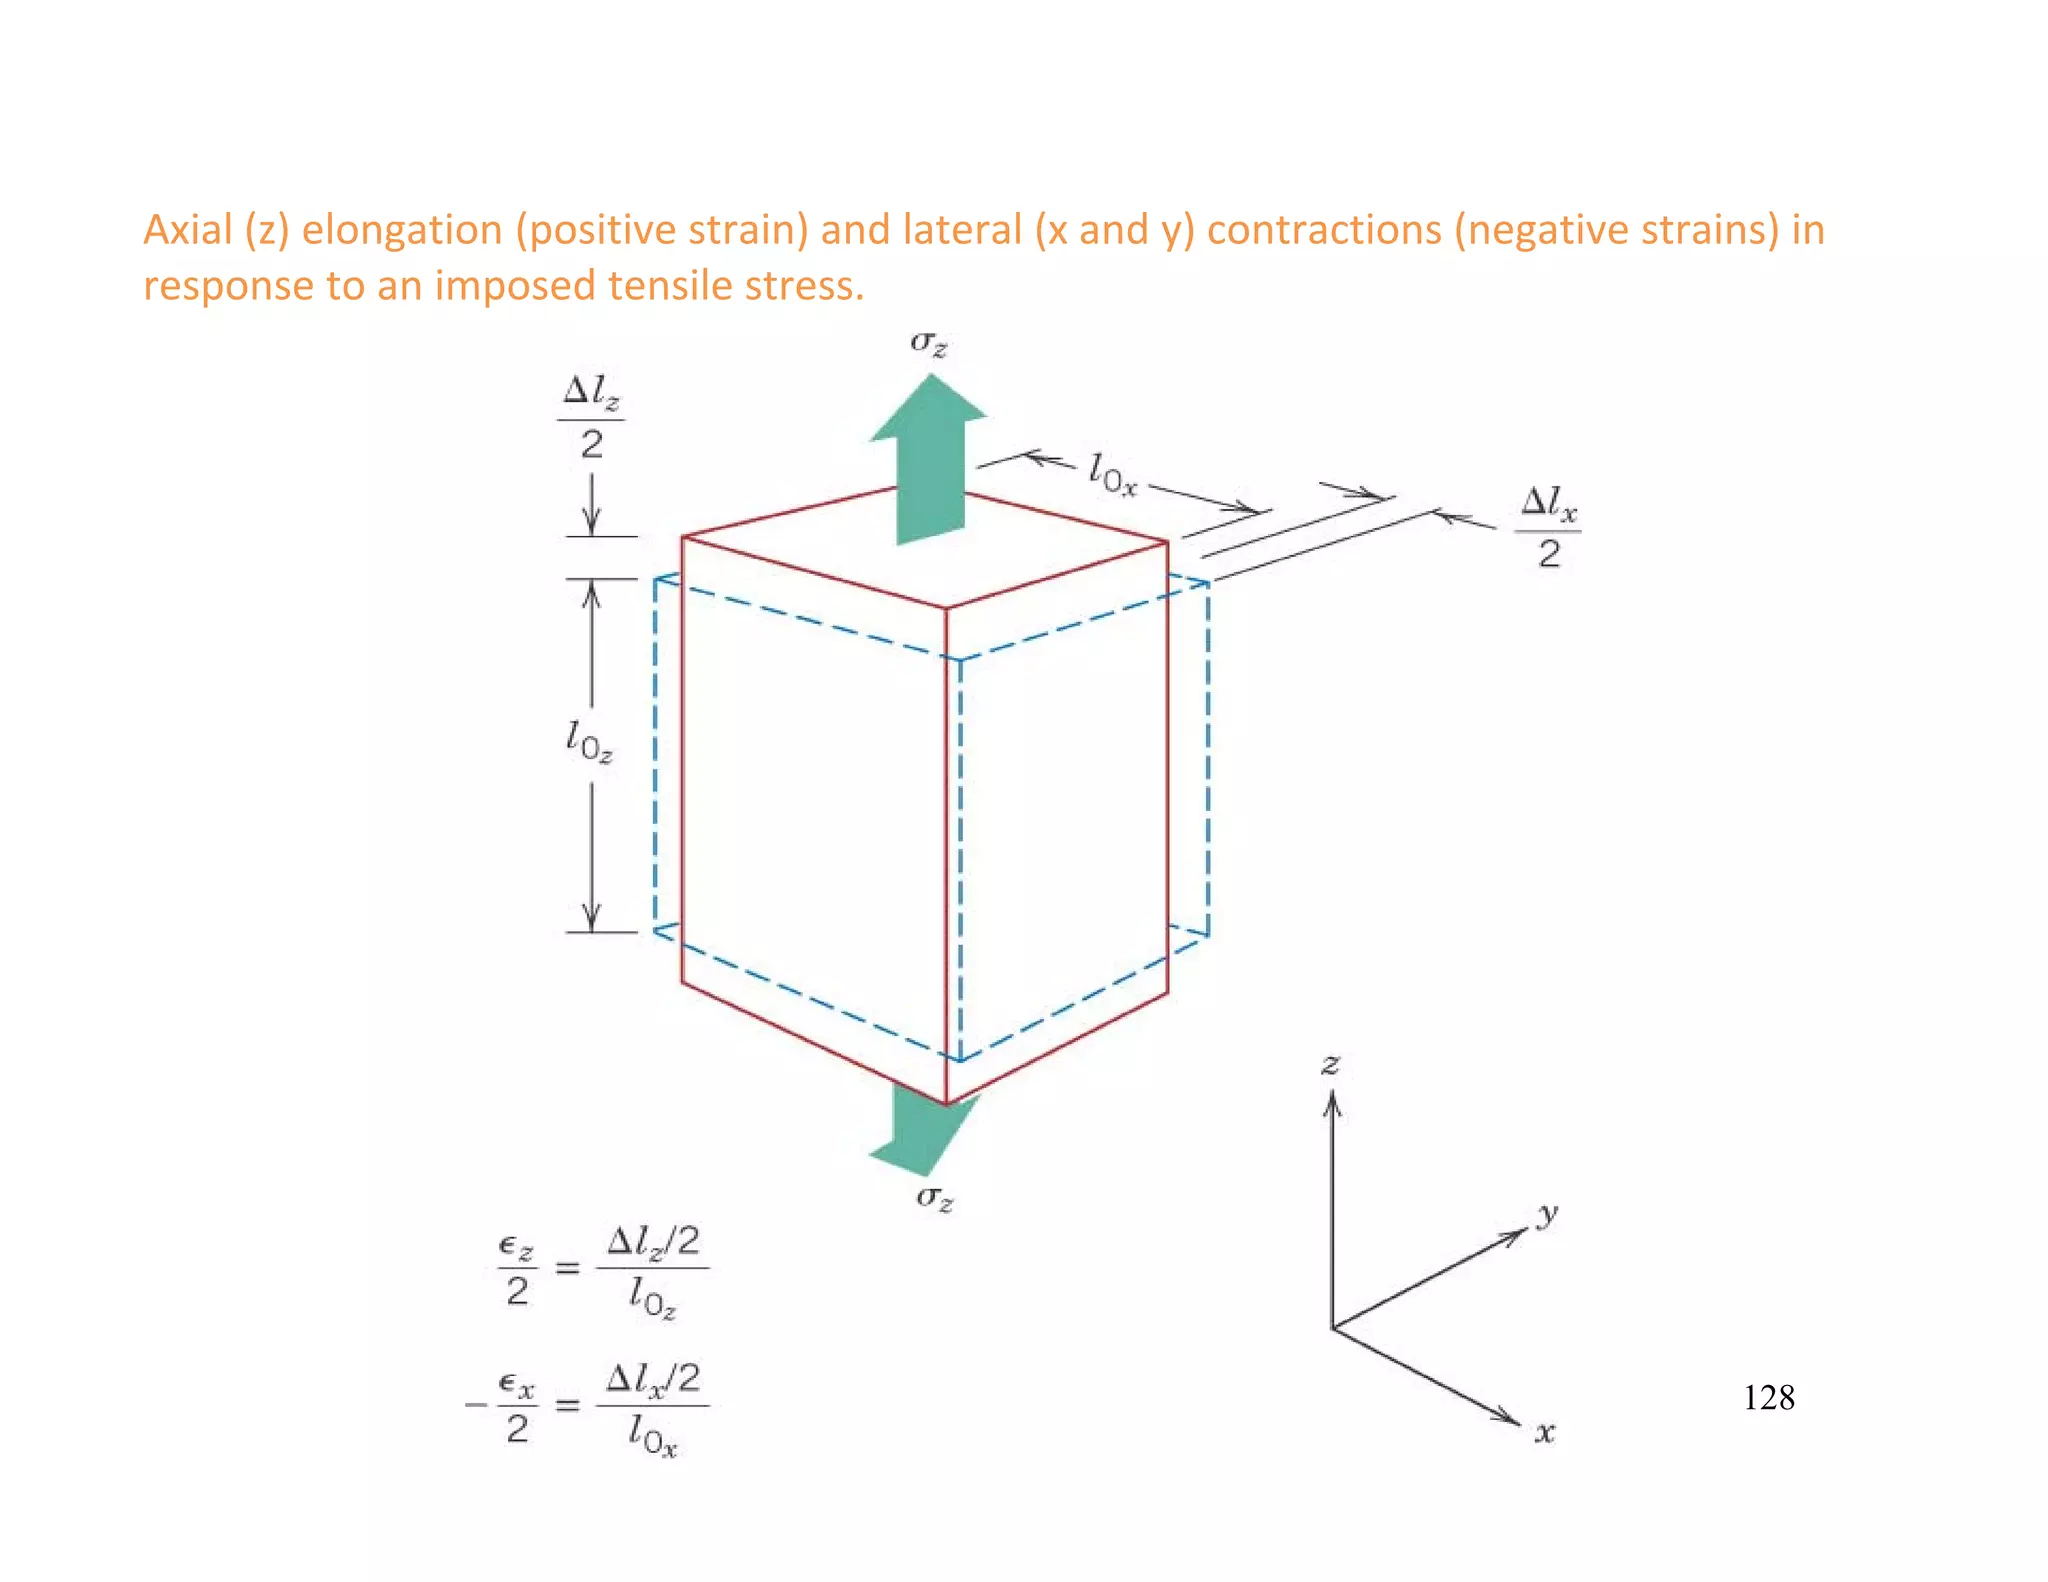
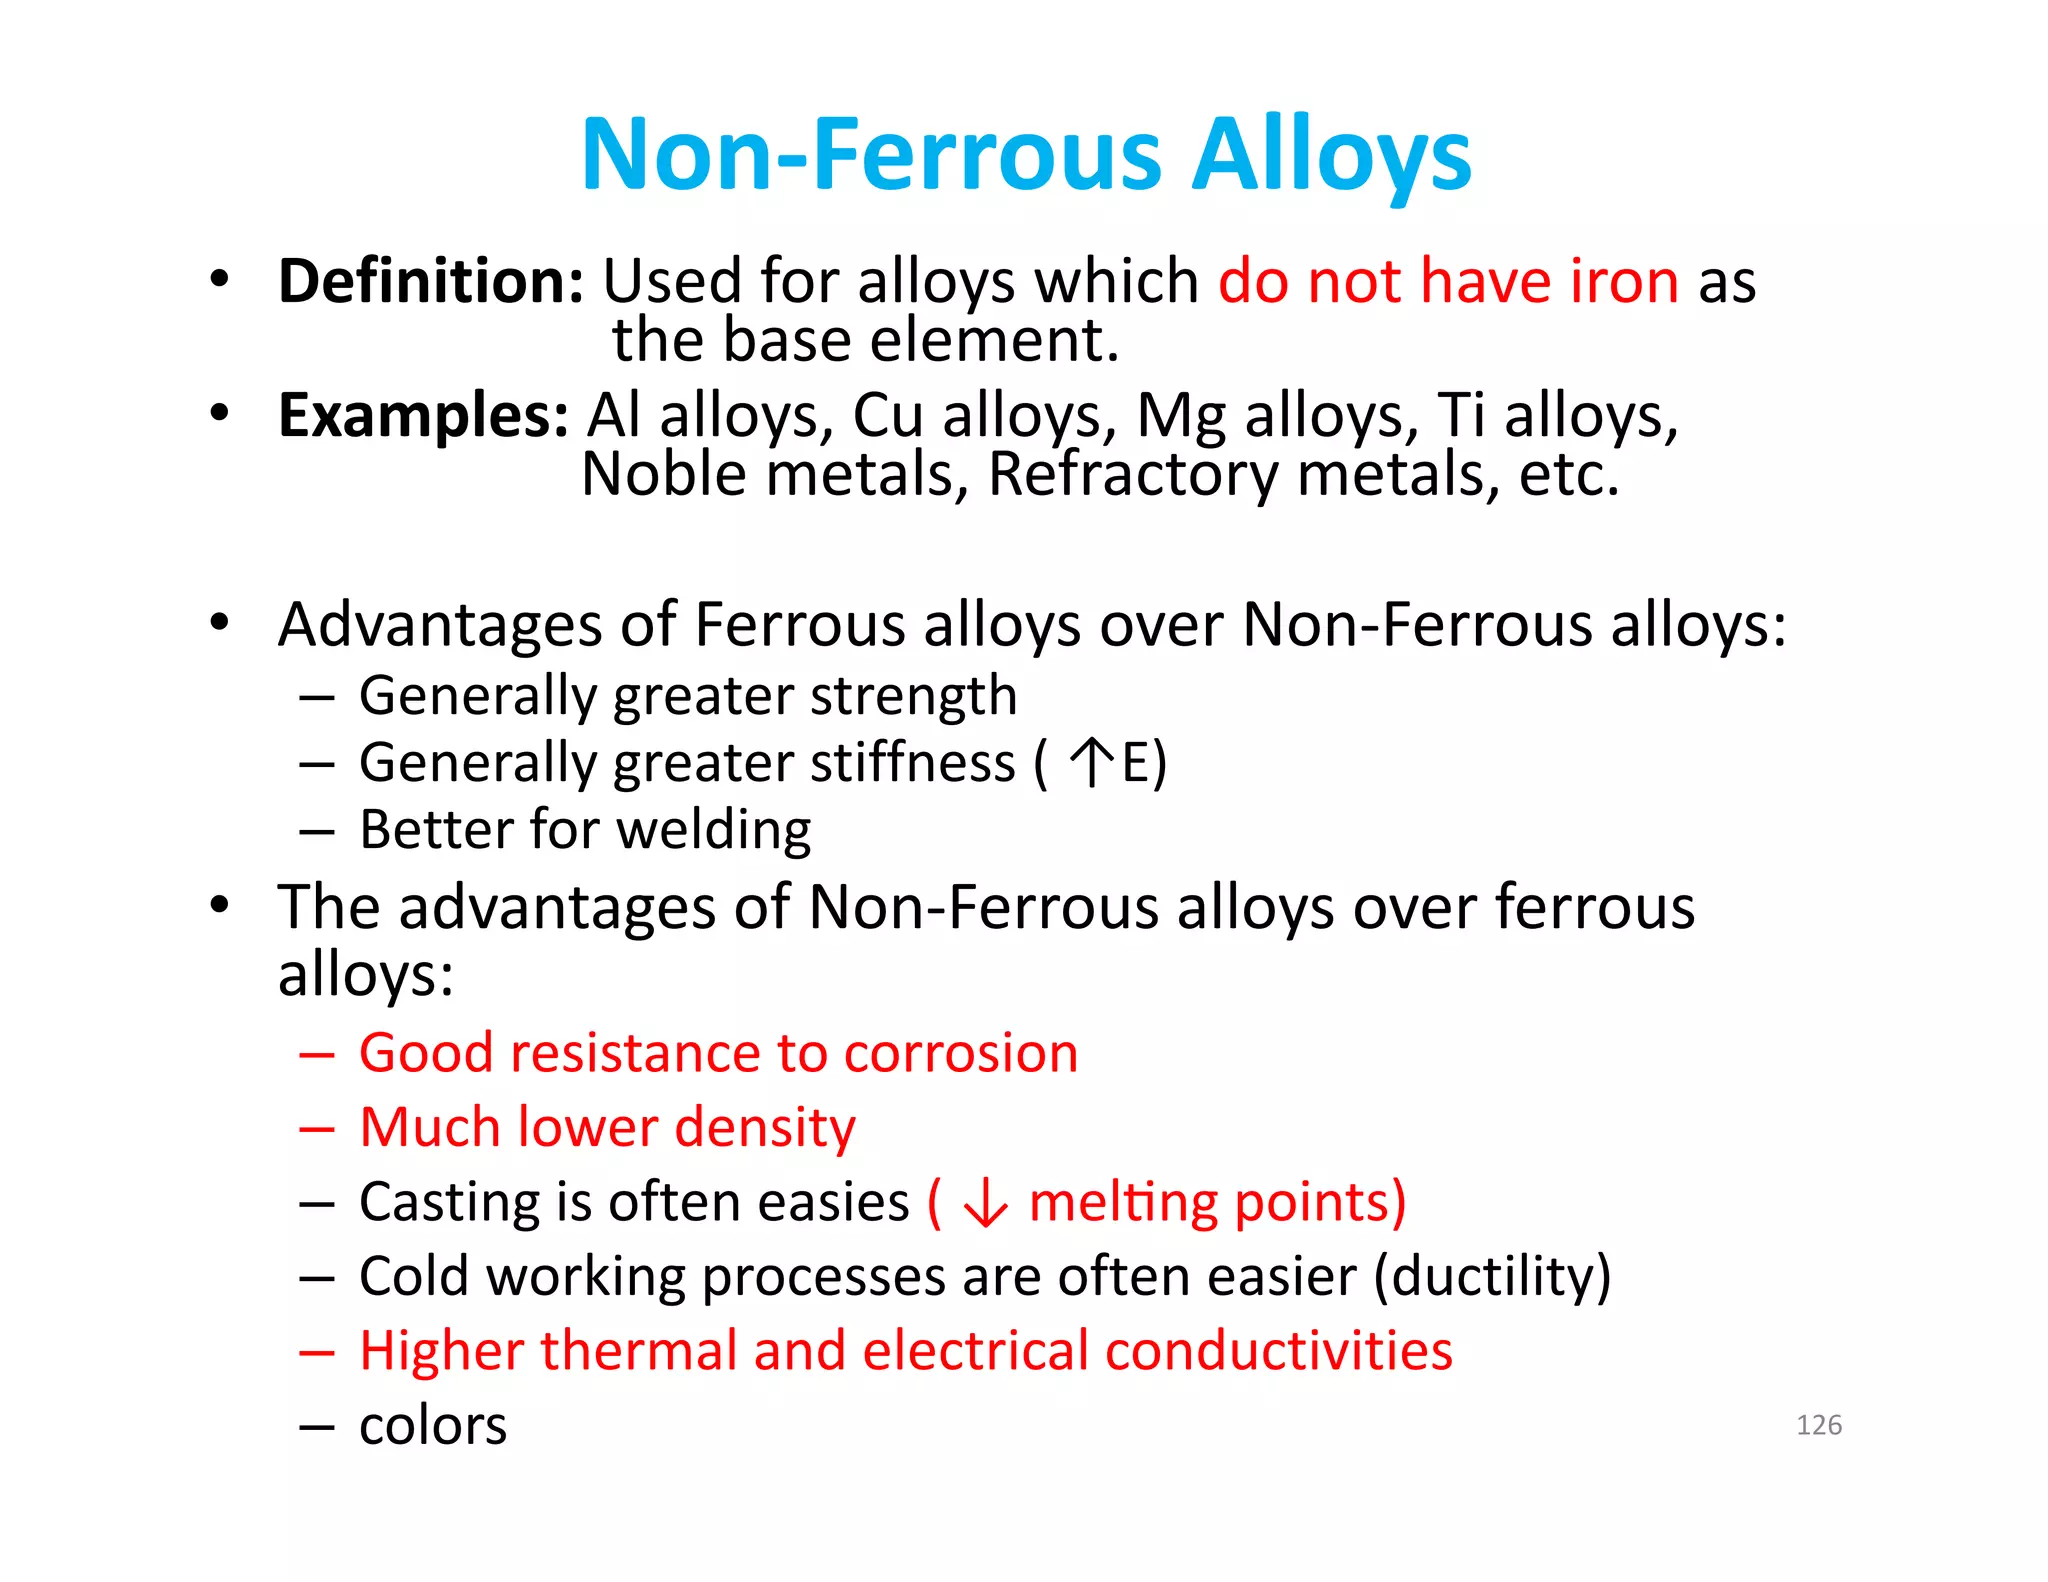
![126
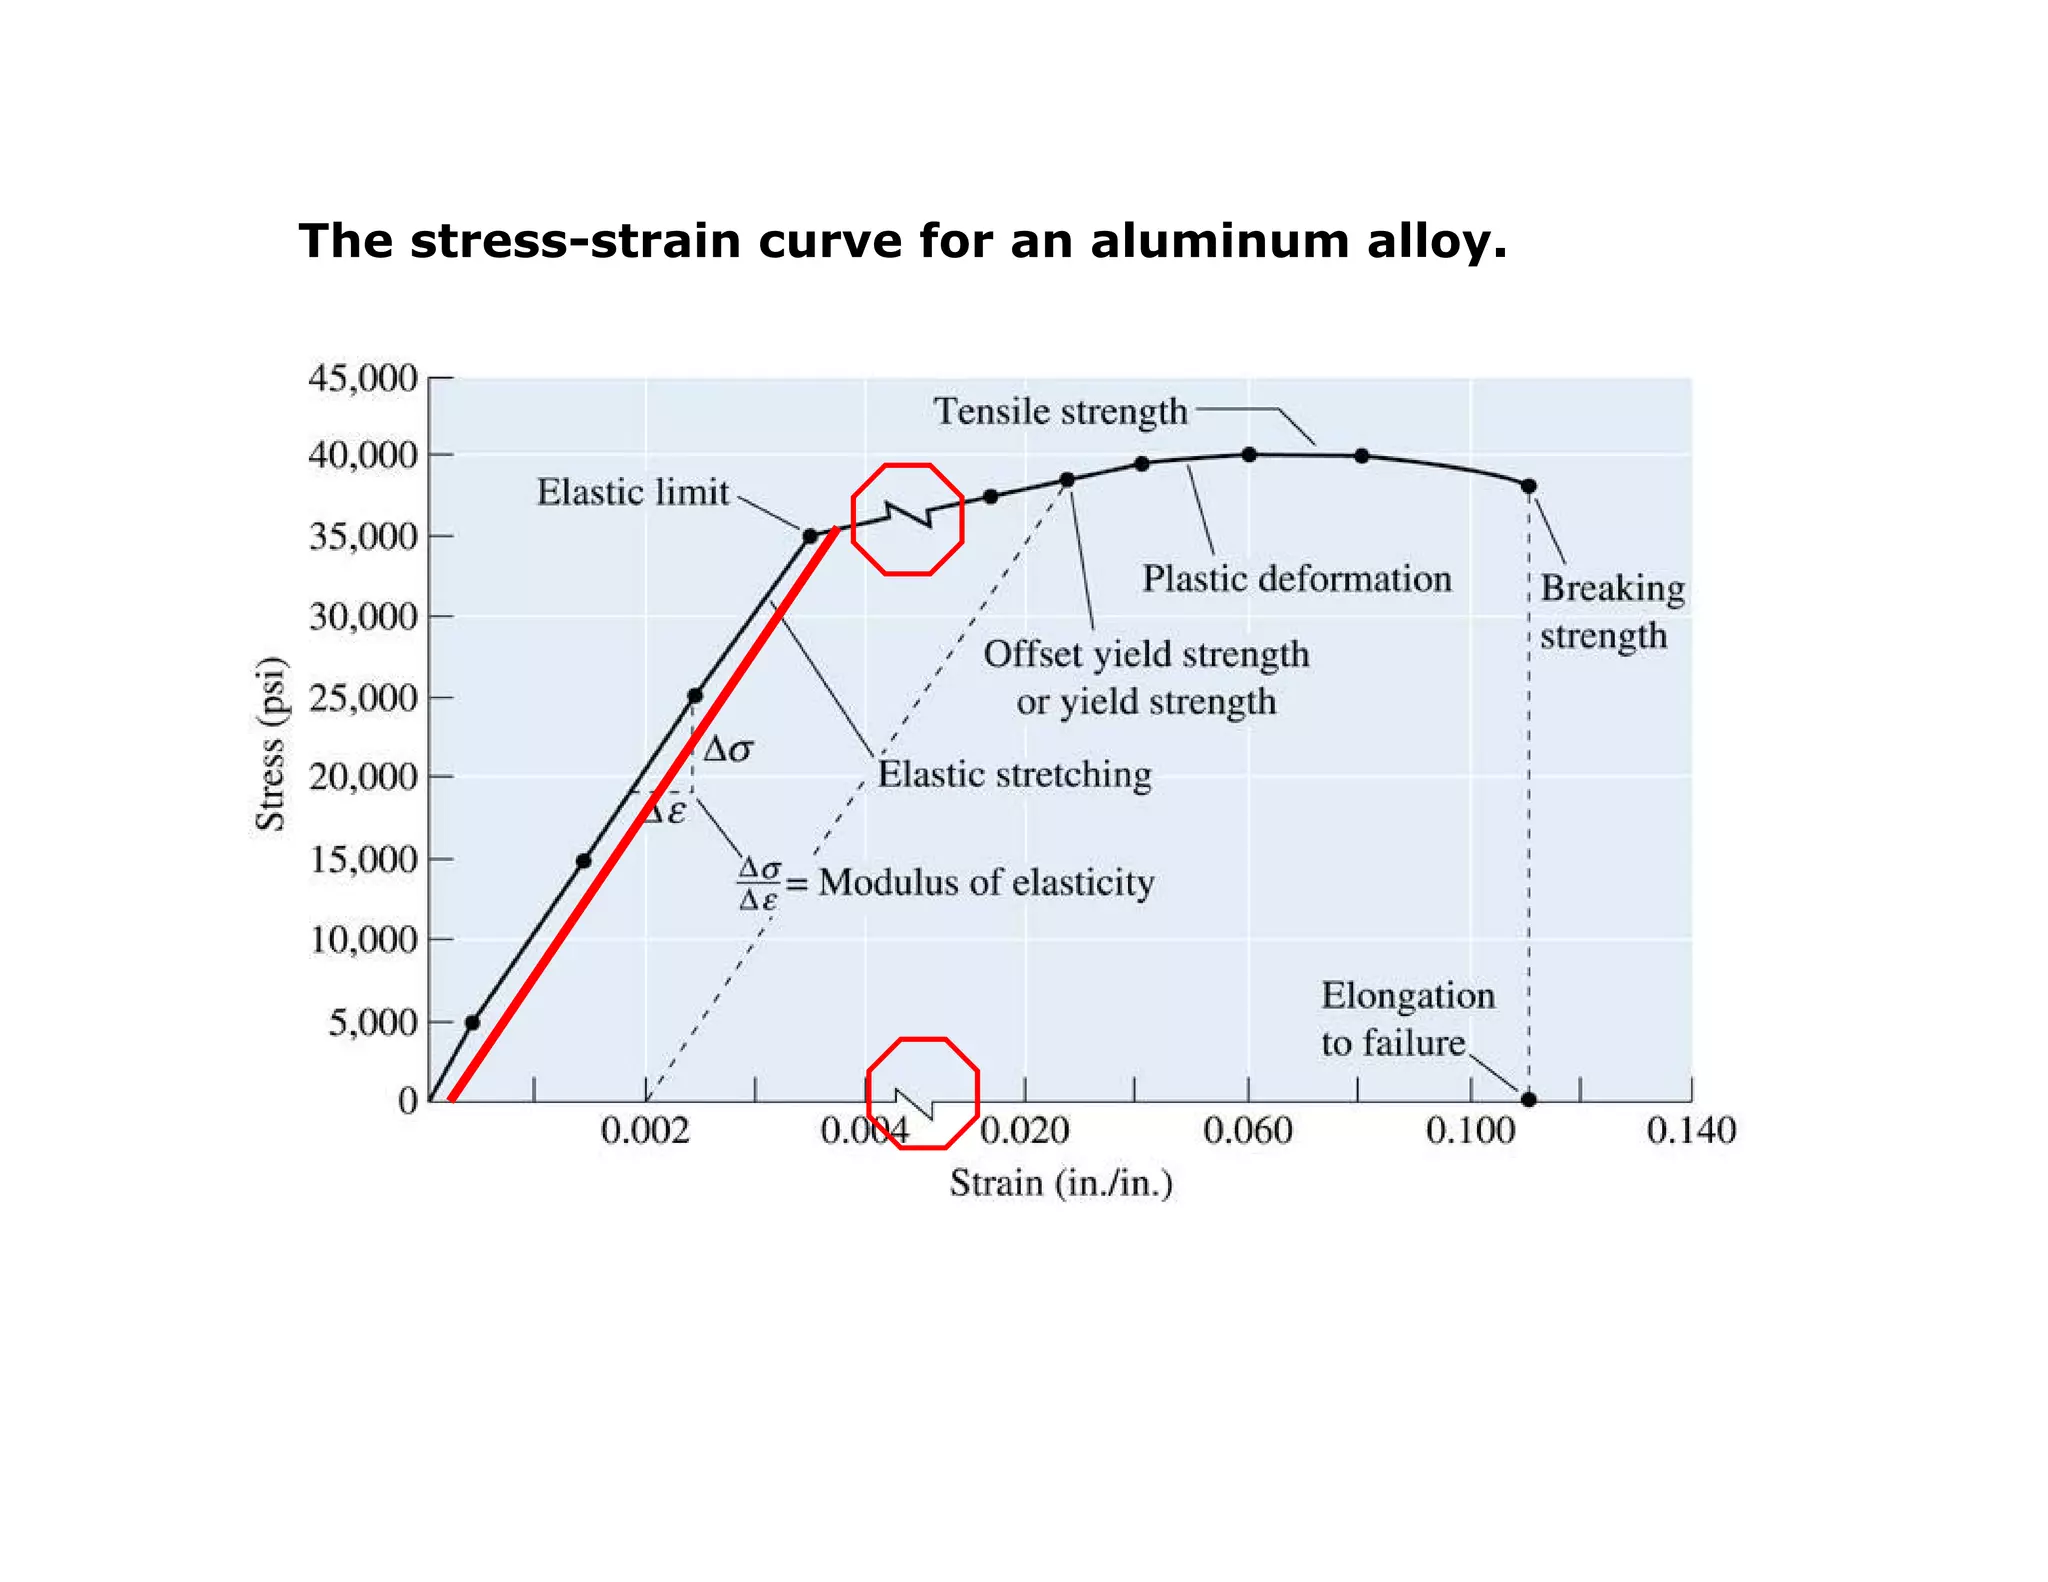
Linear Elastic Properties
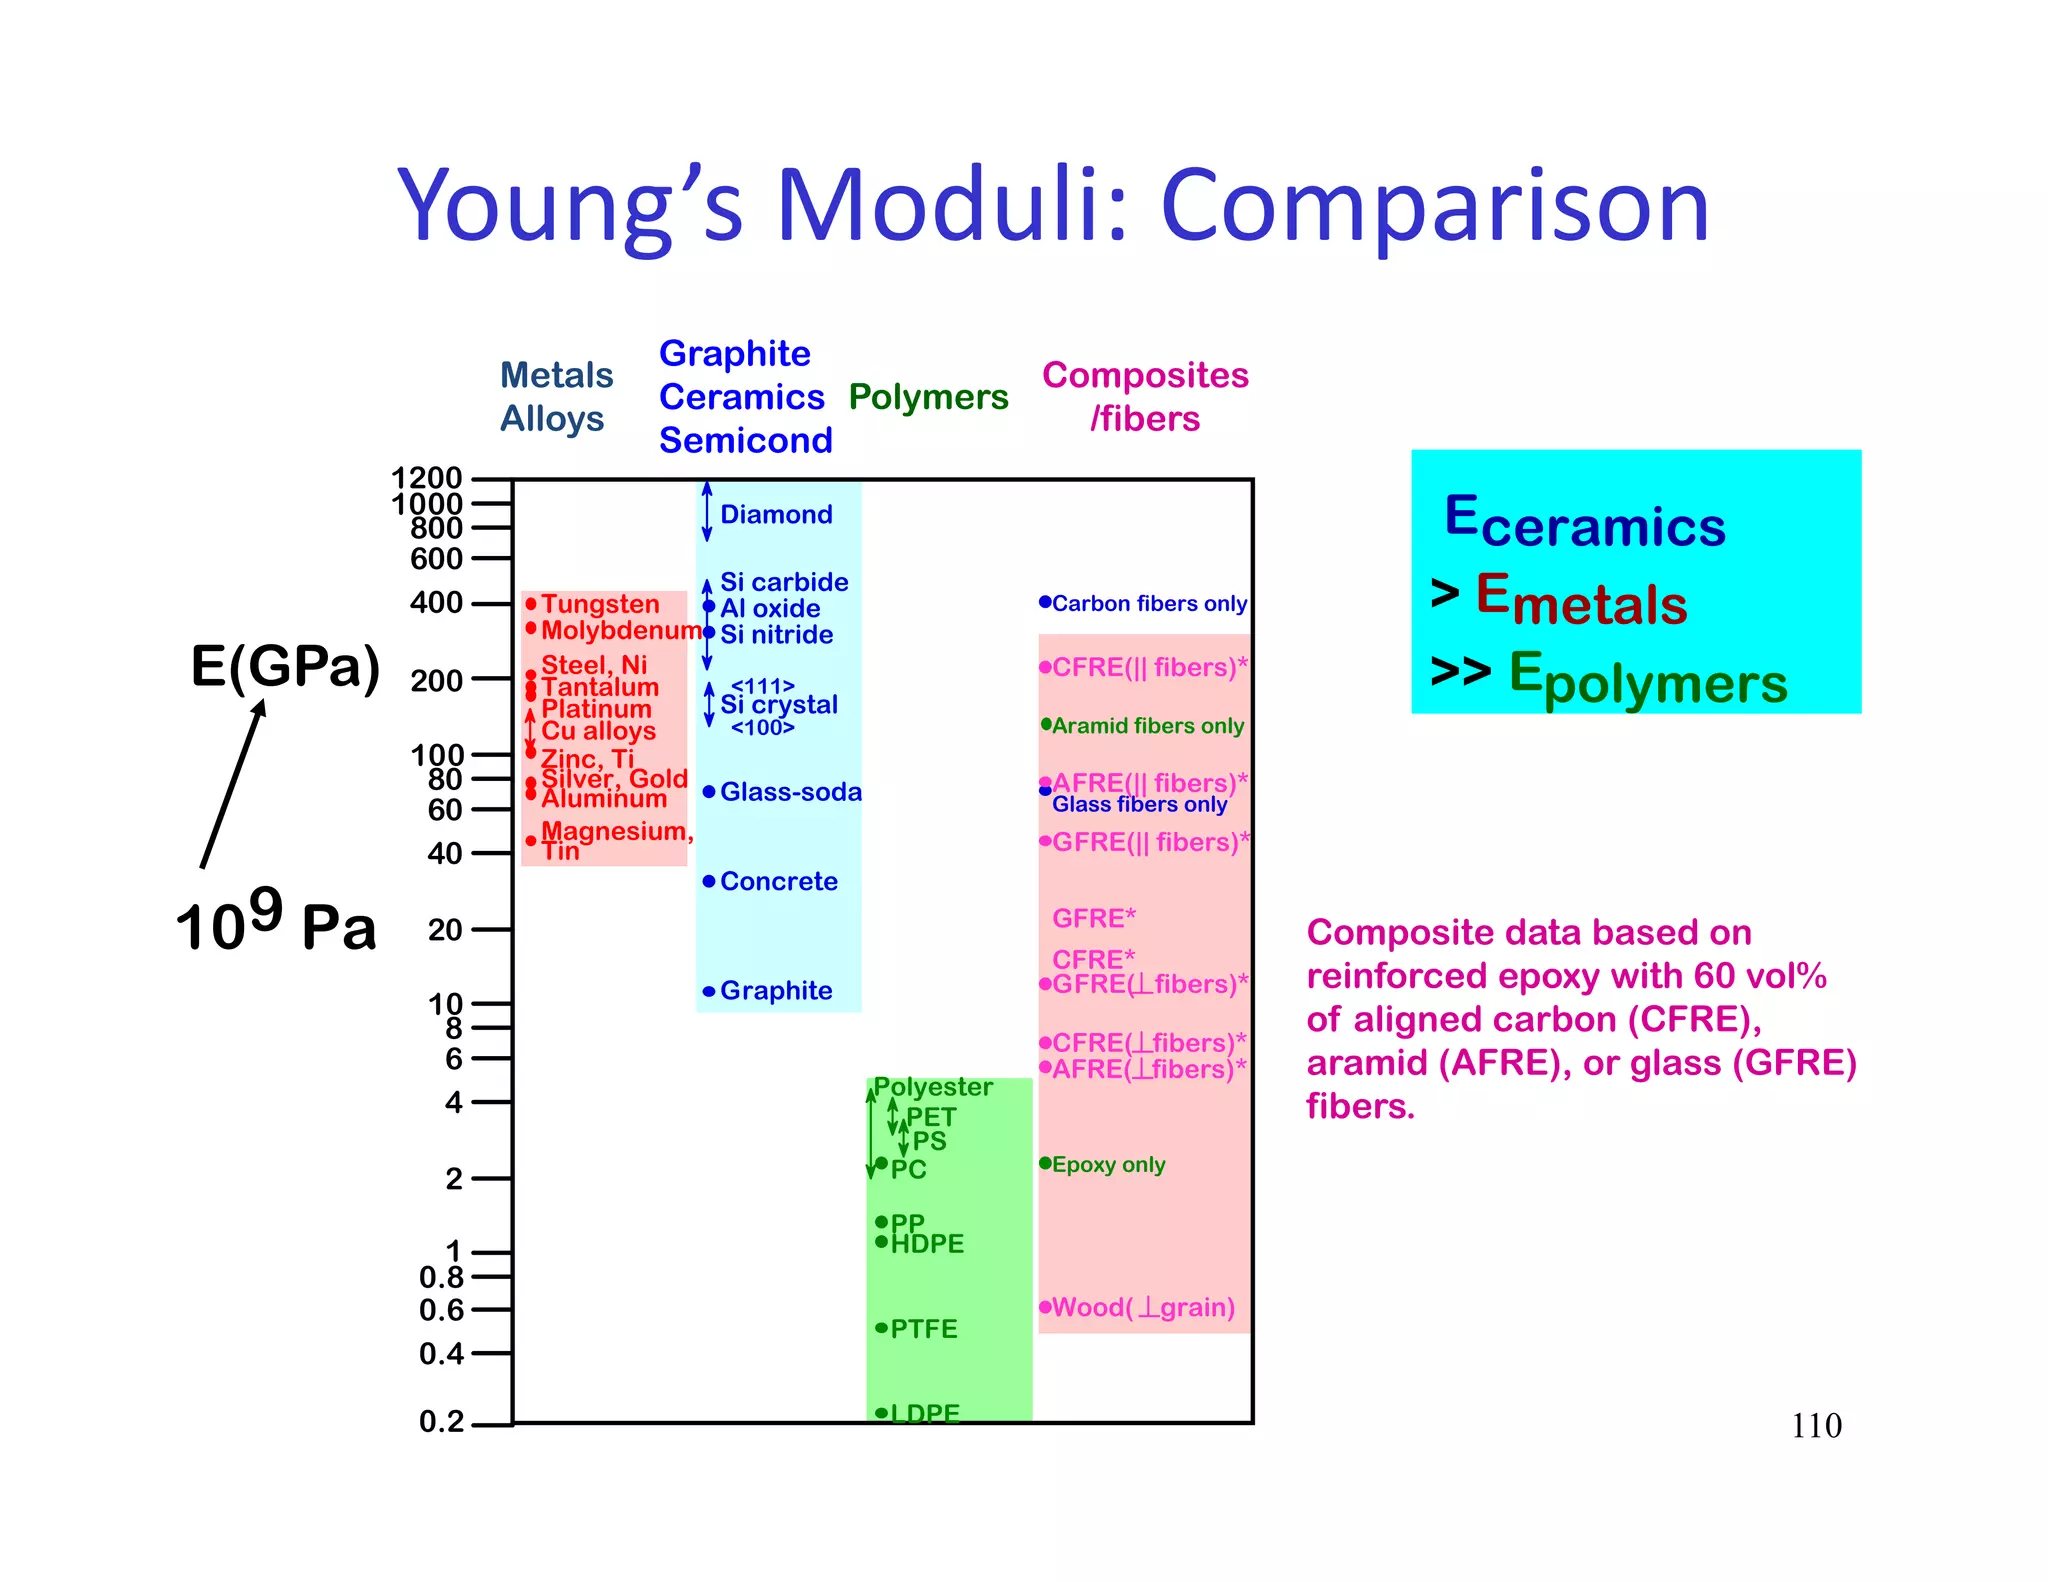
Modulus of Elasticity, E:
(Young's modulus)
• Hooke's Law: = E
• Poisson's ratio:
metals: ~ 0.33
ceramics: ~0.25
polymers: ~0.40
Linear-
elastic
1
E
Units:
E: [GPa] or [psi]
: dimensionless
F
F
simple
tension
test
xy](https://image.slidesharecdn.com/9cztb0vaqk6kf4x1vwe8-signature-d98e614c44bb5d5fcfc79eb5ed8fdbf00bc1e22d961d7a0f5fed49408756051c-poli-140724113841-phpapp02/75/Mec281-lecture-134-2048.jpg)
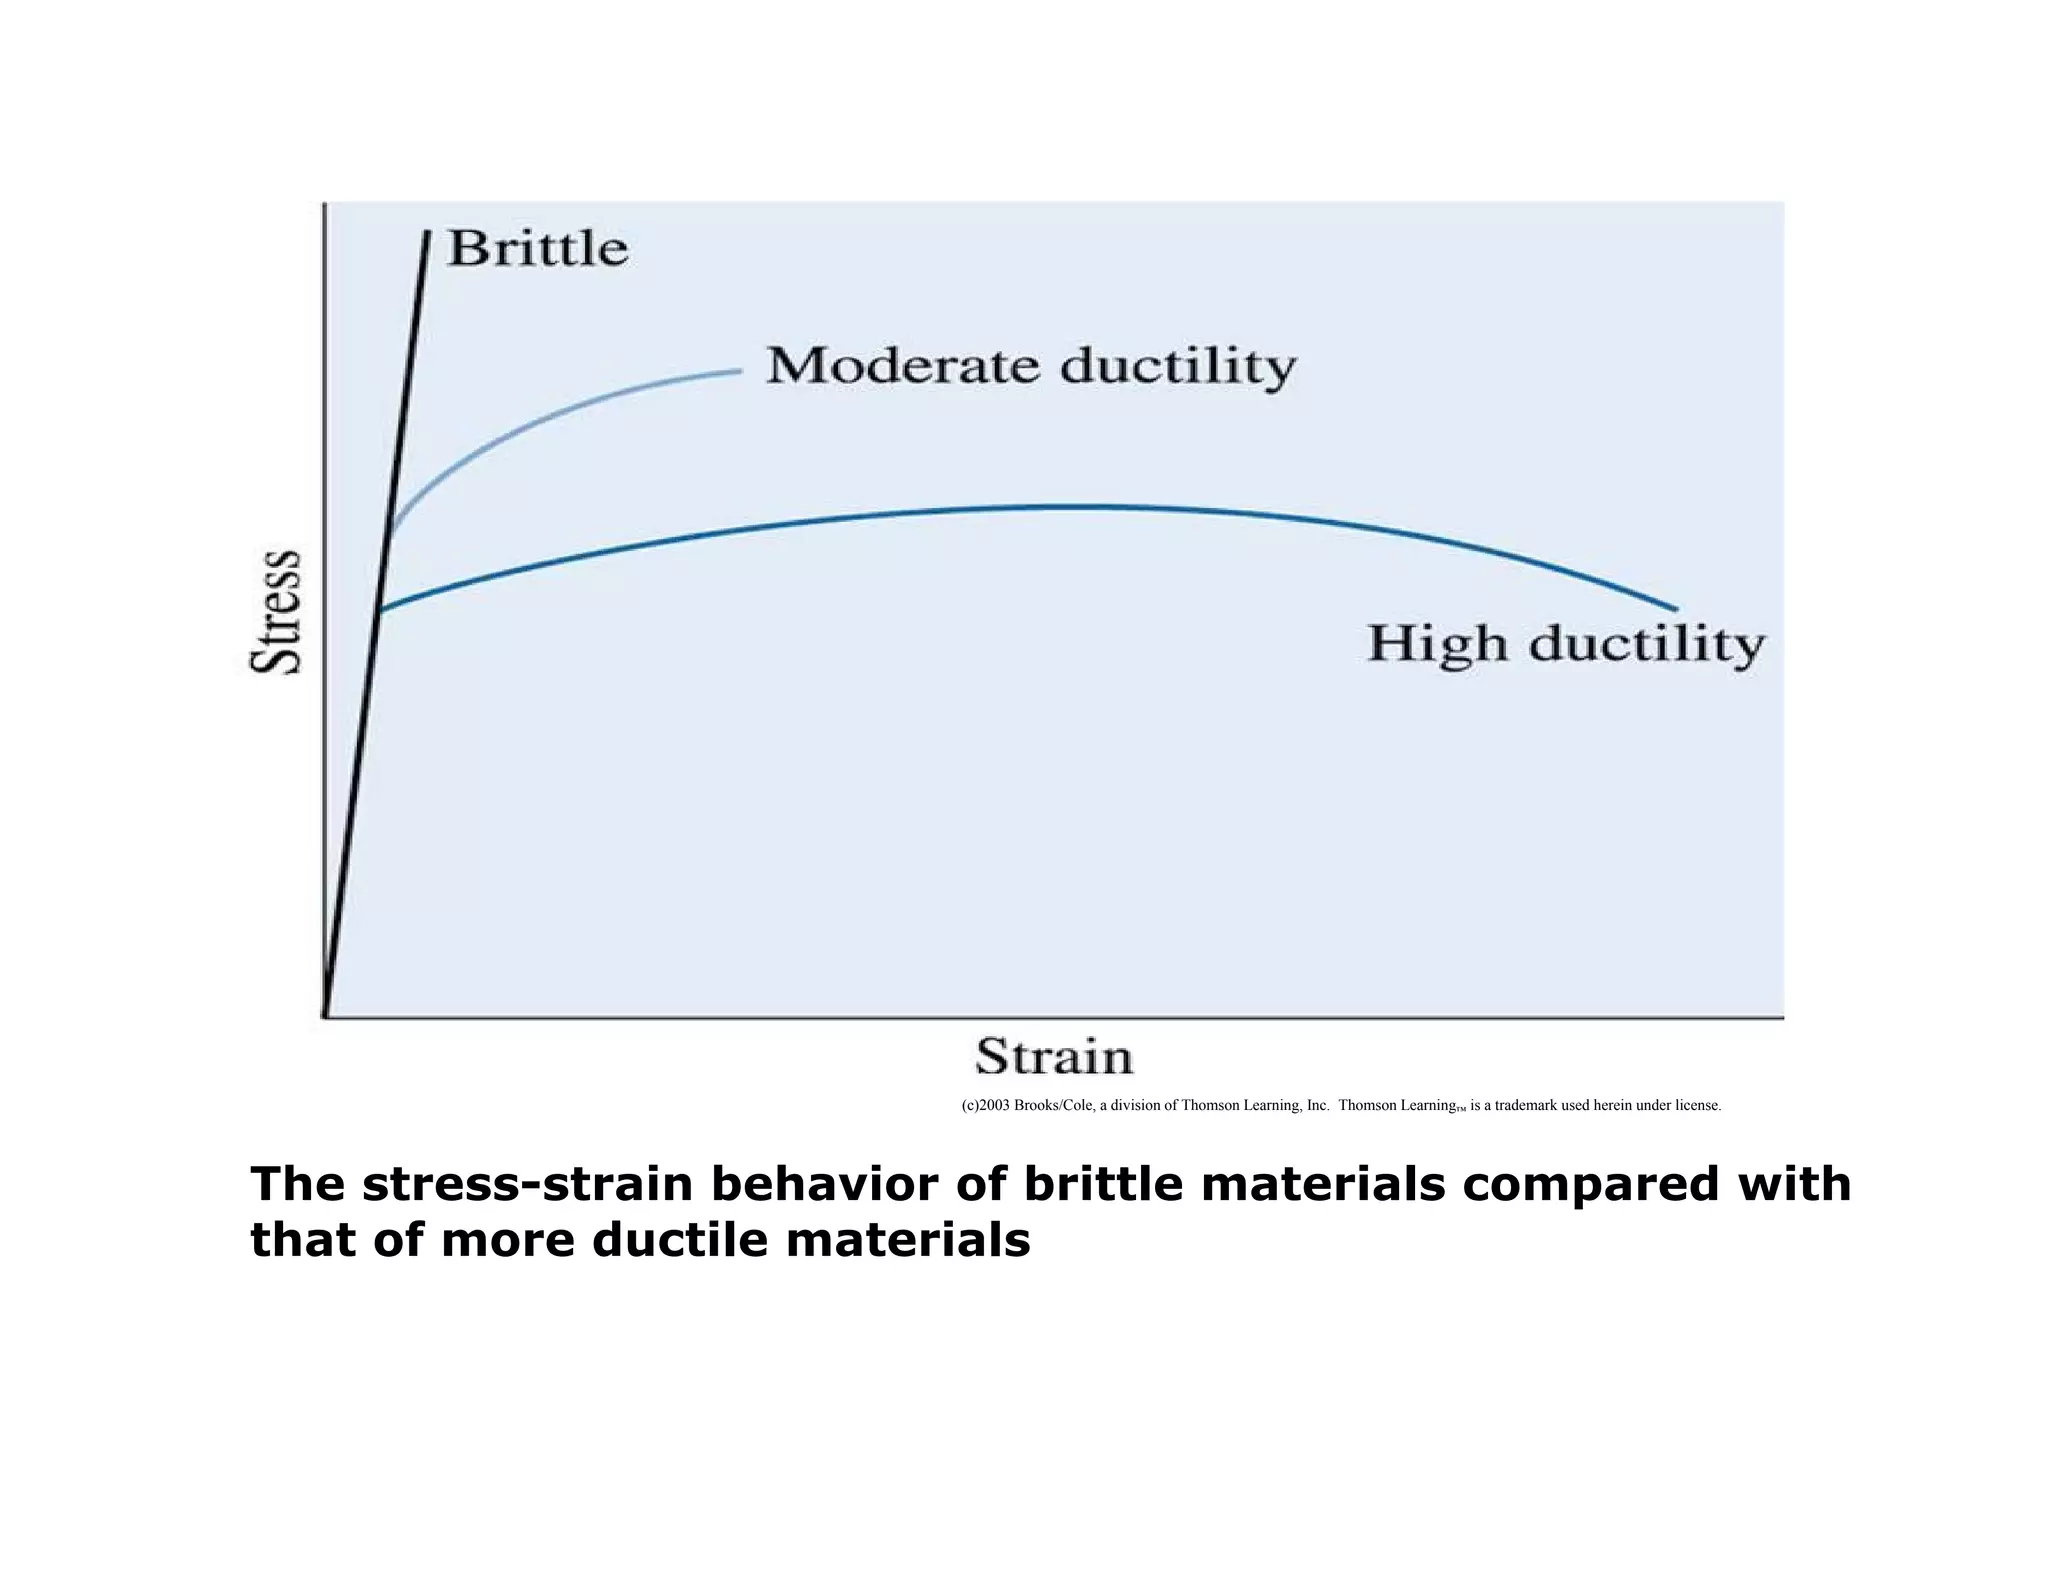
![136
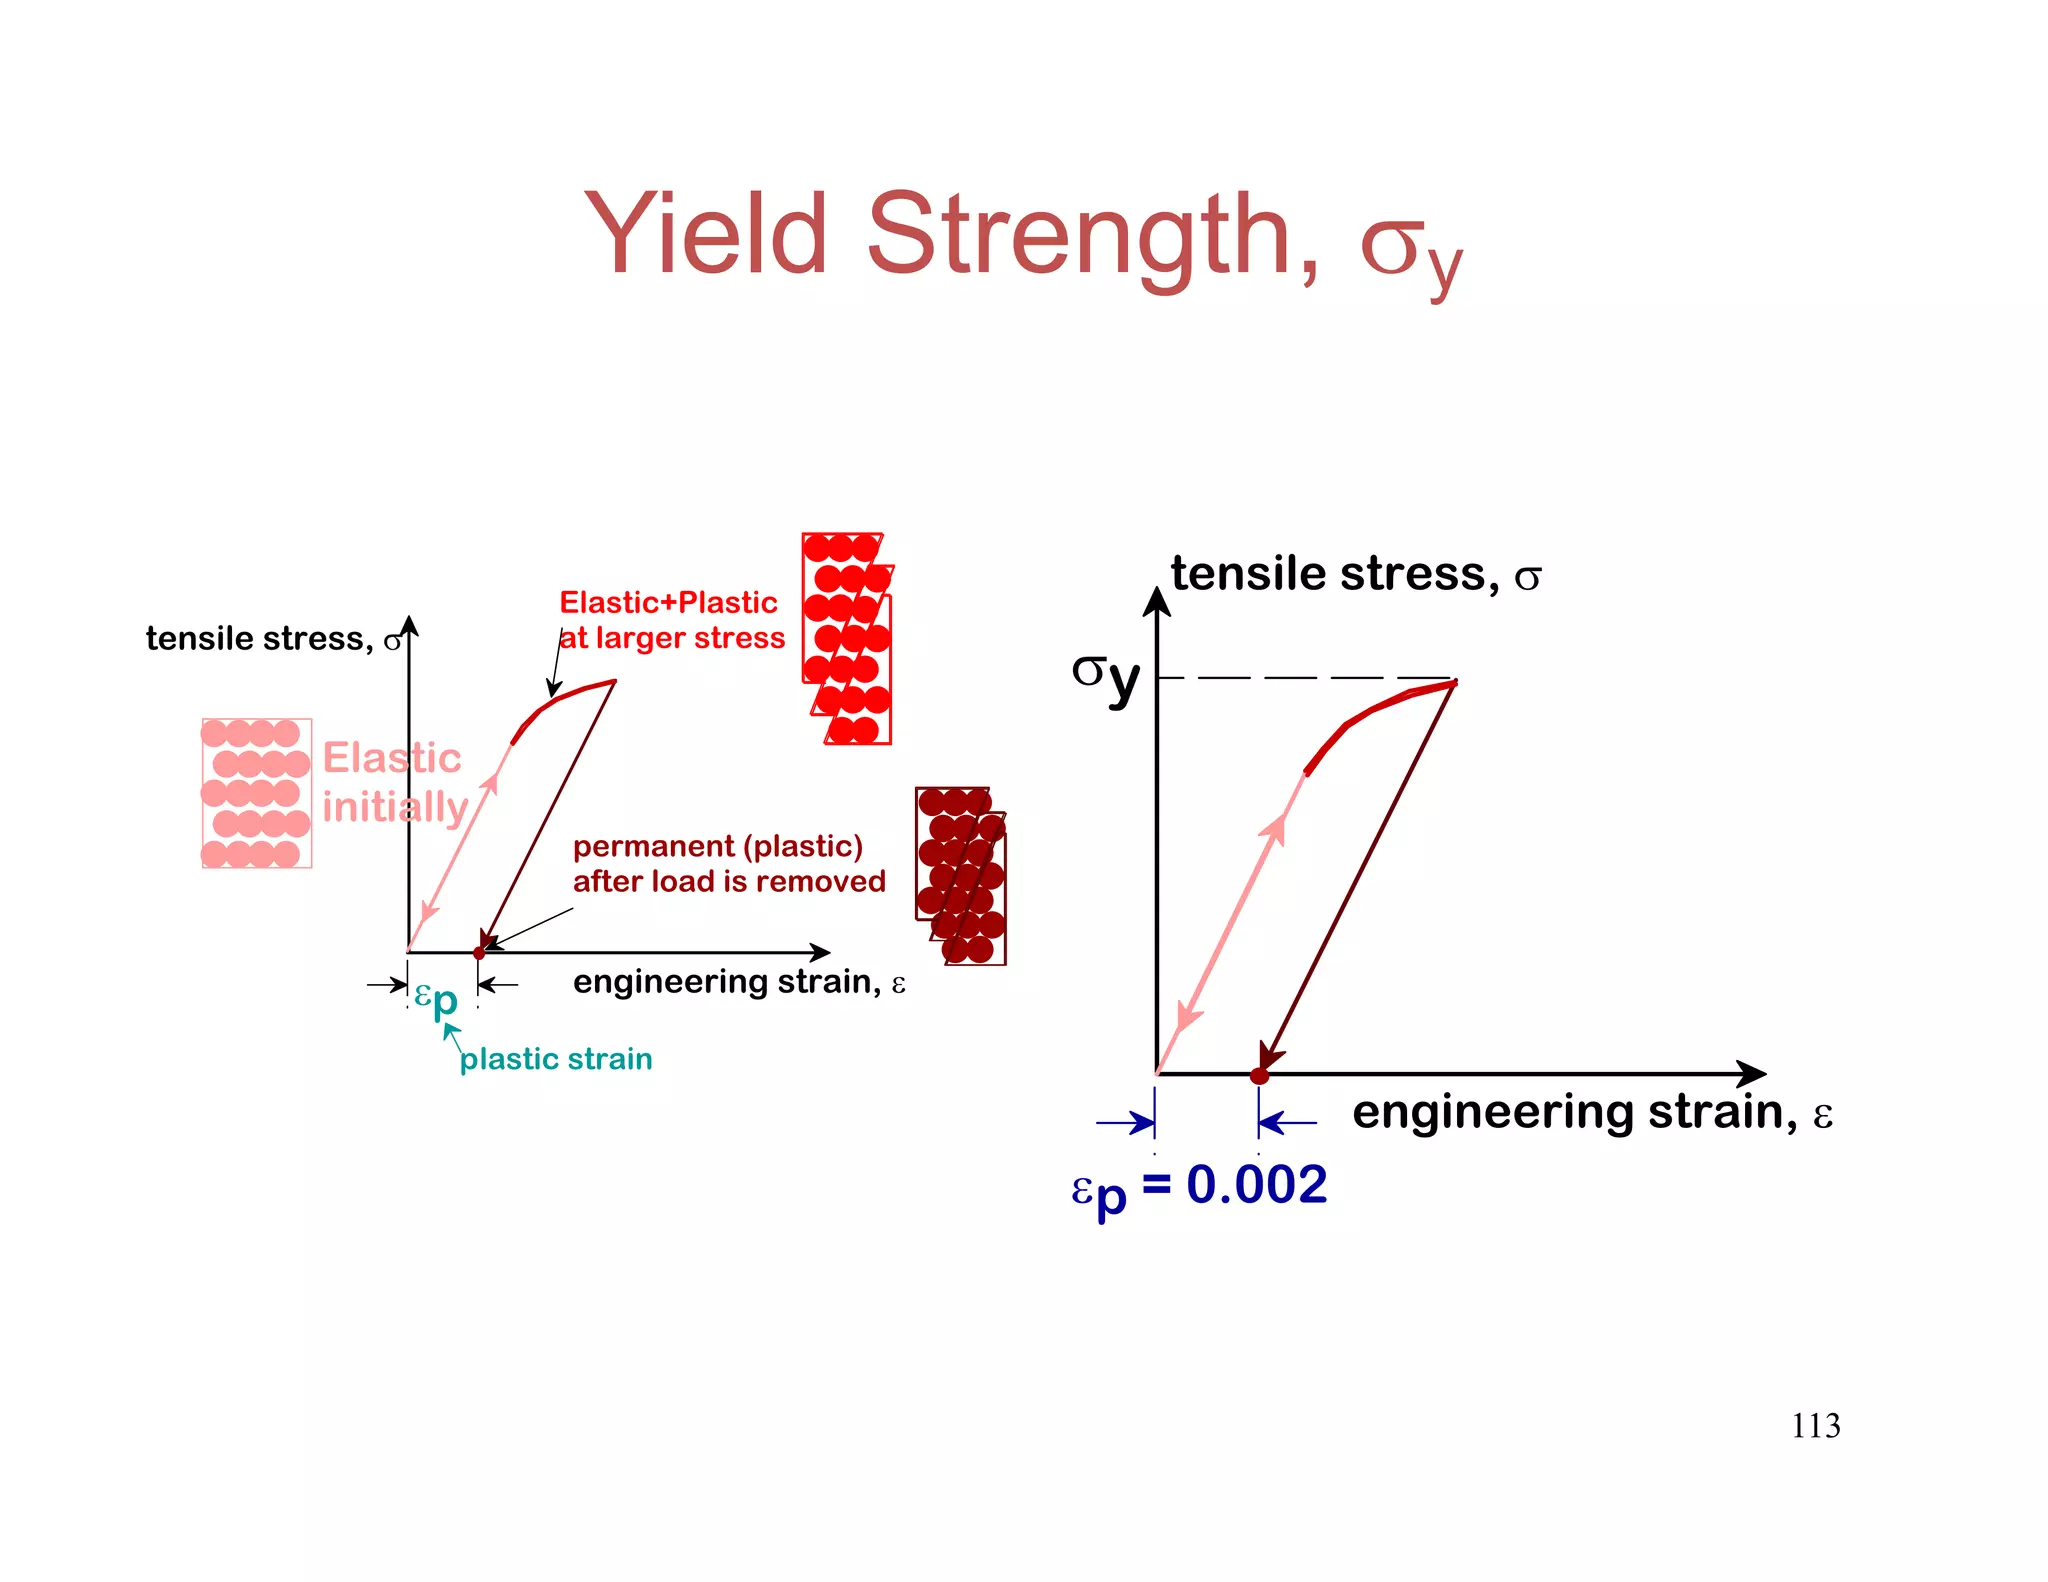
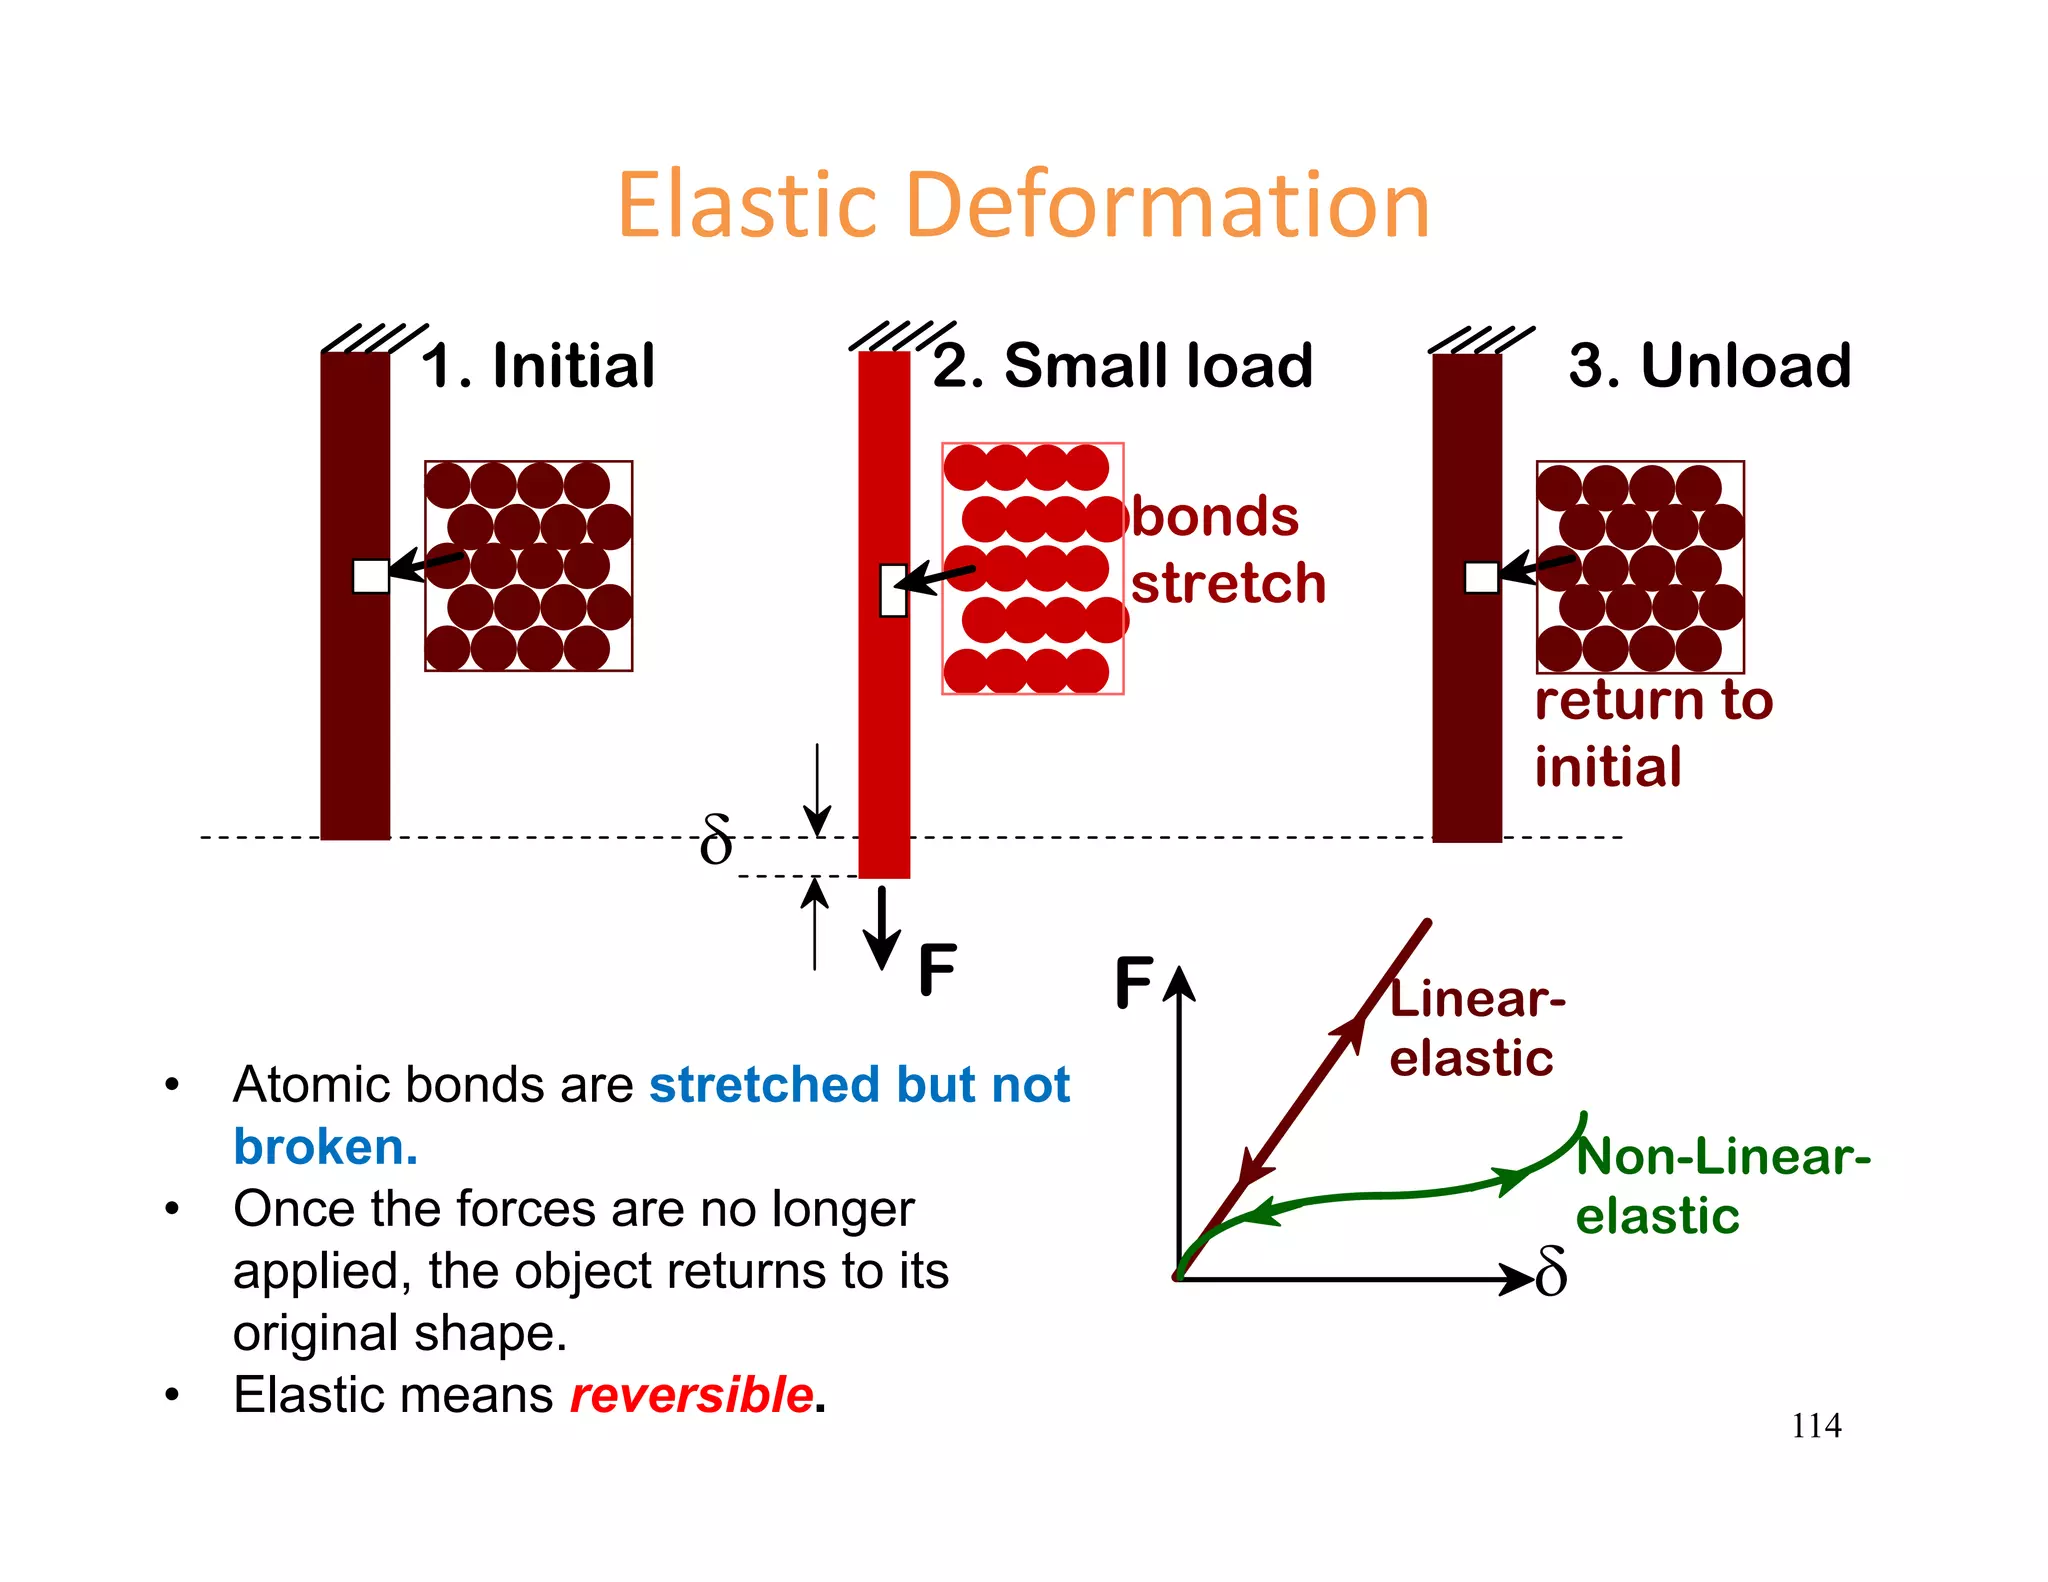
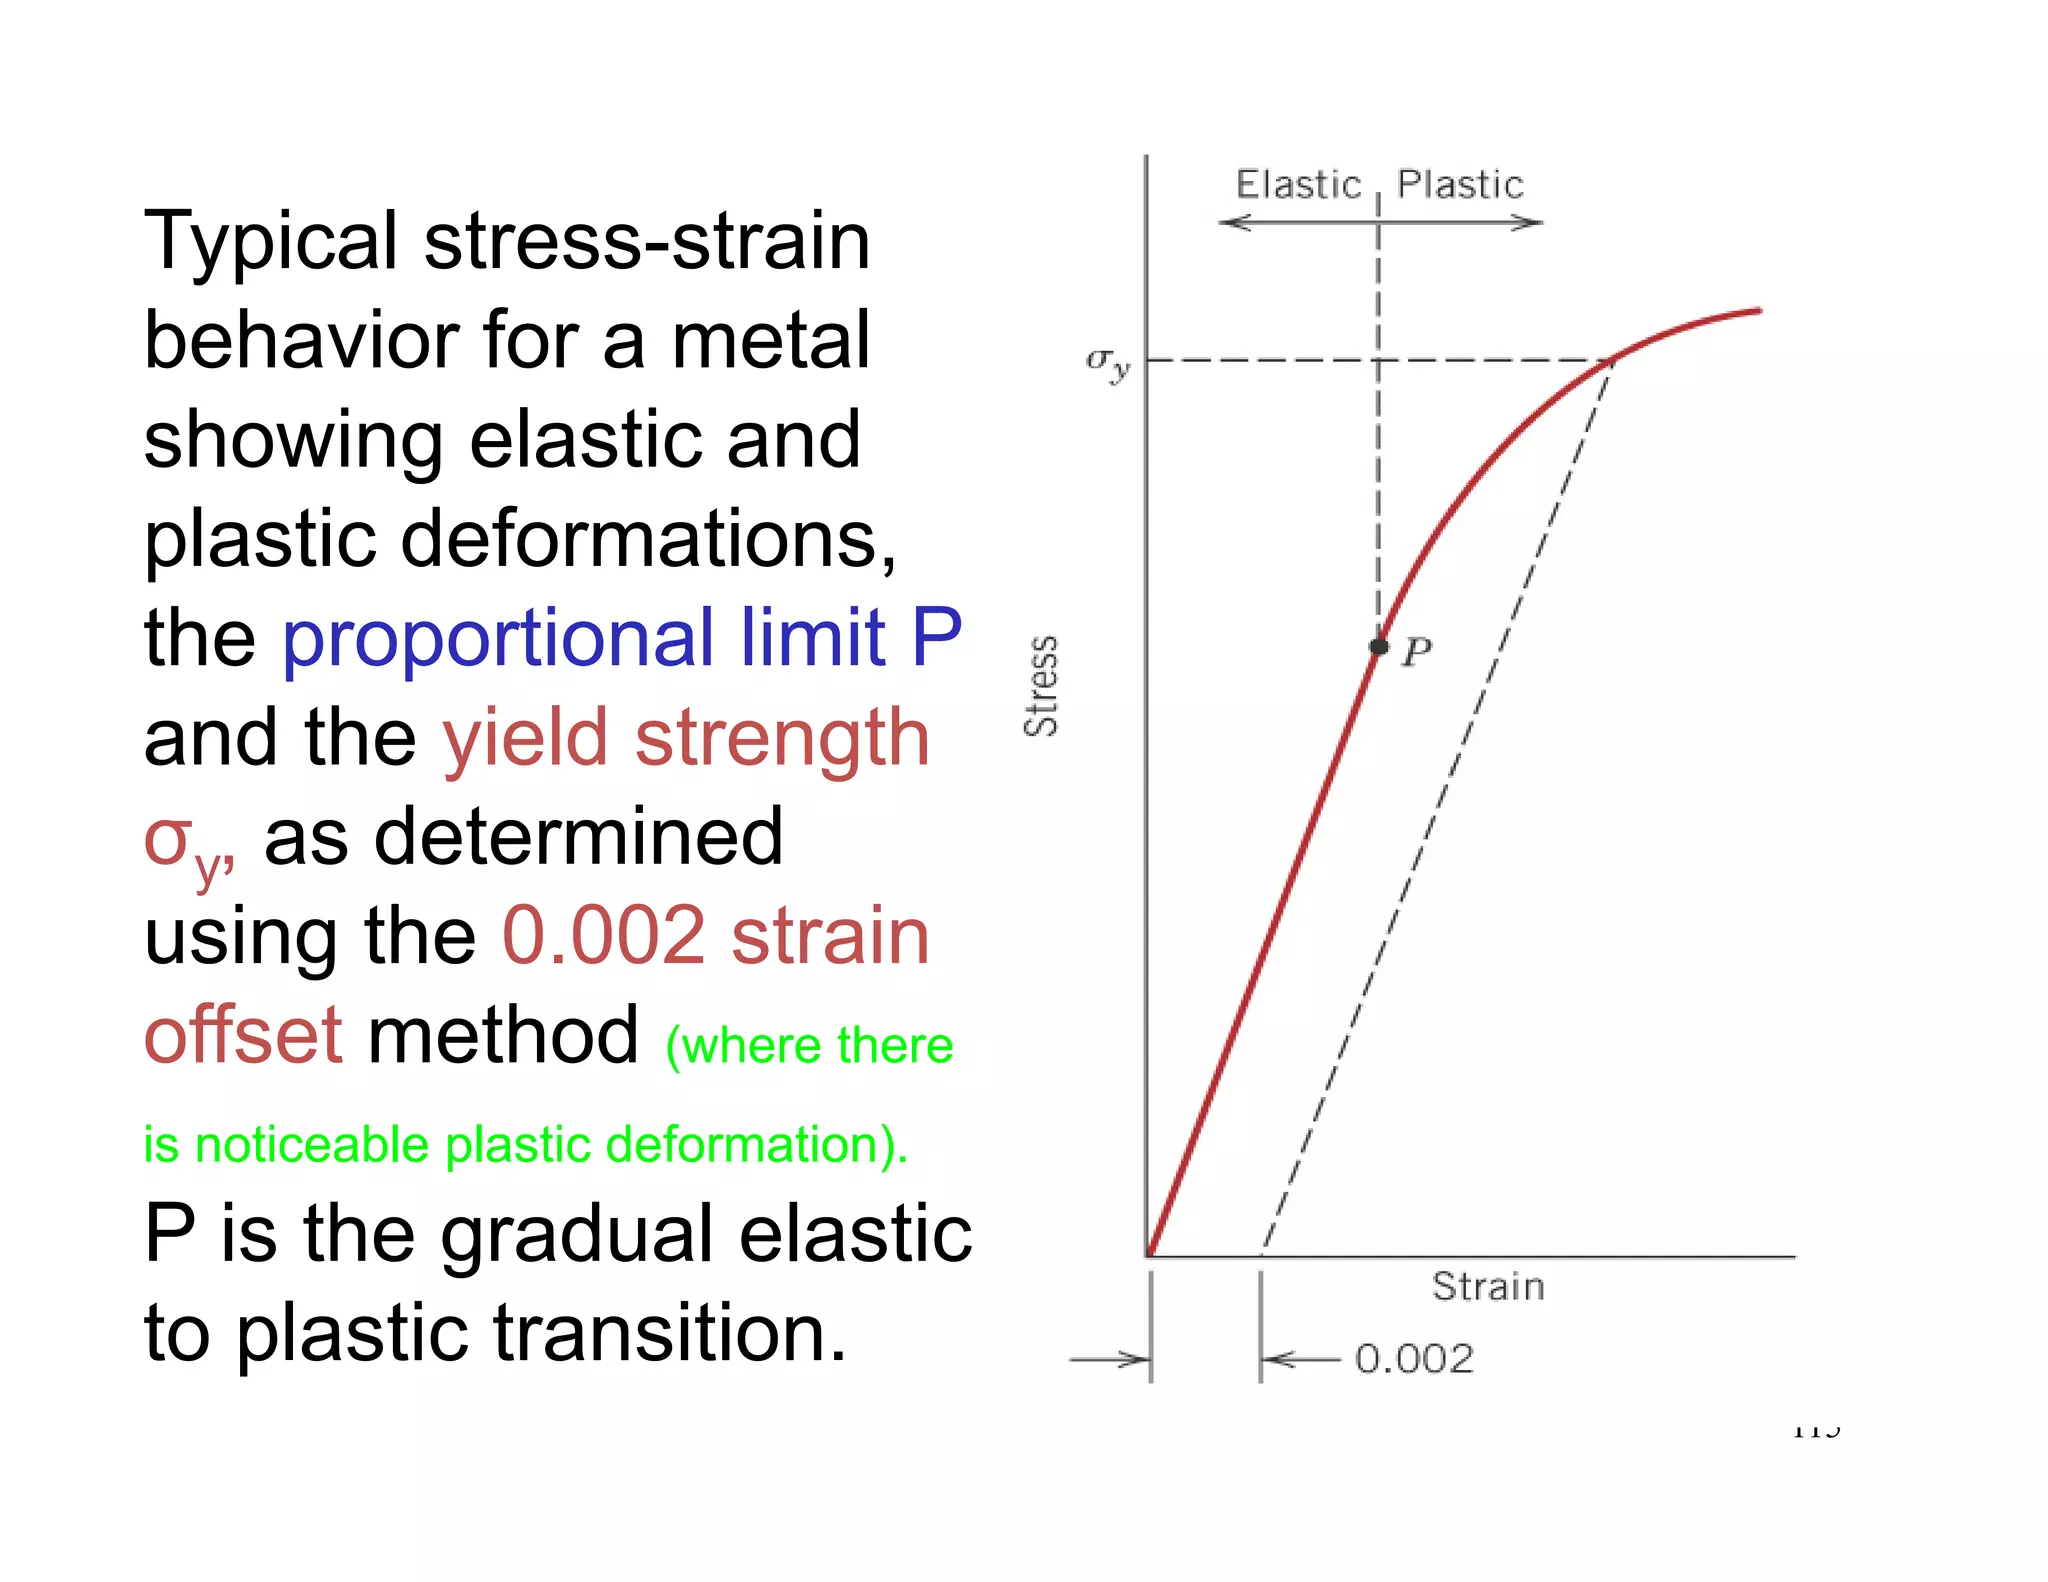
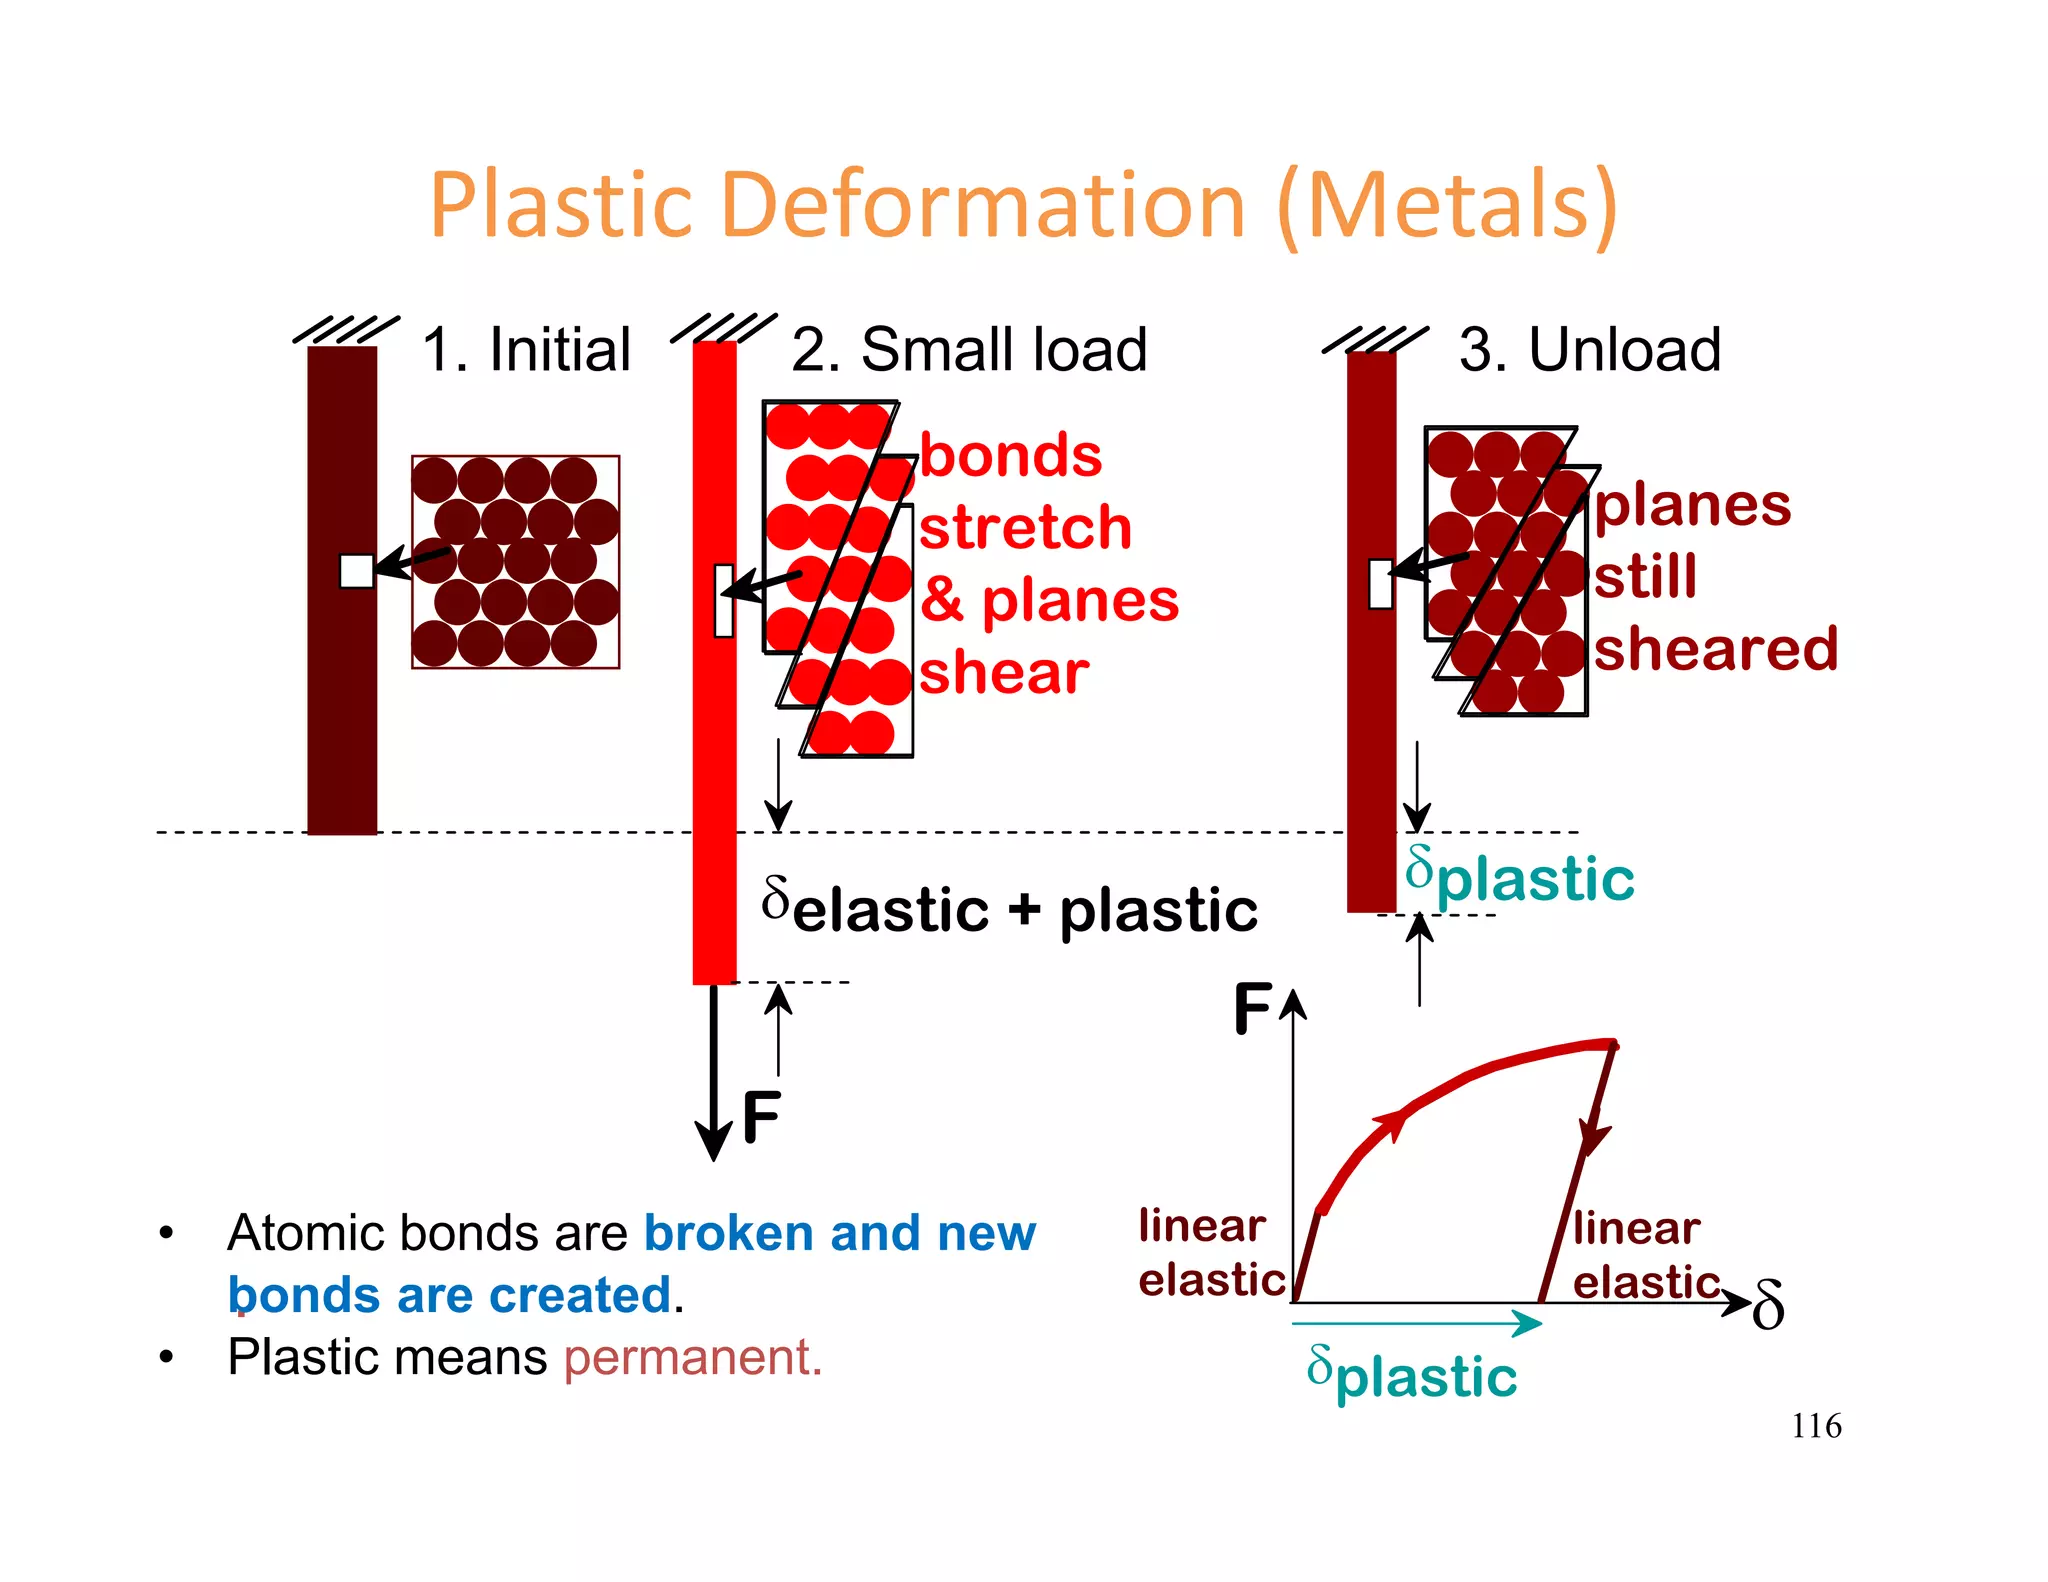
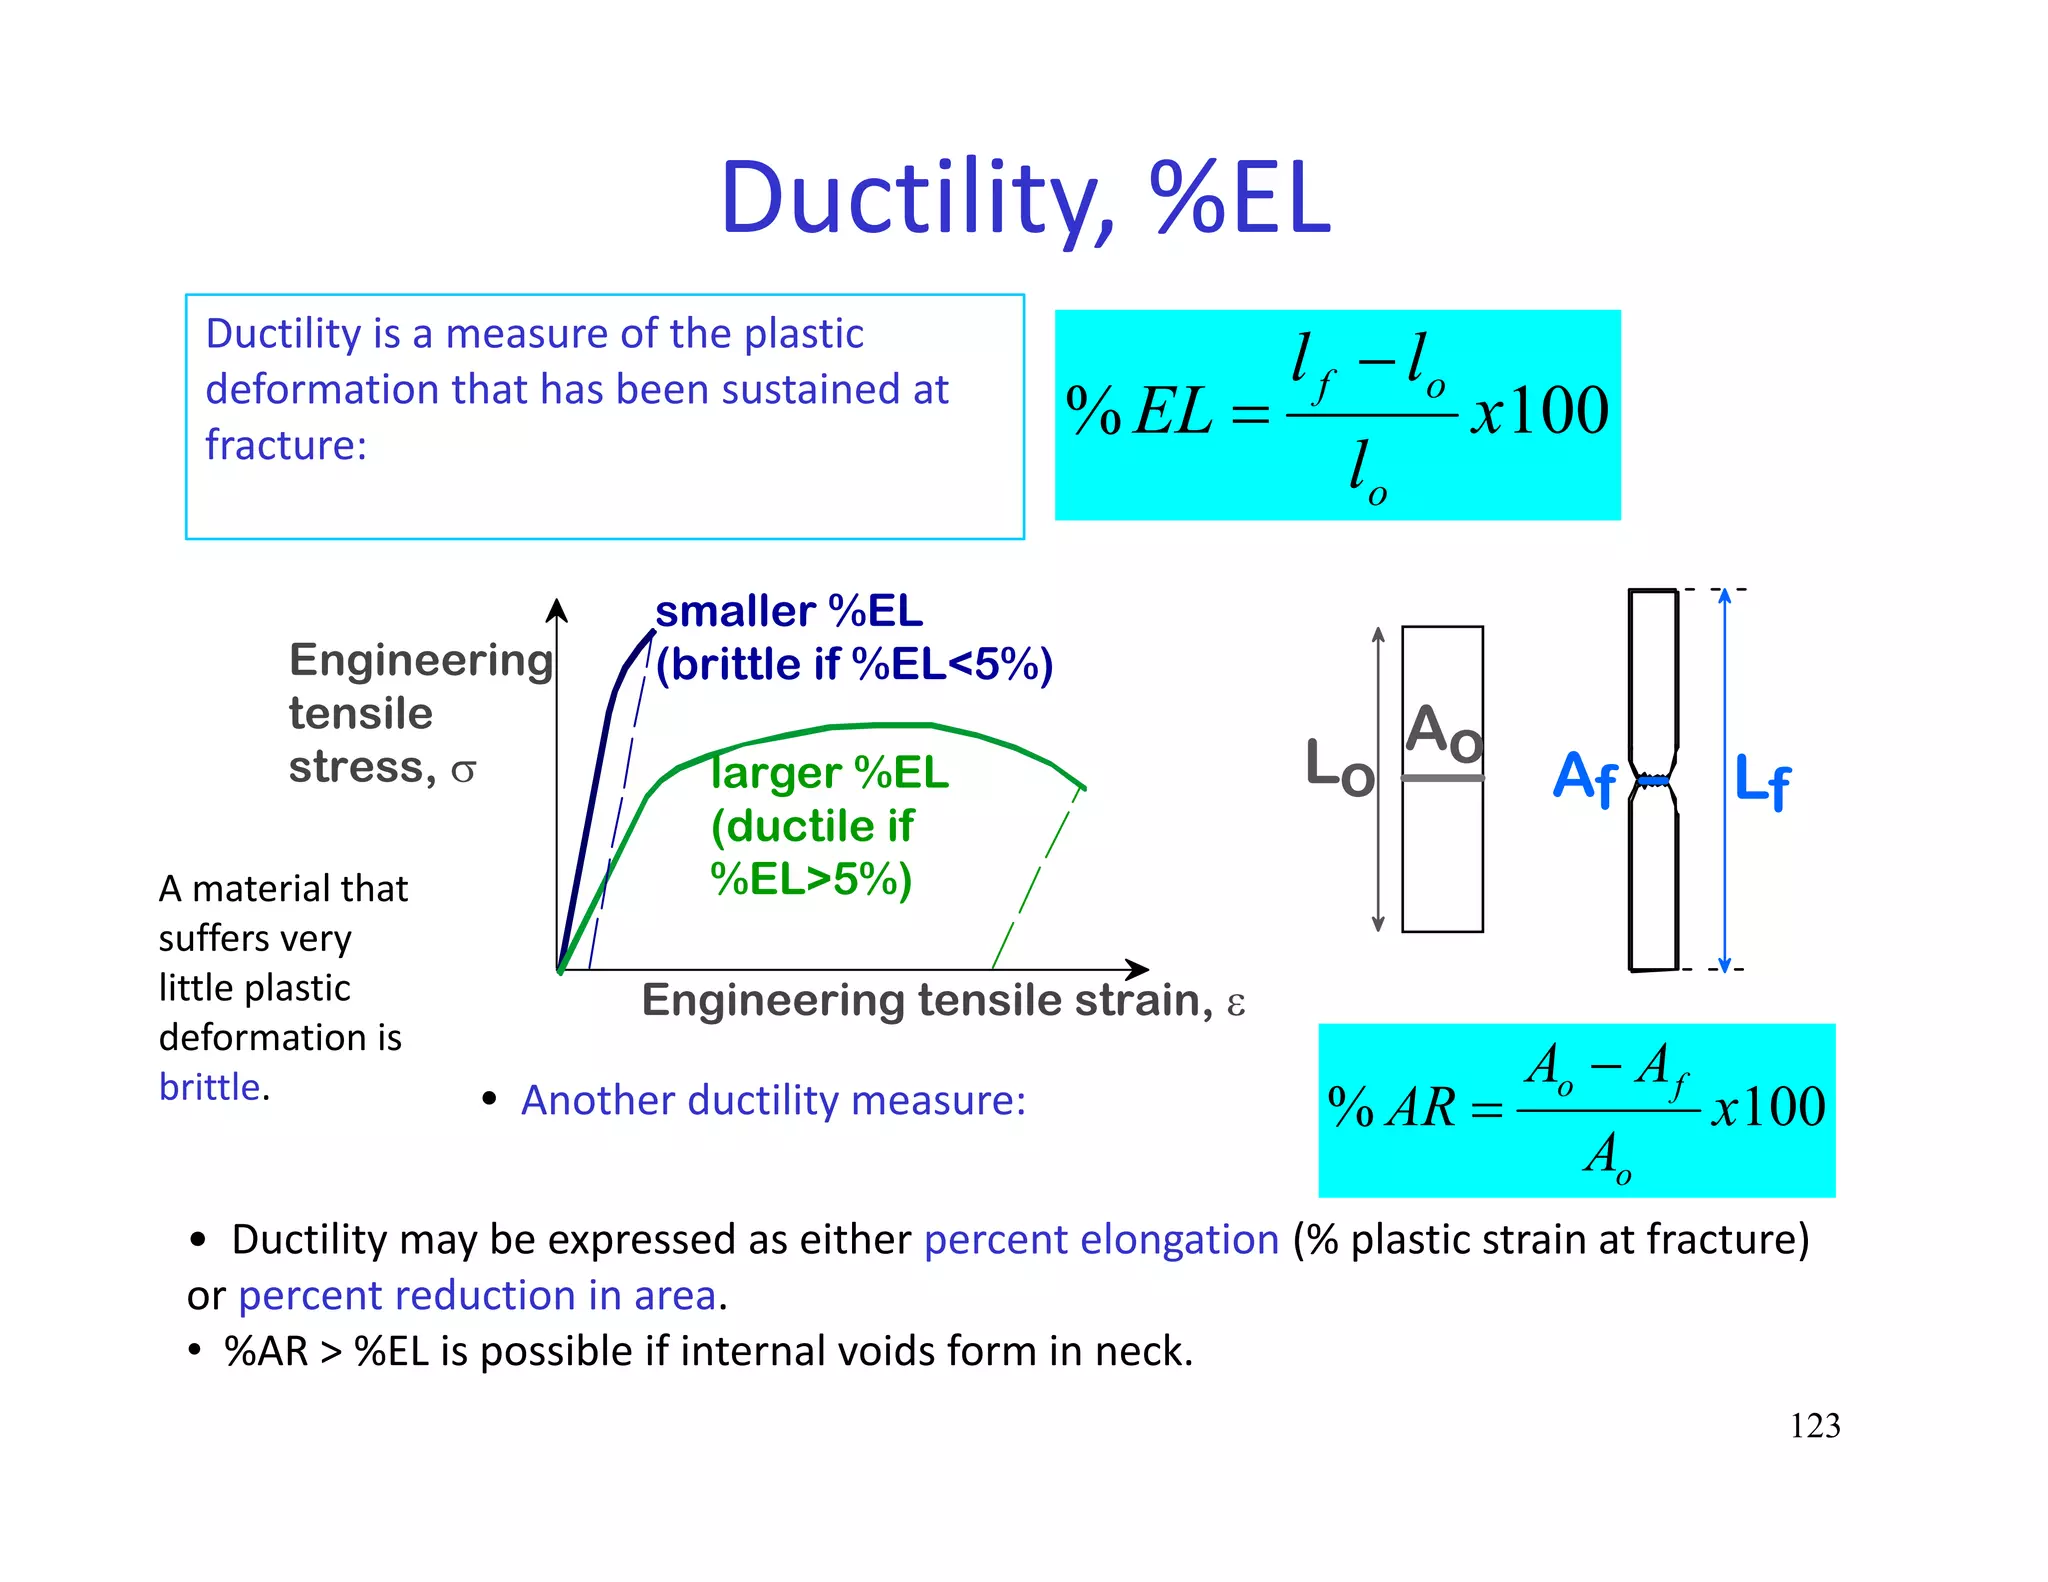
1c] Ductility is one of the important mechanical properties.
i] Define the ductility of a metal.
ii] With the aid of schematic diagrams, describe elastic and plastic deformations.
[6 marks]
QUESTION : FINAL EXAM [April 2011]](https://image.slidesharecdn.com/9cztb0vaqk6kf4x1vwe8-signature-d98e614c44bb5d5fcfc79eb5ed8fdbf00bc1e22d961d7a0f5fed49408756051c-poli-140724113841-phpapp02/75/Mec281-lecture-144-2048.jpg)
![148
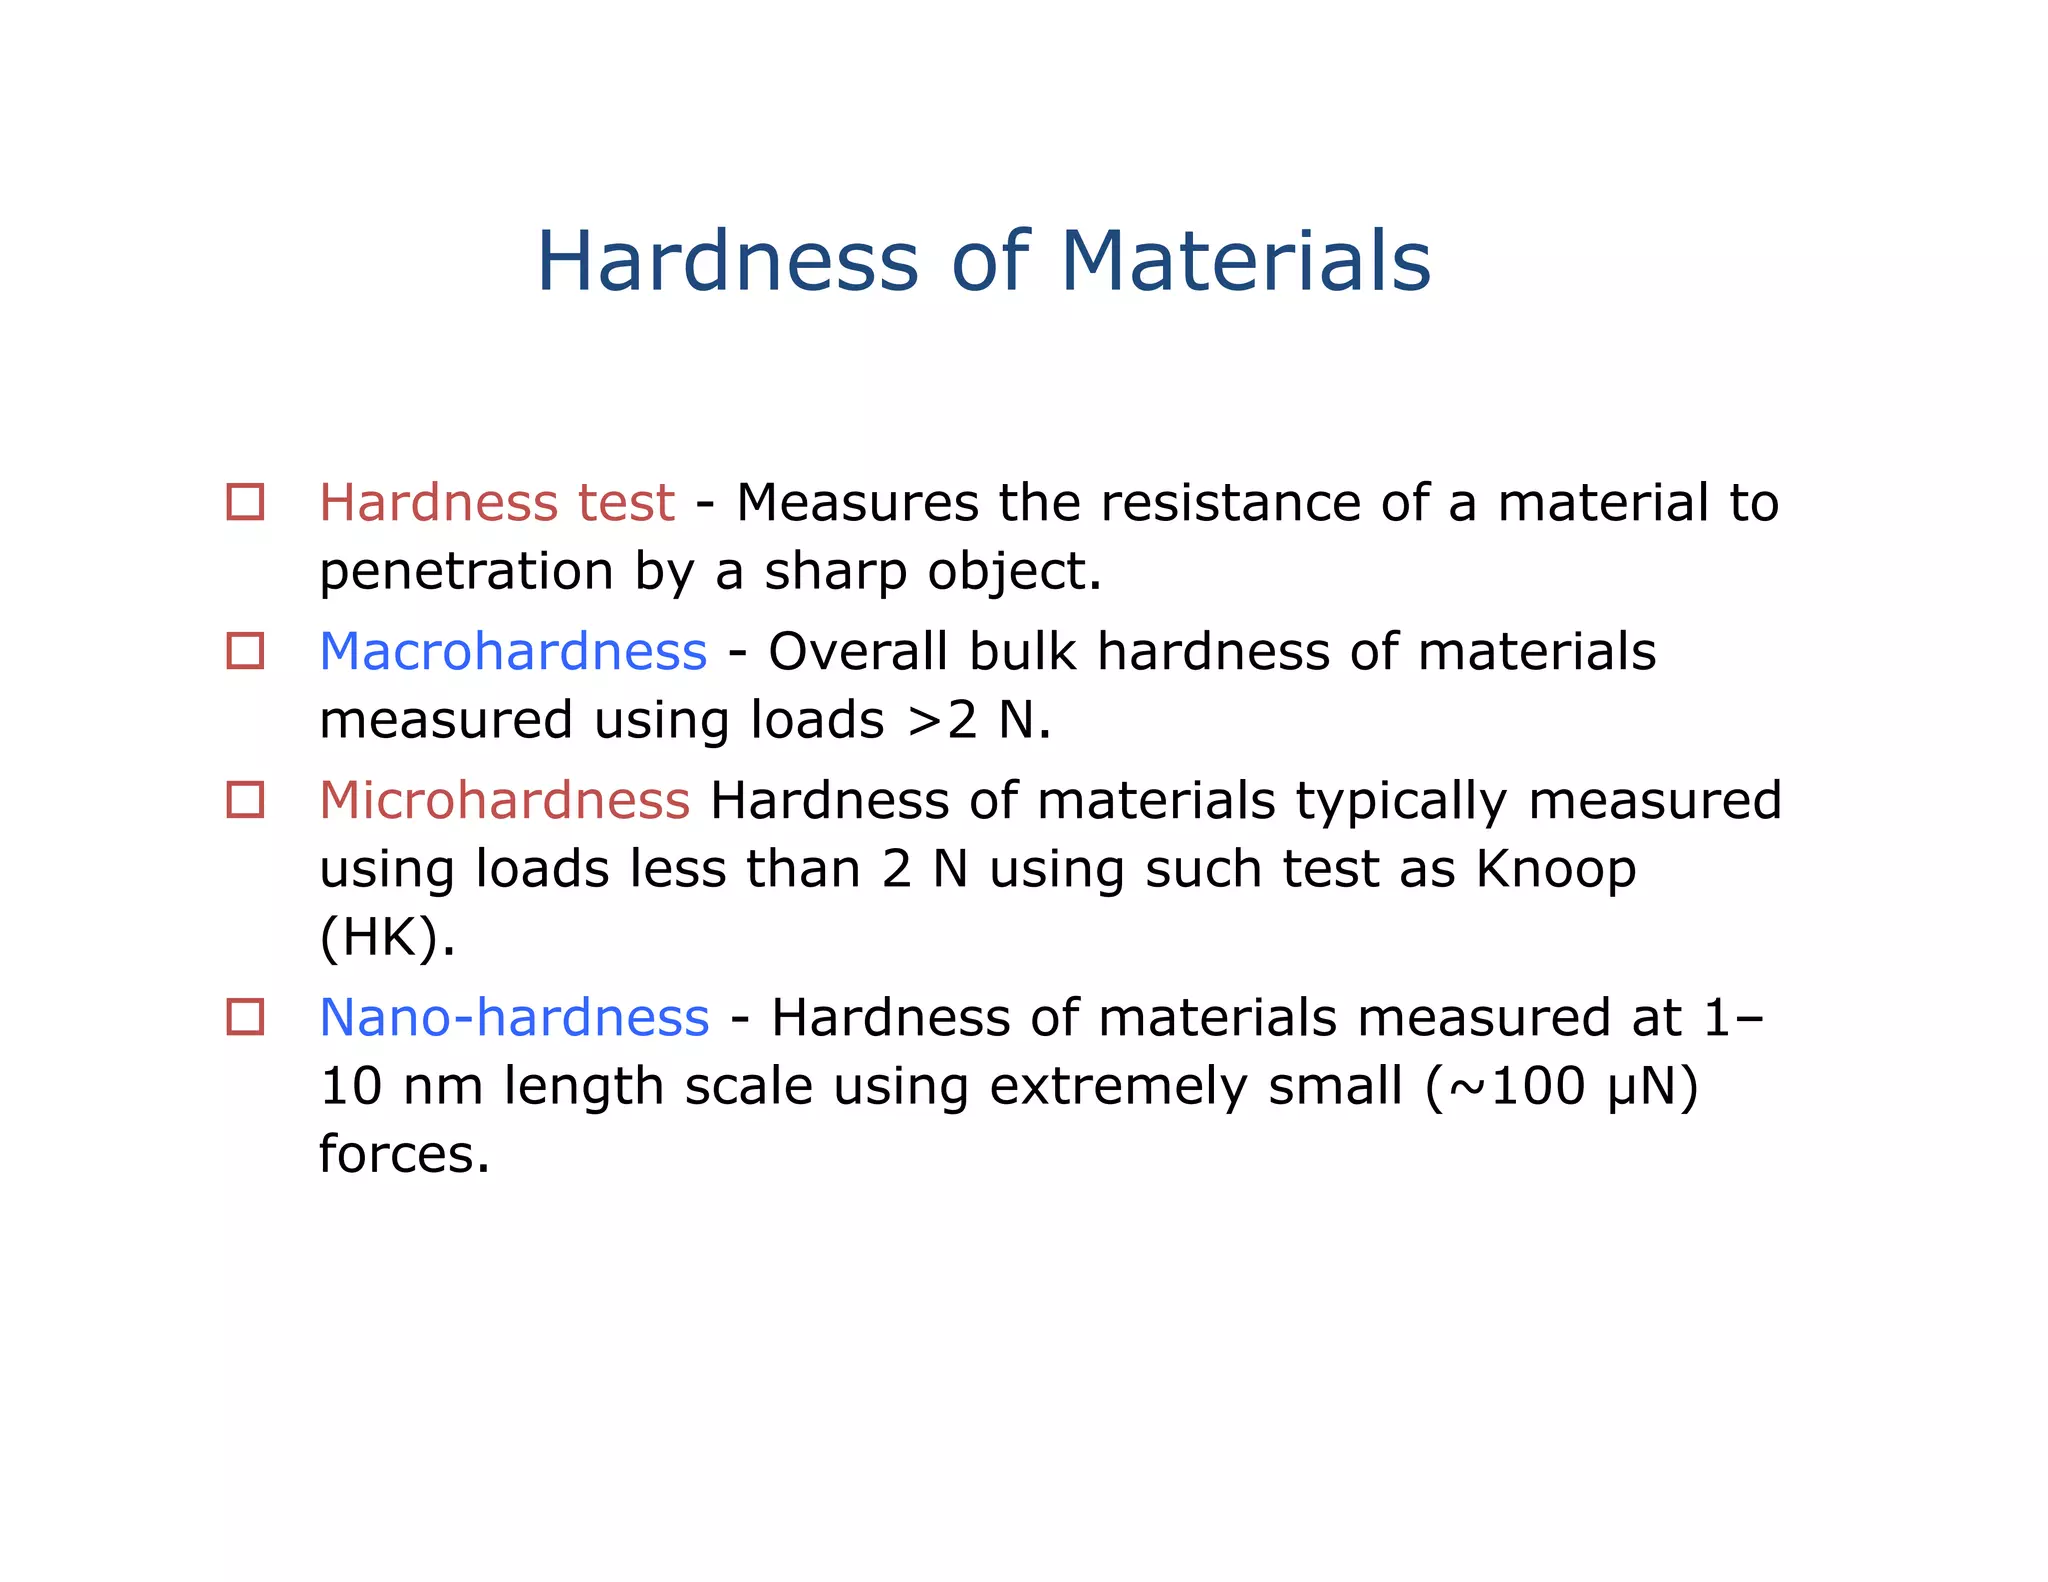
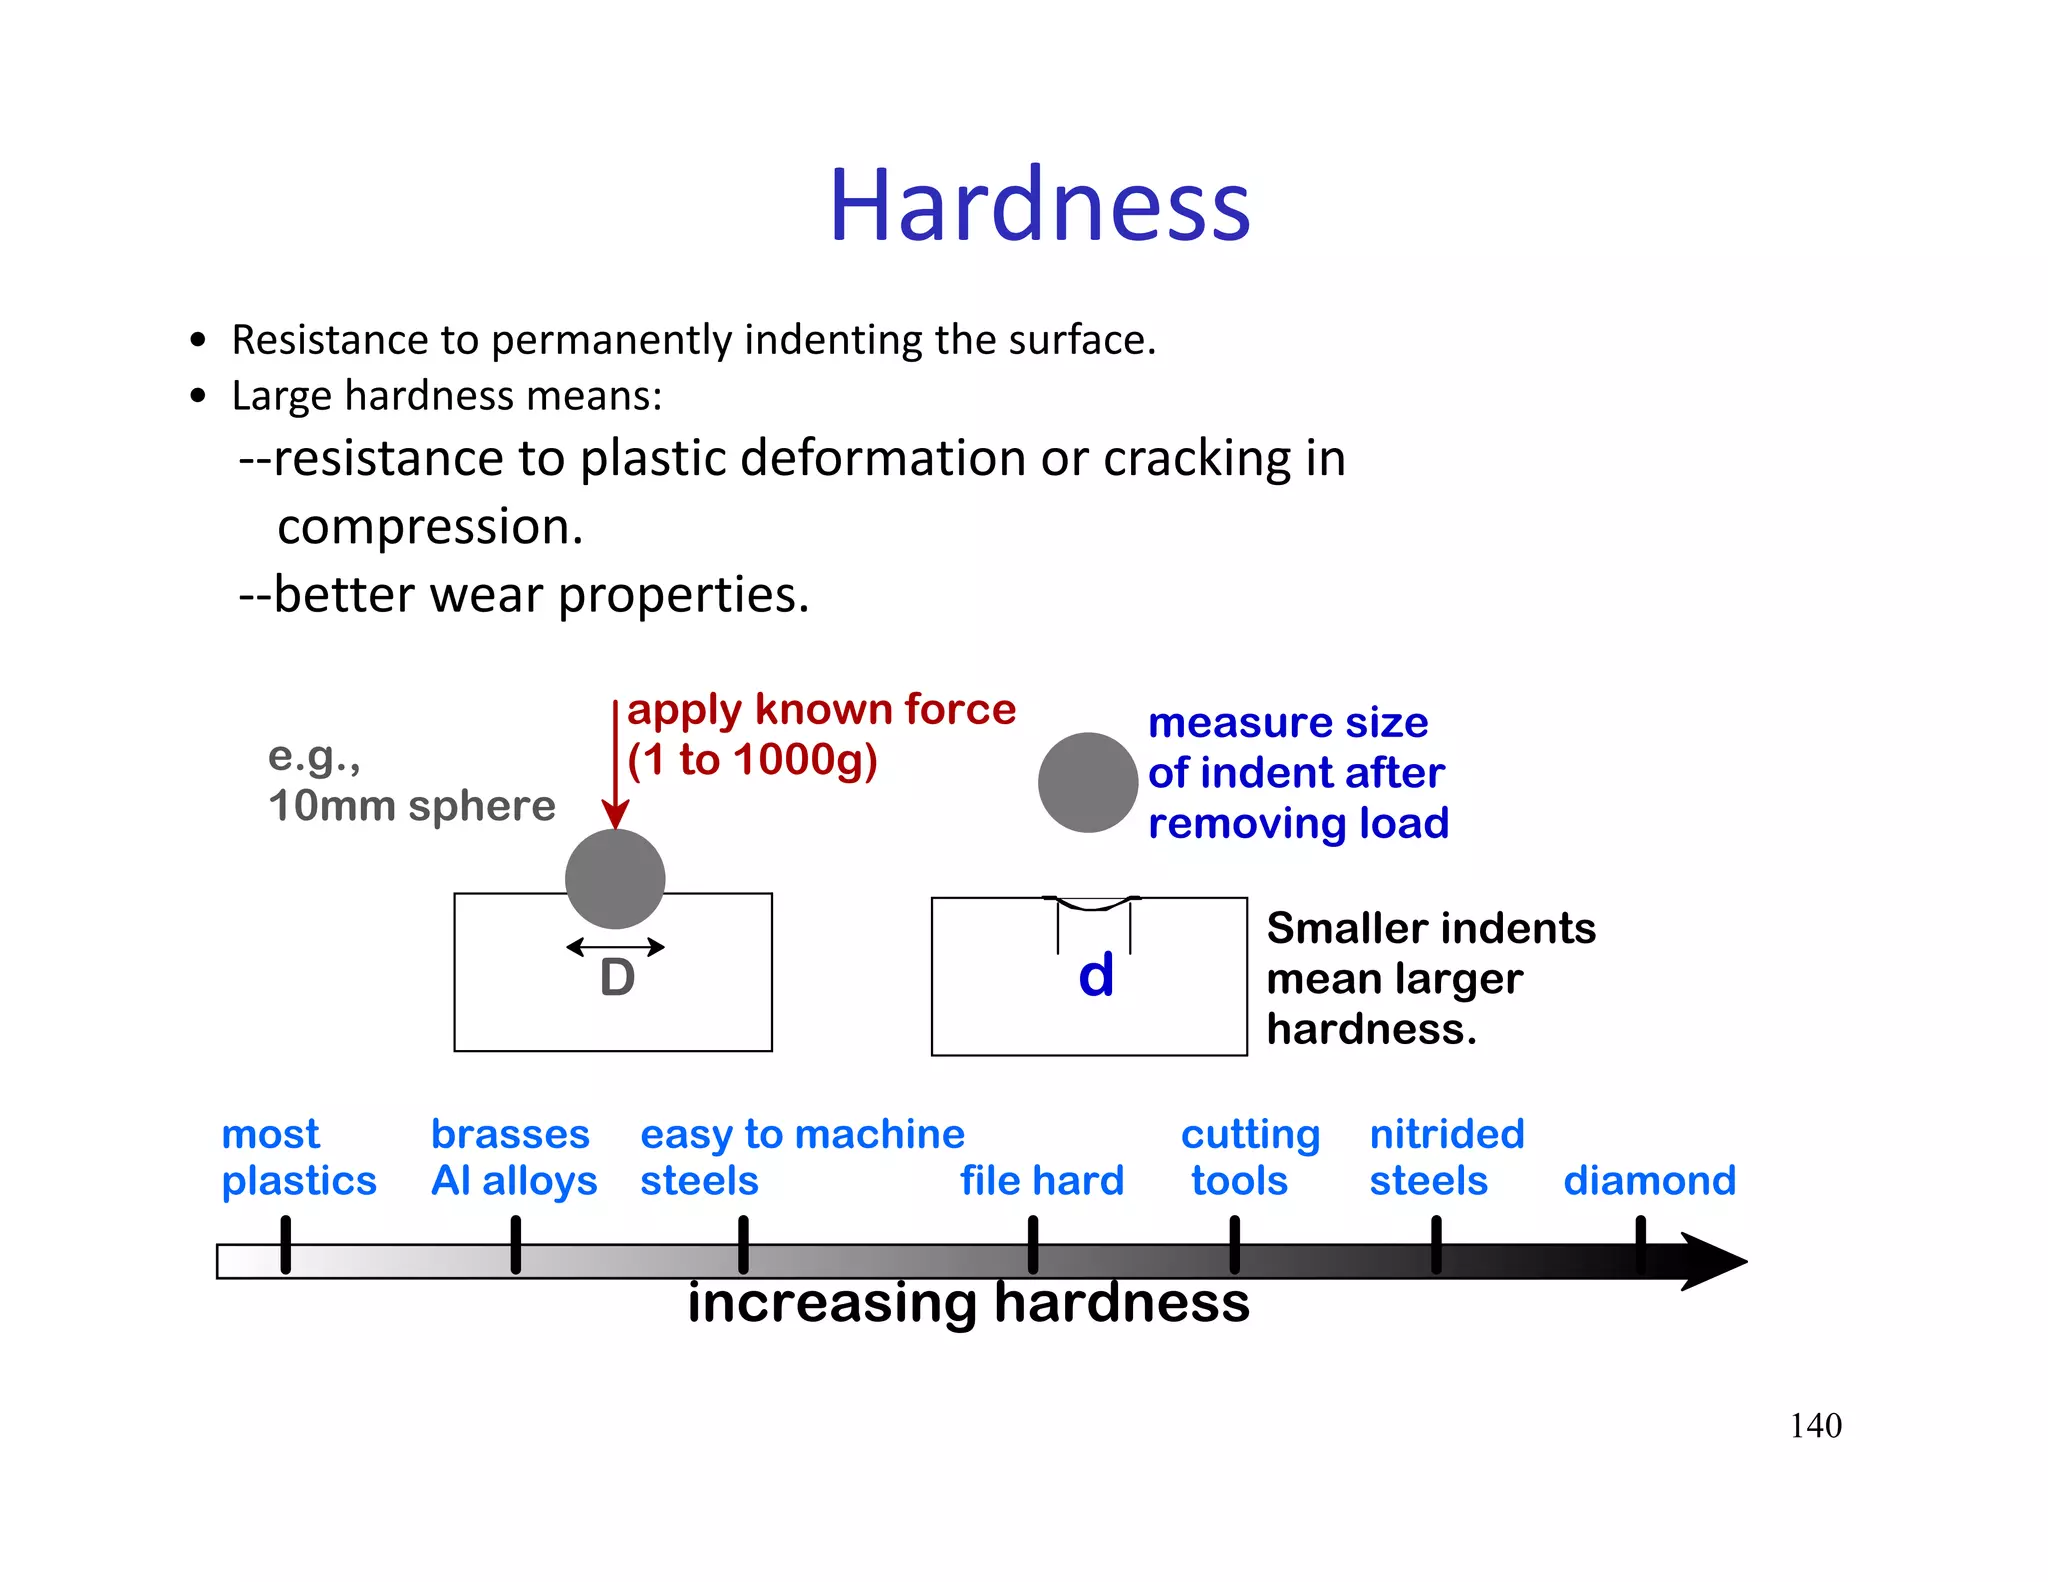
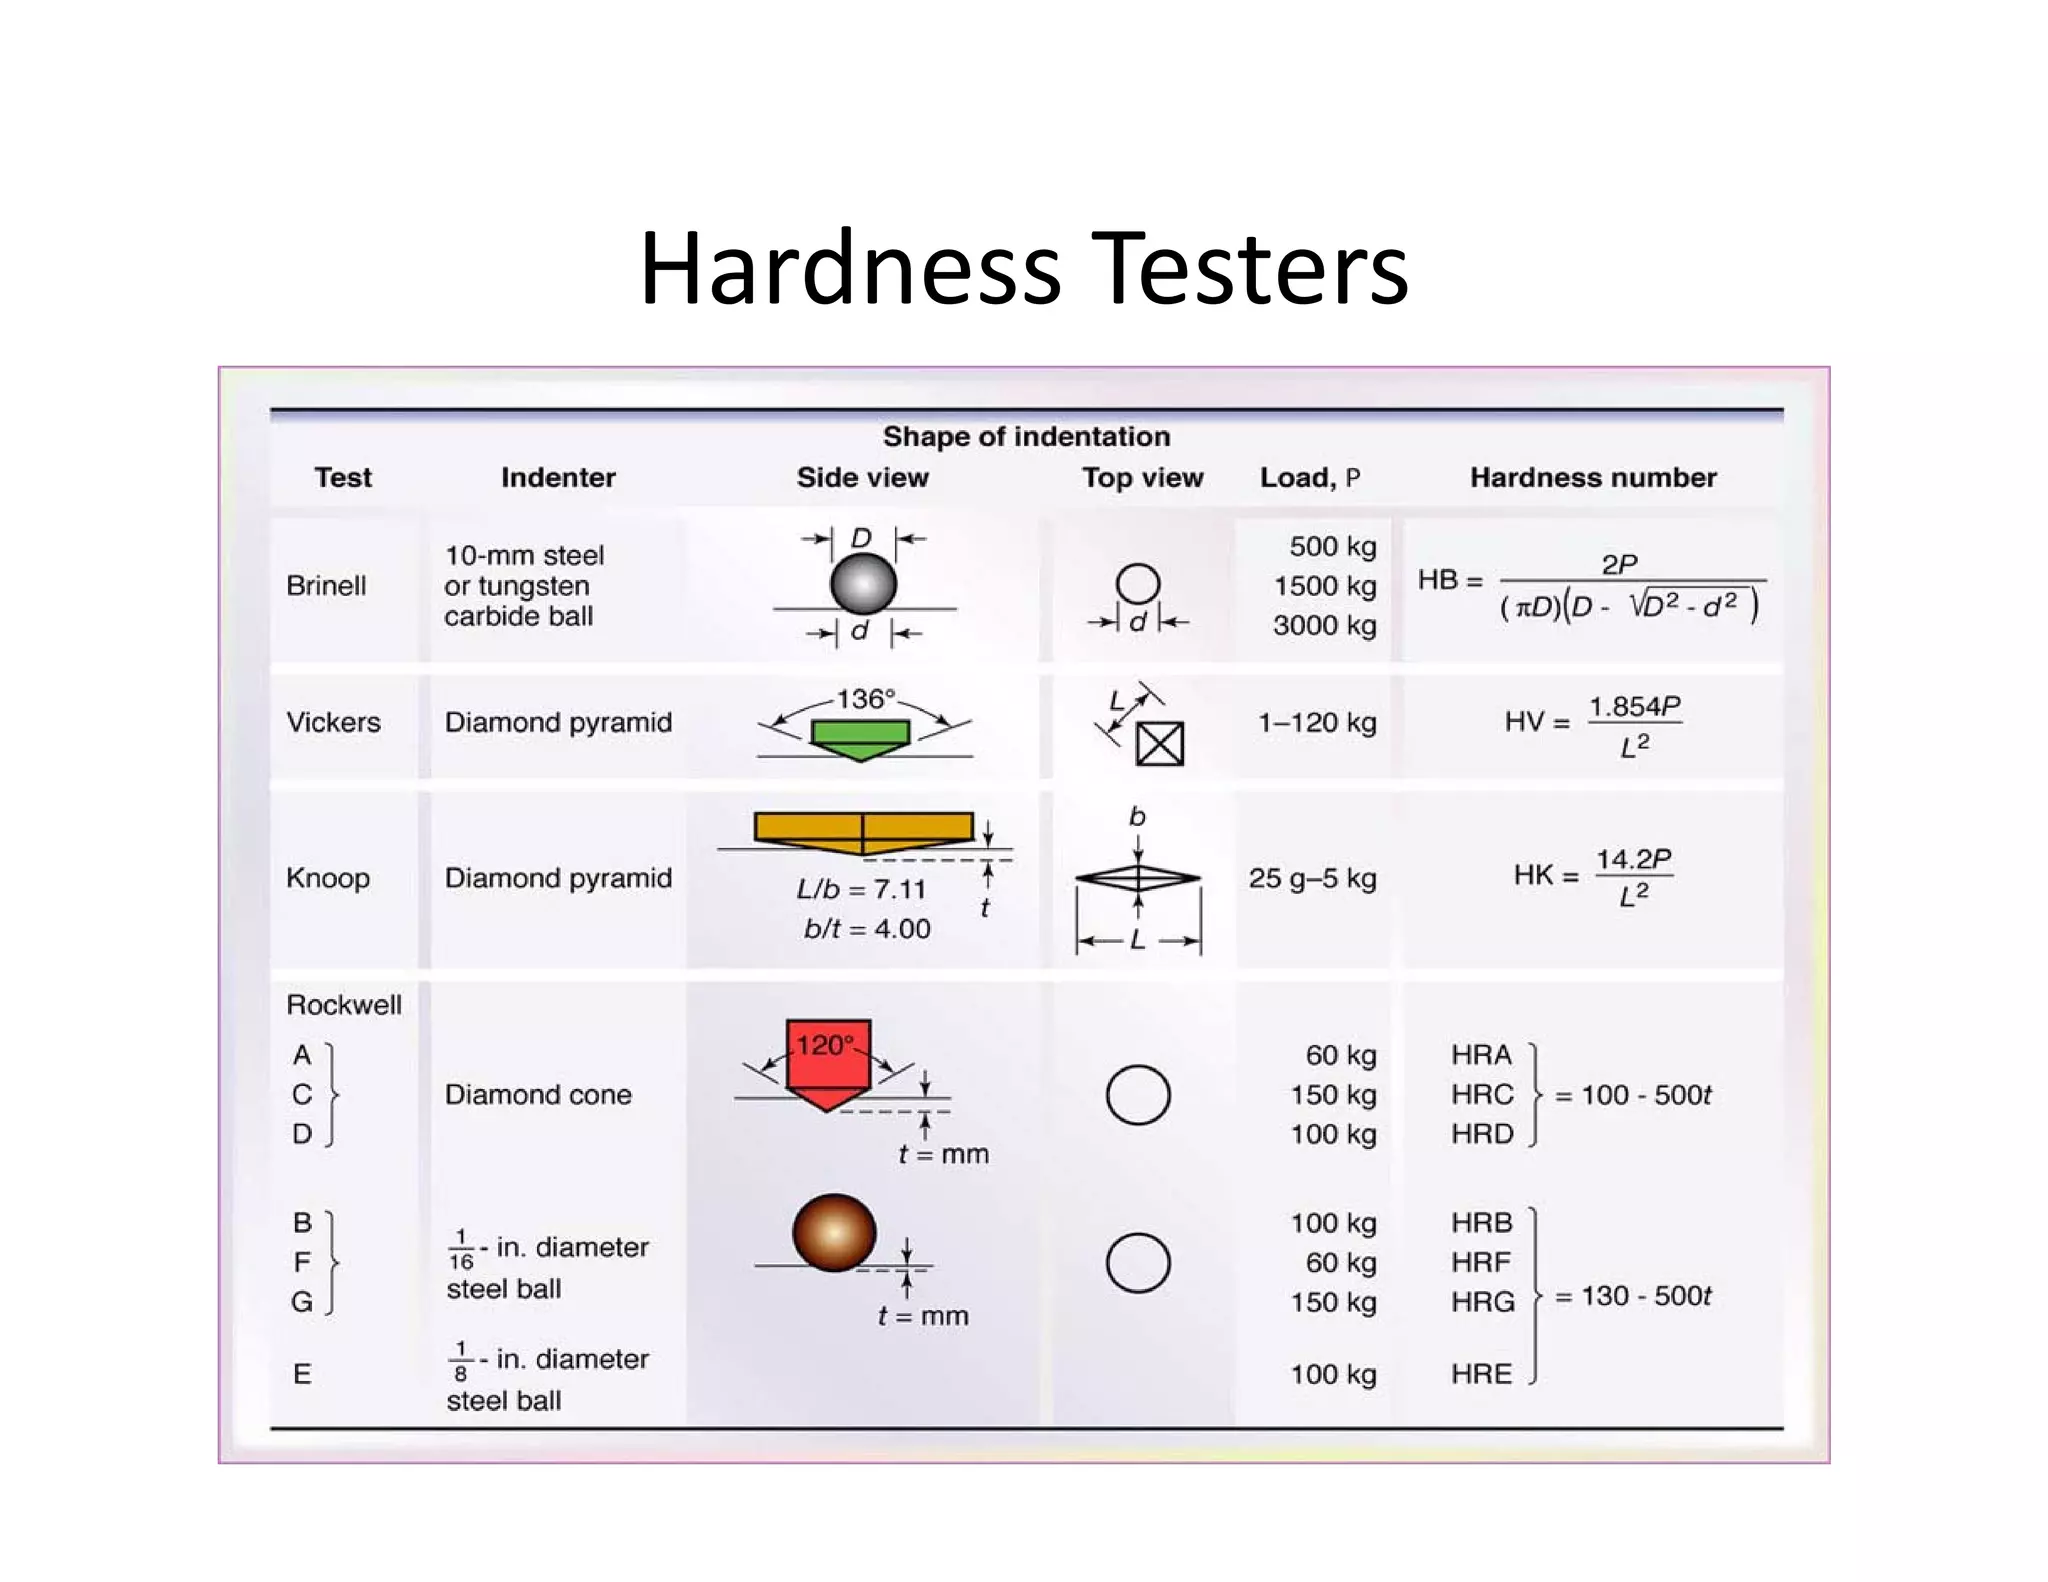
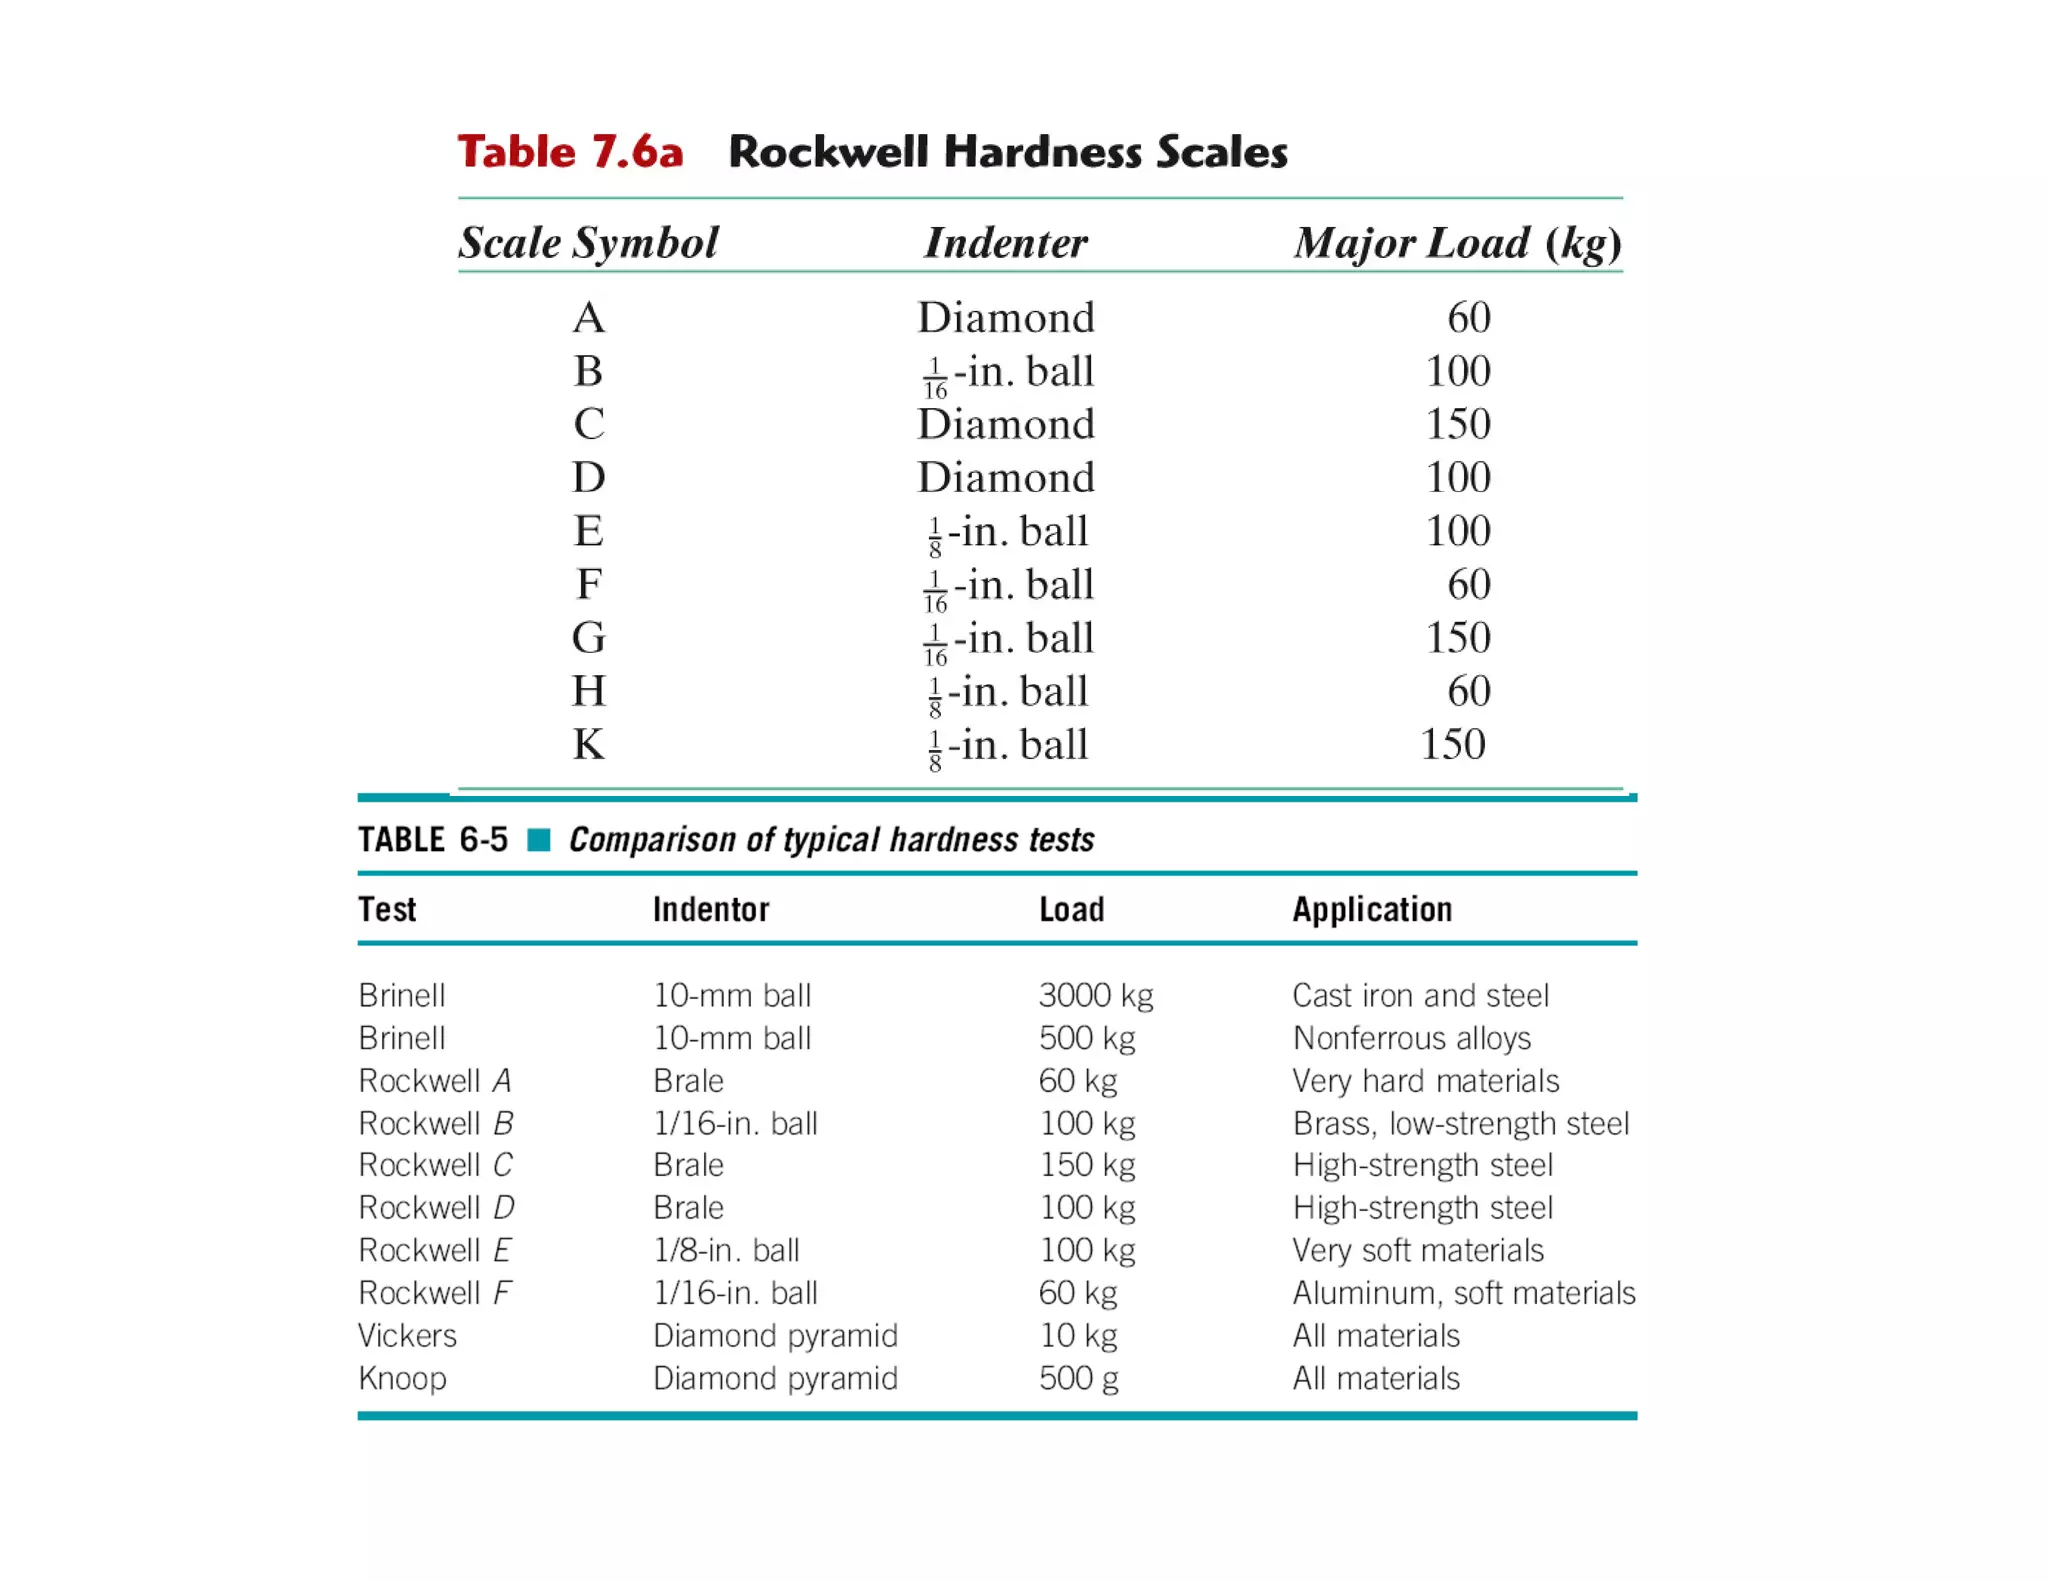
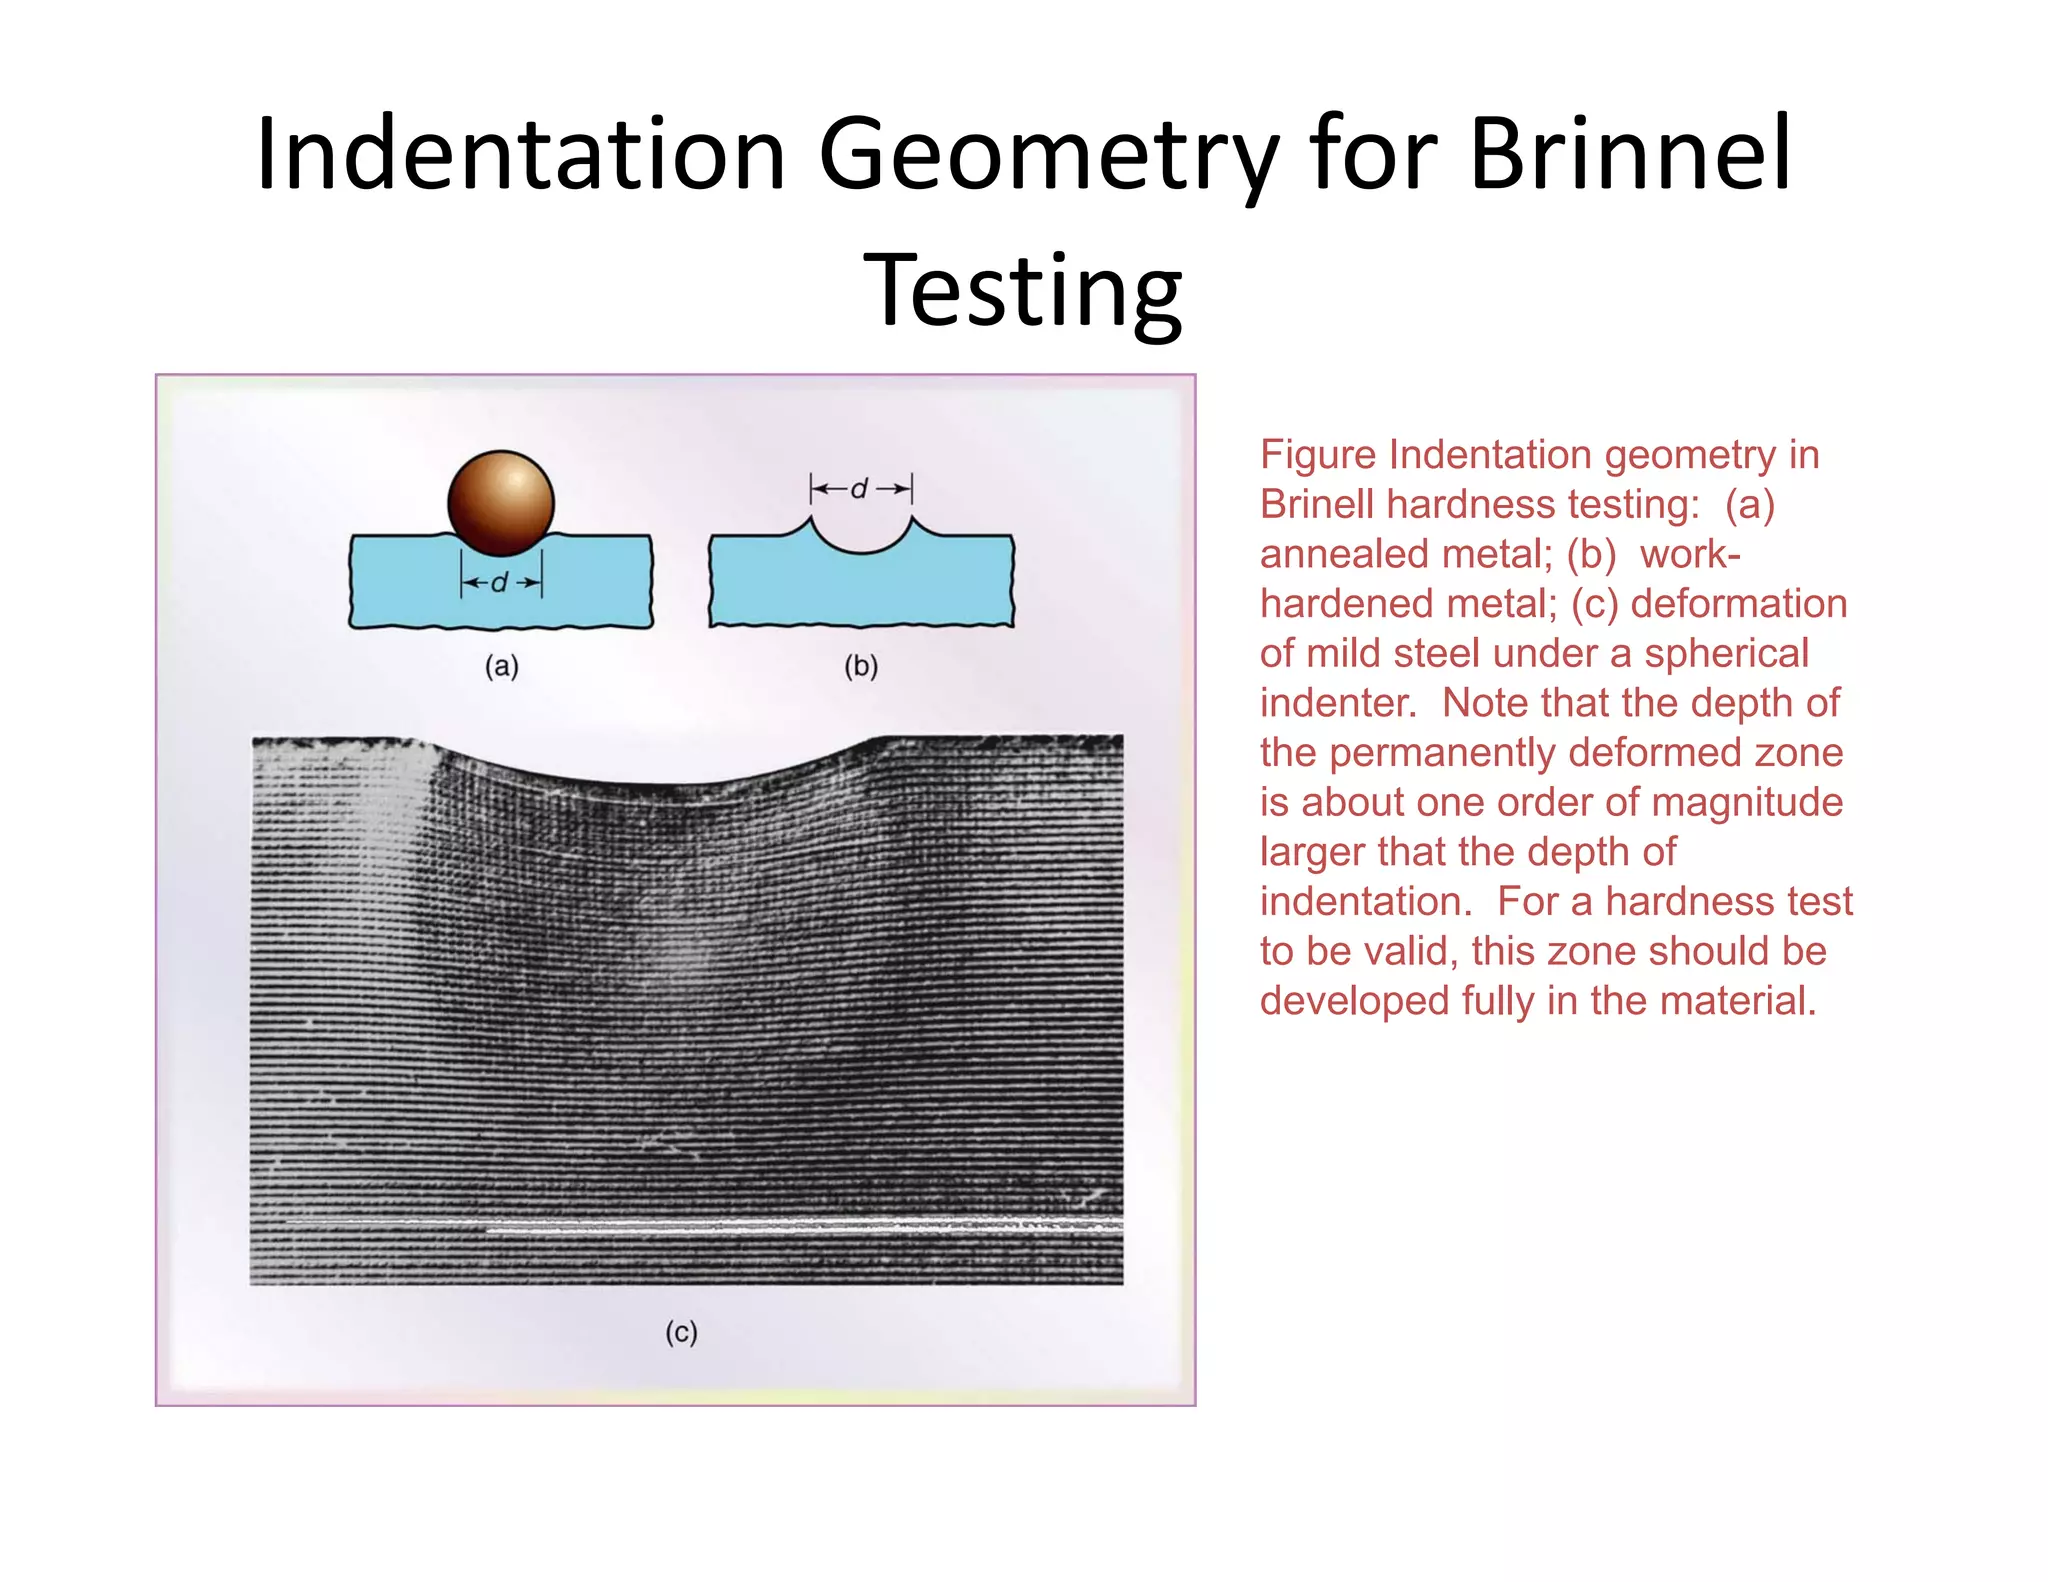
1c] Hardness is one of the important mechanical properties
in engineering. Describe FOUR [4] types of hardness
measurement method in terms of name and types of
indenter.
[ 4 marks]
QUESTION : FINAL EXAM [Oct 2012]](https://image.slidesharecdn.com/9cztb0vaqk6kf4x1vwe8-signature-d98e614c44bb5d5fcfc79eb5ed8fdbf00bc1e22d961d7a0f5fed49408756051c-poli-140724113841-phpapp02/75/Mec281-lecture-156-2048.jpg)
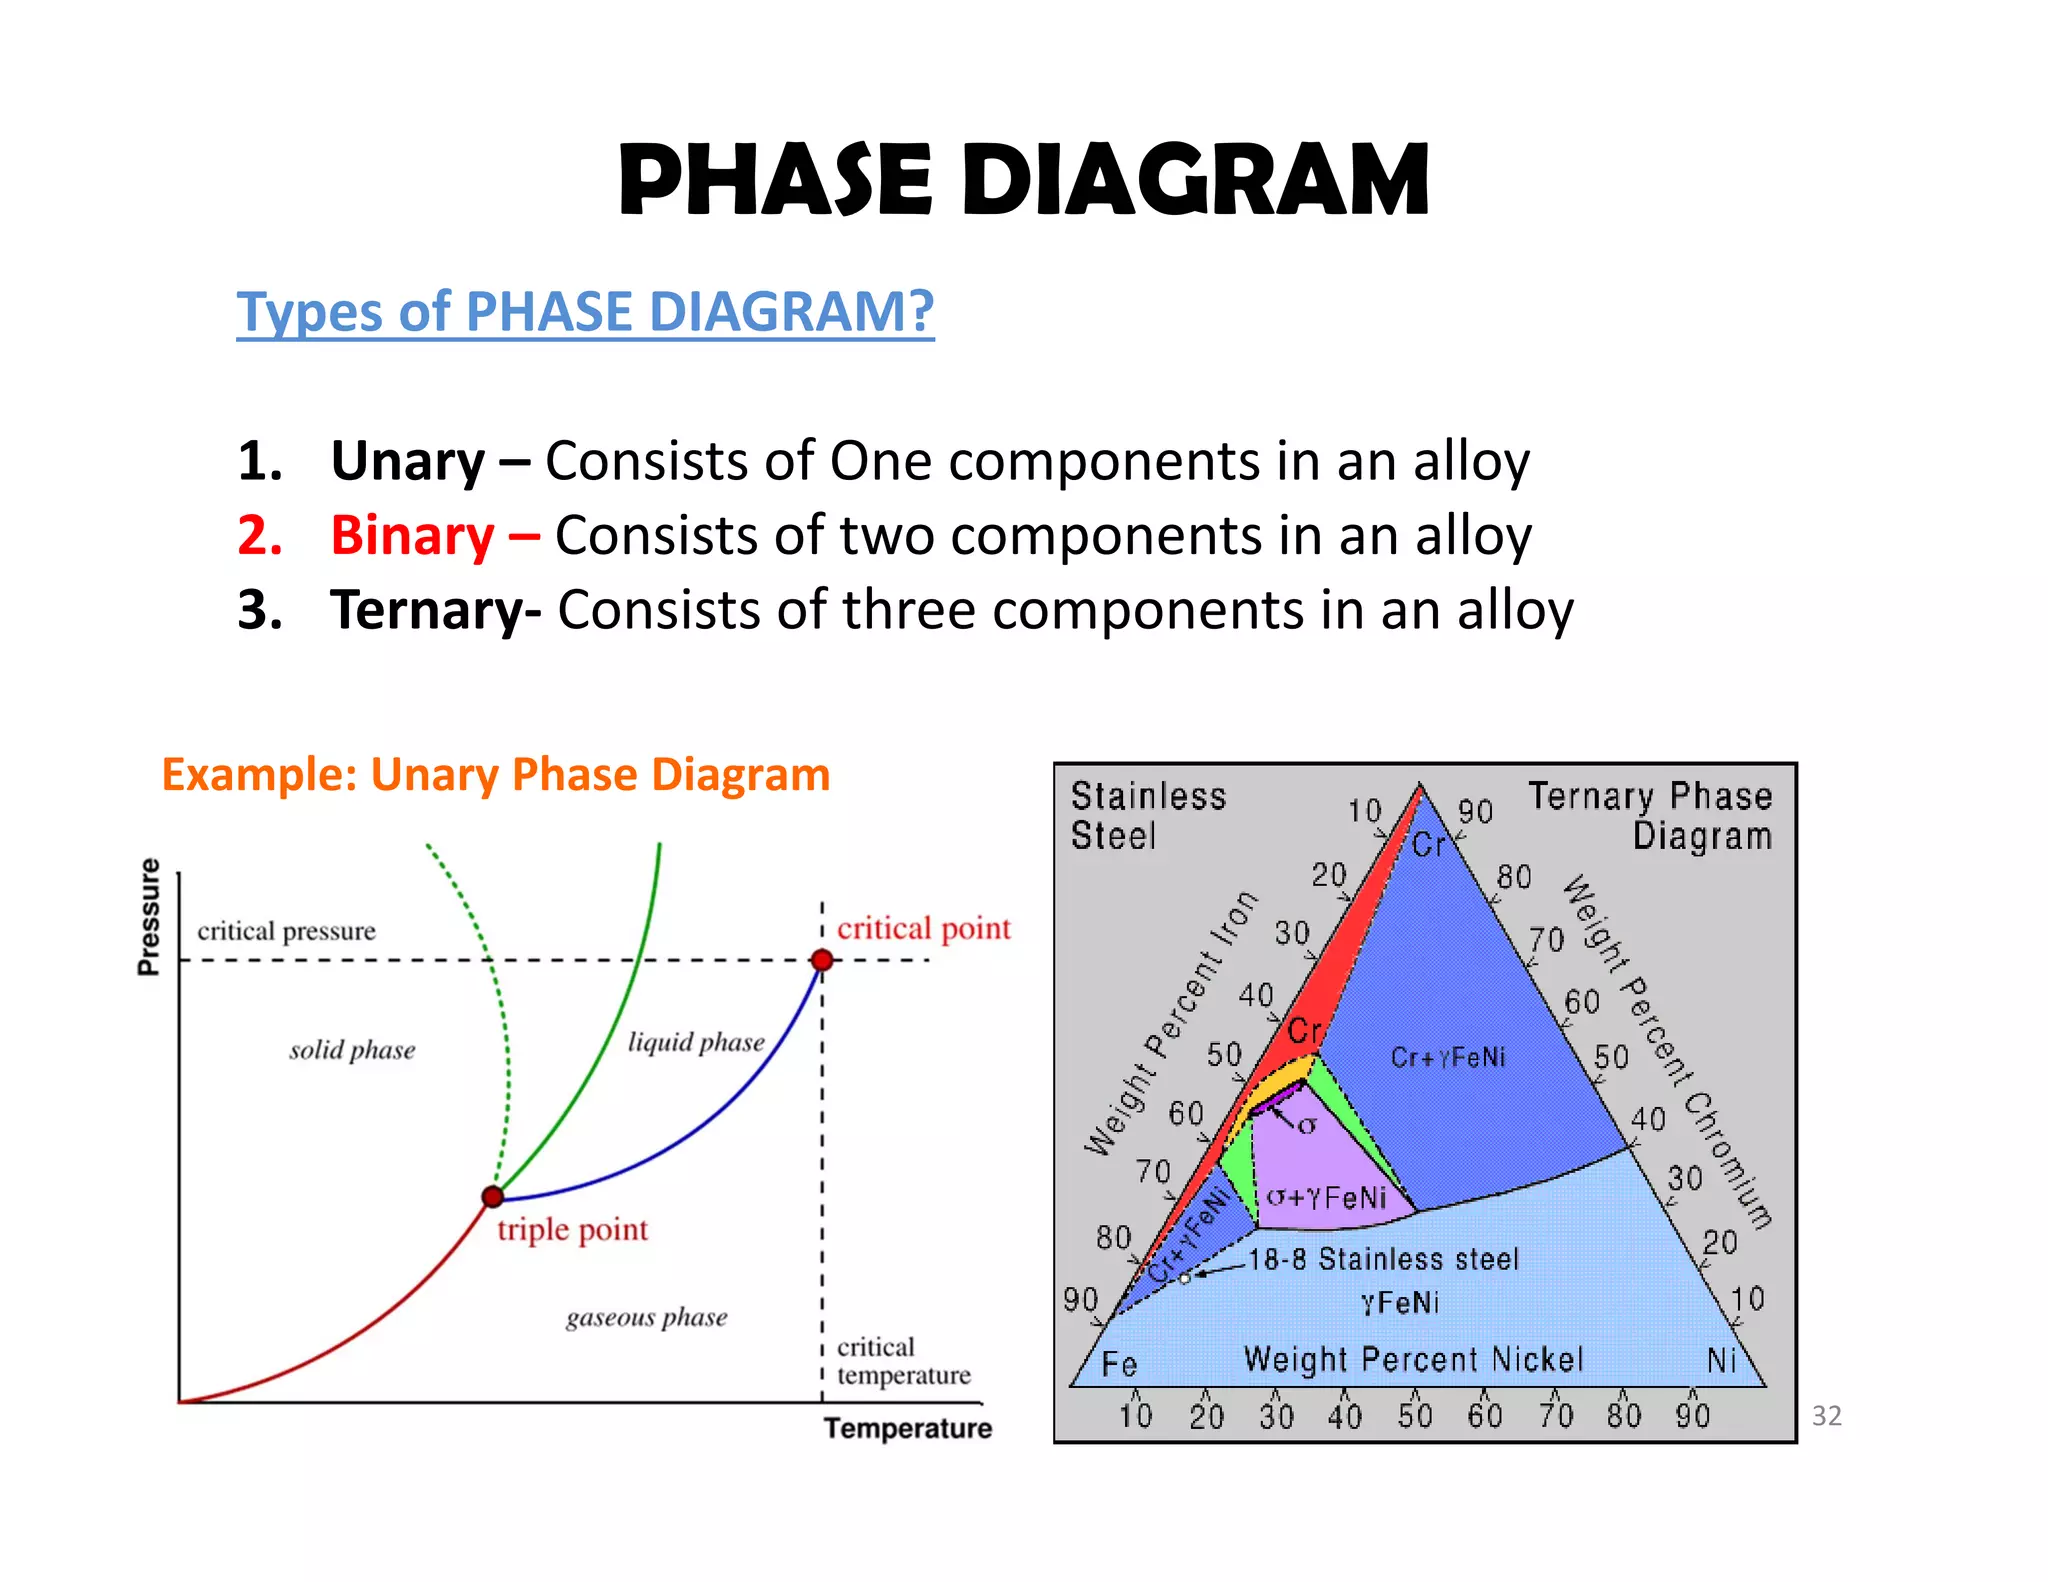
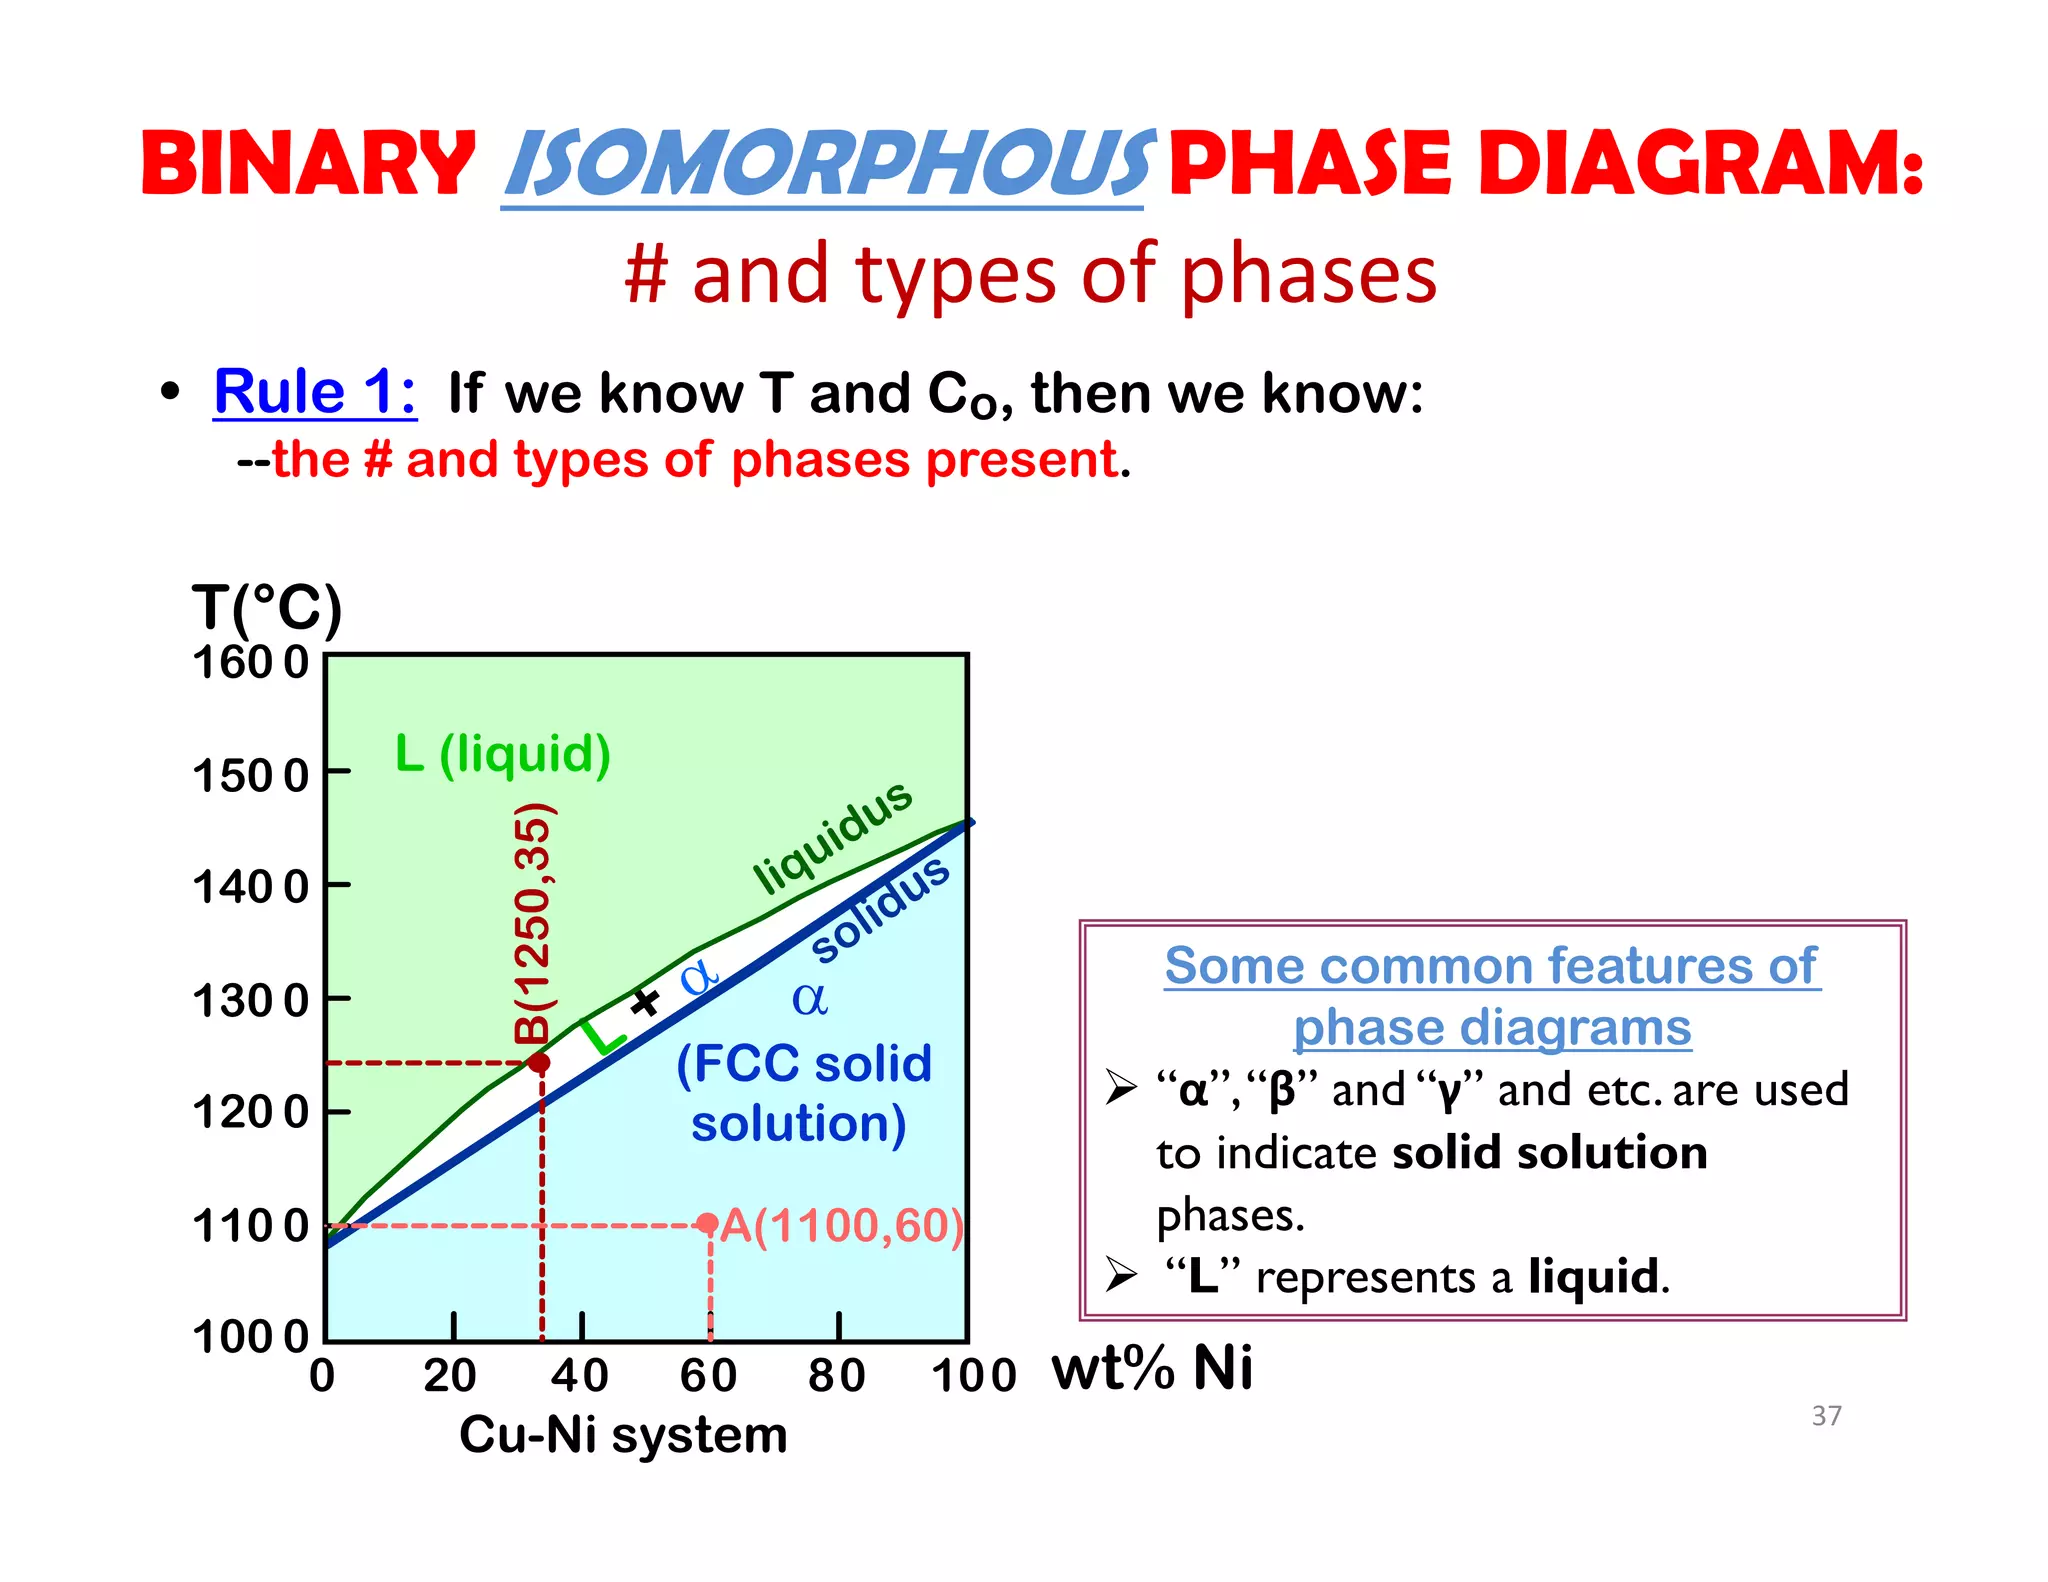
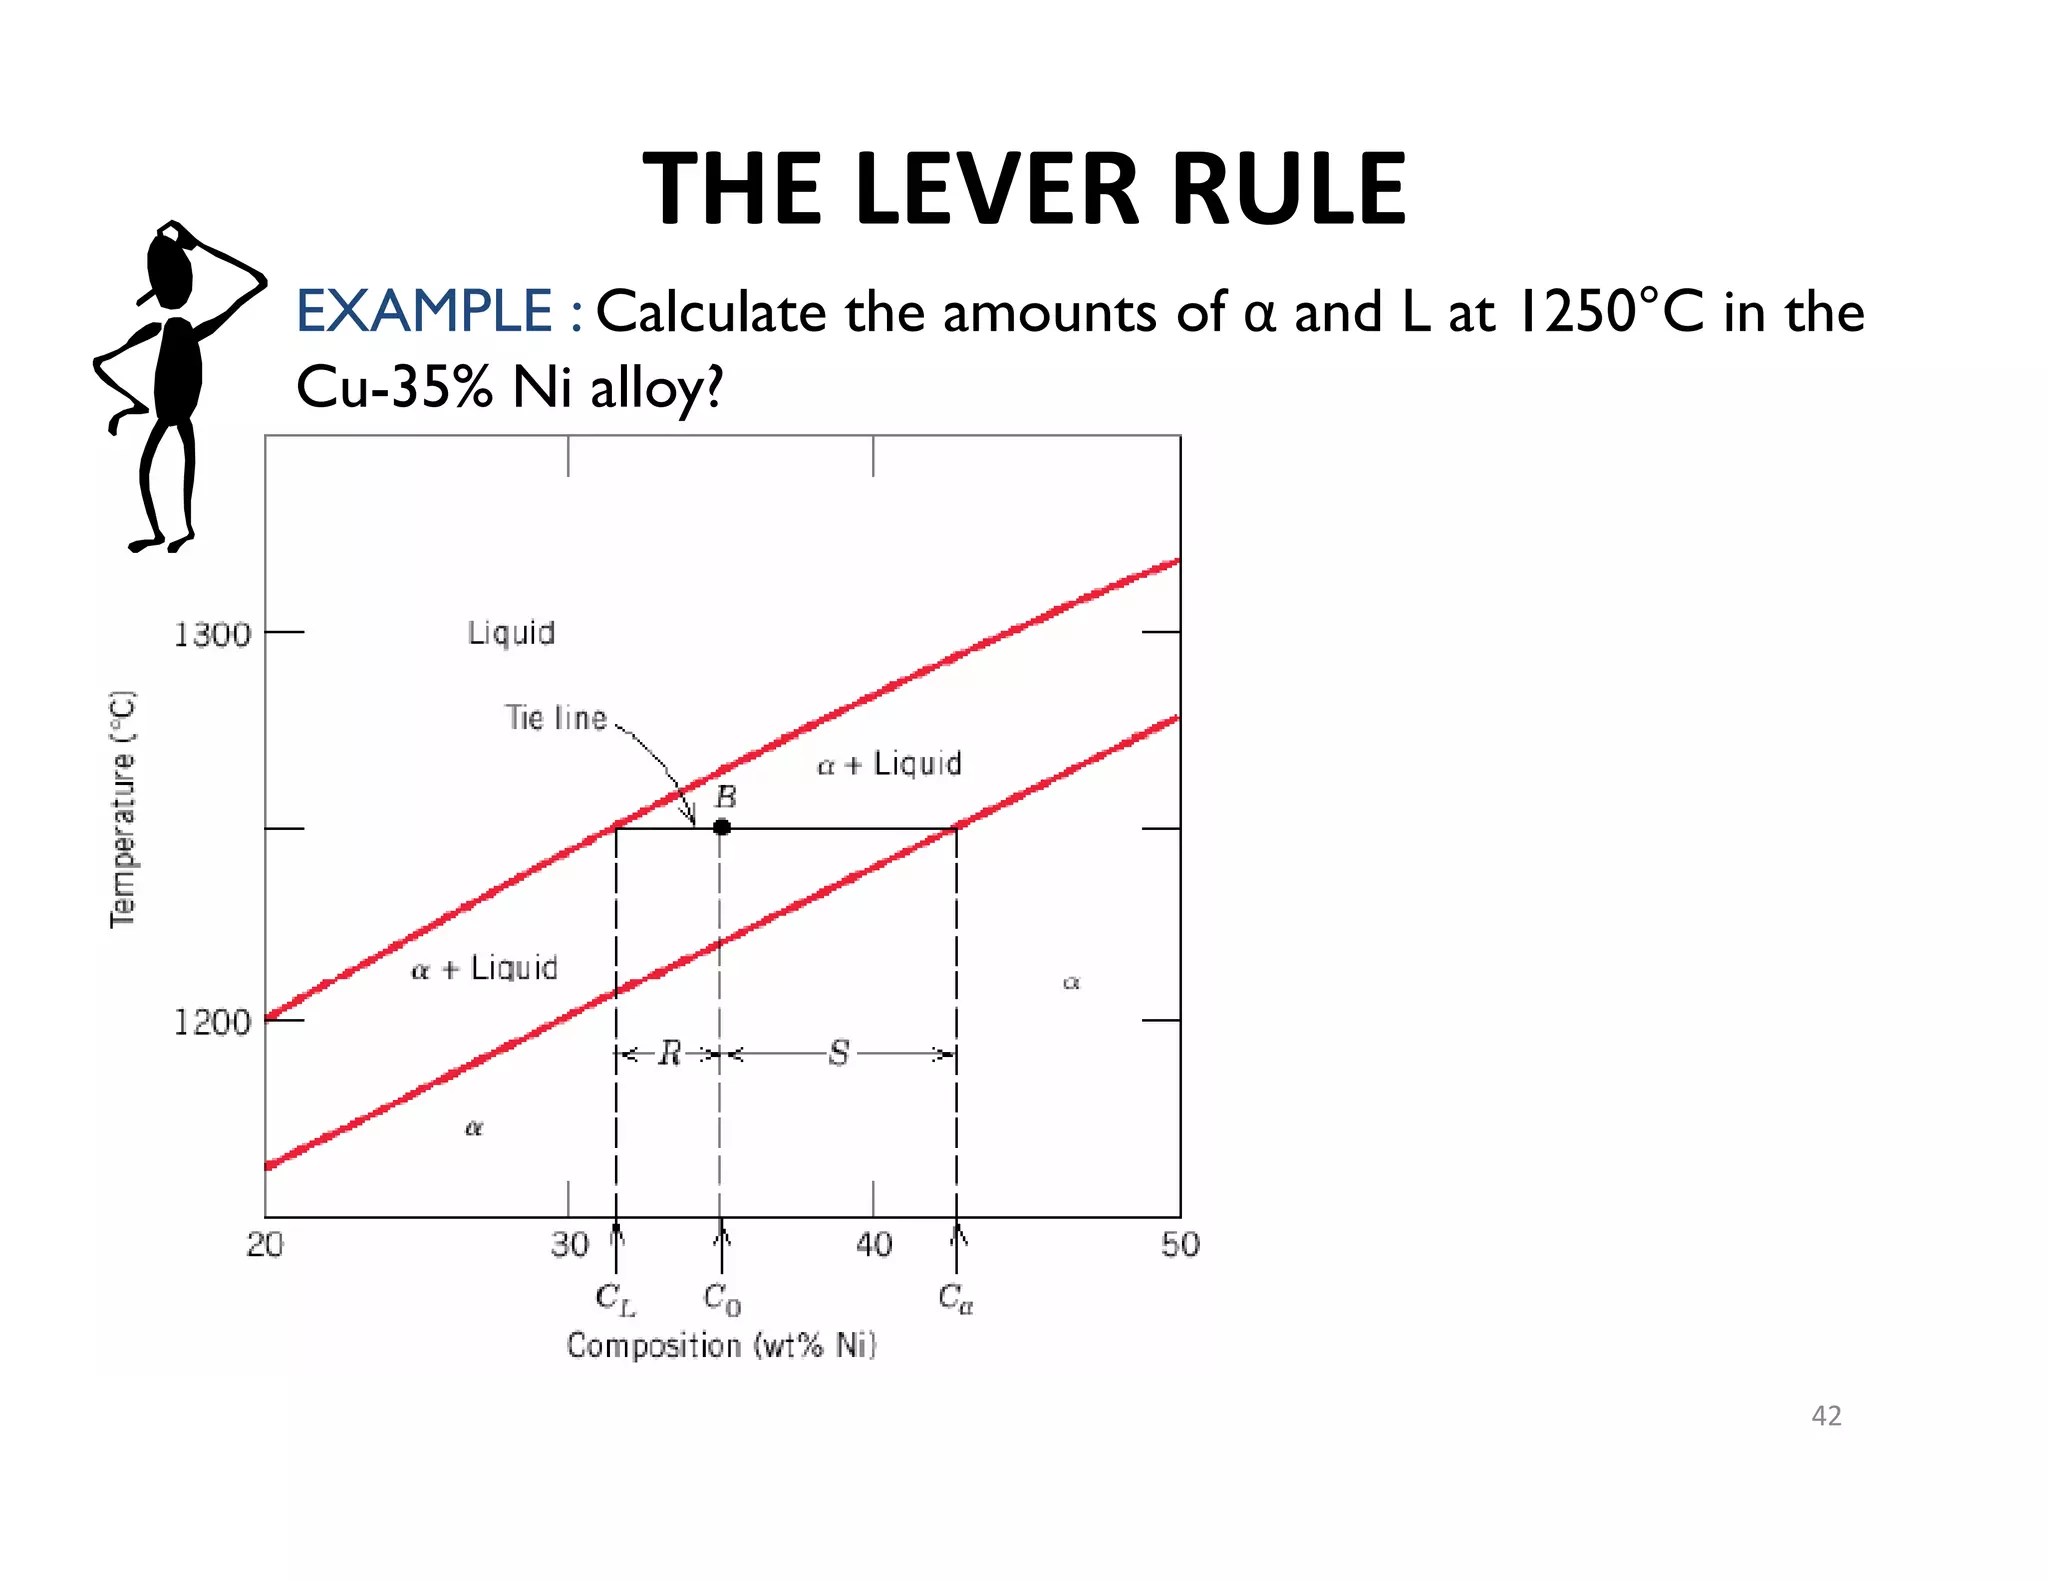
![• Rule 3: If we know T and Co, then we know:
--the amount of each phase [e.g: Single phase (1.0 or 100%)].
Cu-Ni system
SR
Note
•Within single phase alloy, the alloy is completely
(100%) that phase.
•If two phase alloy exists, use Lever Rule
41
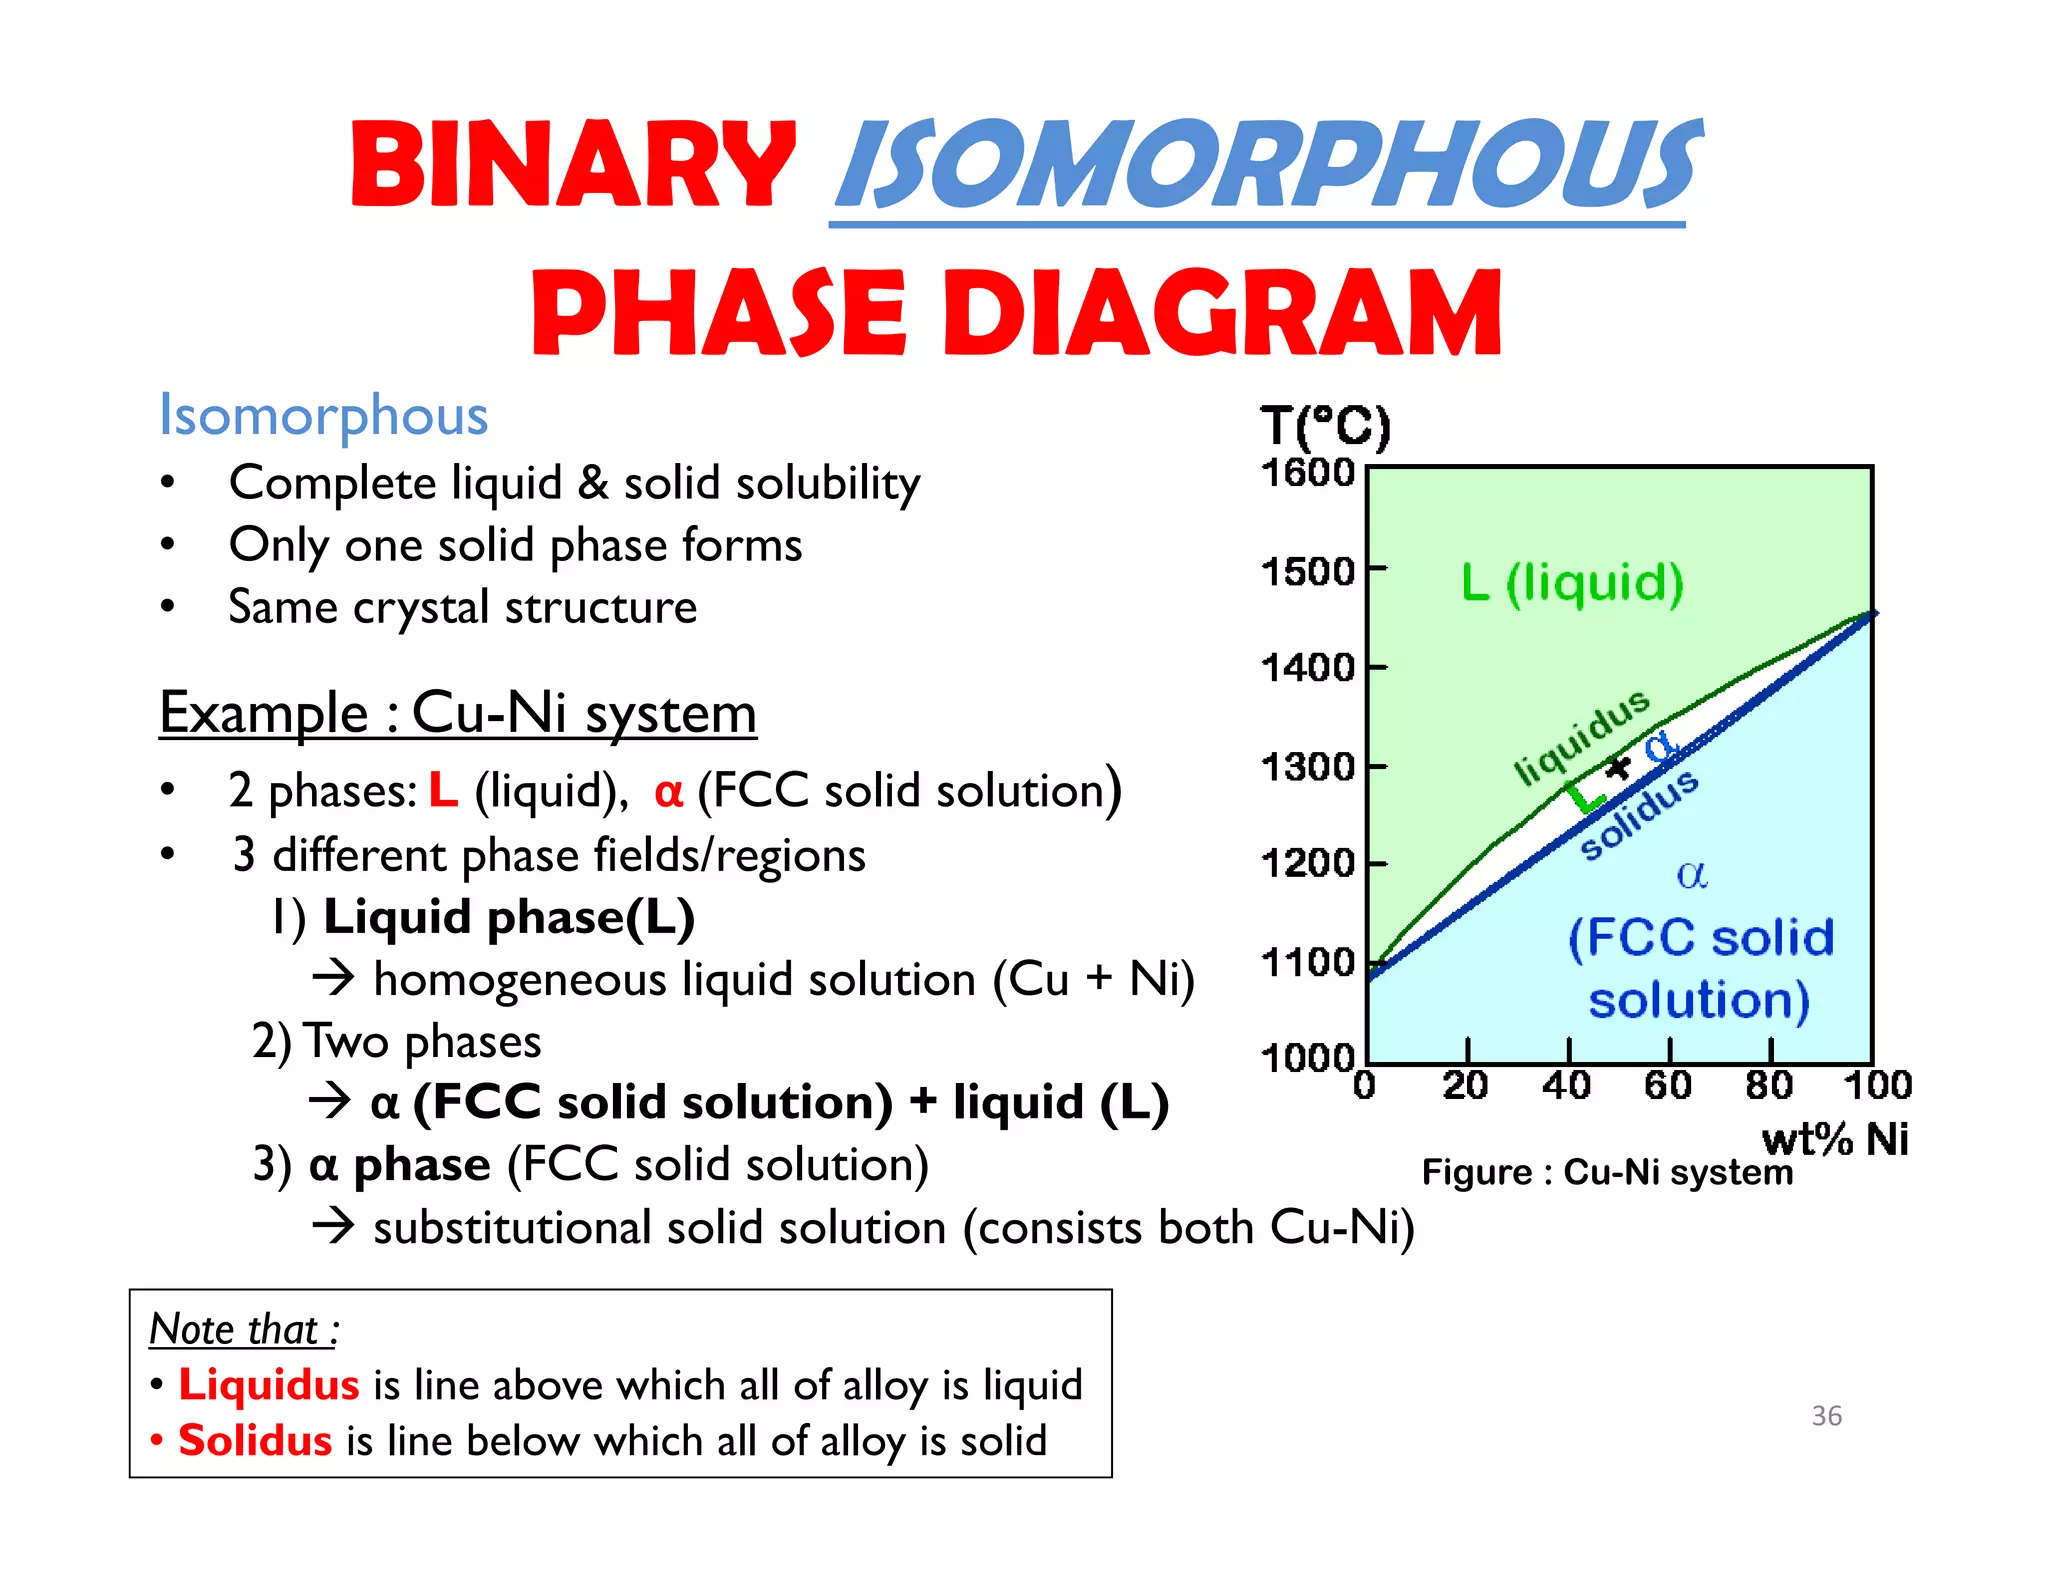
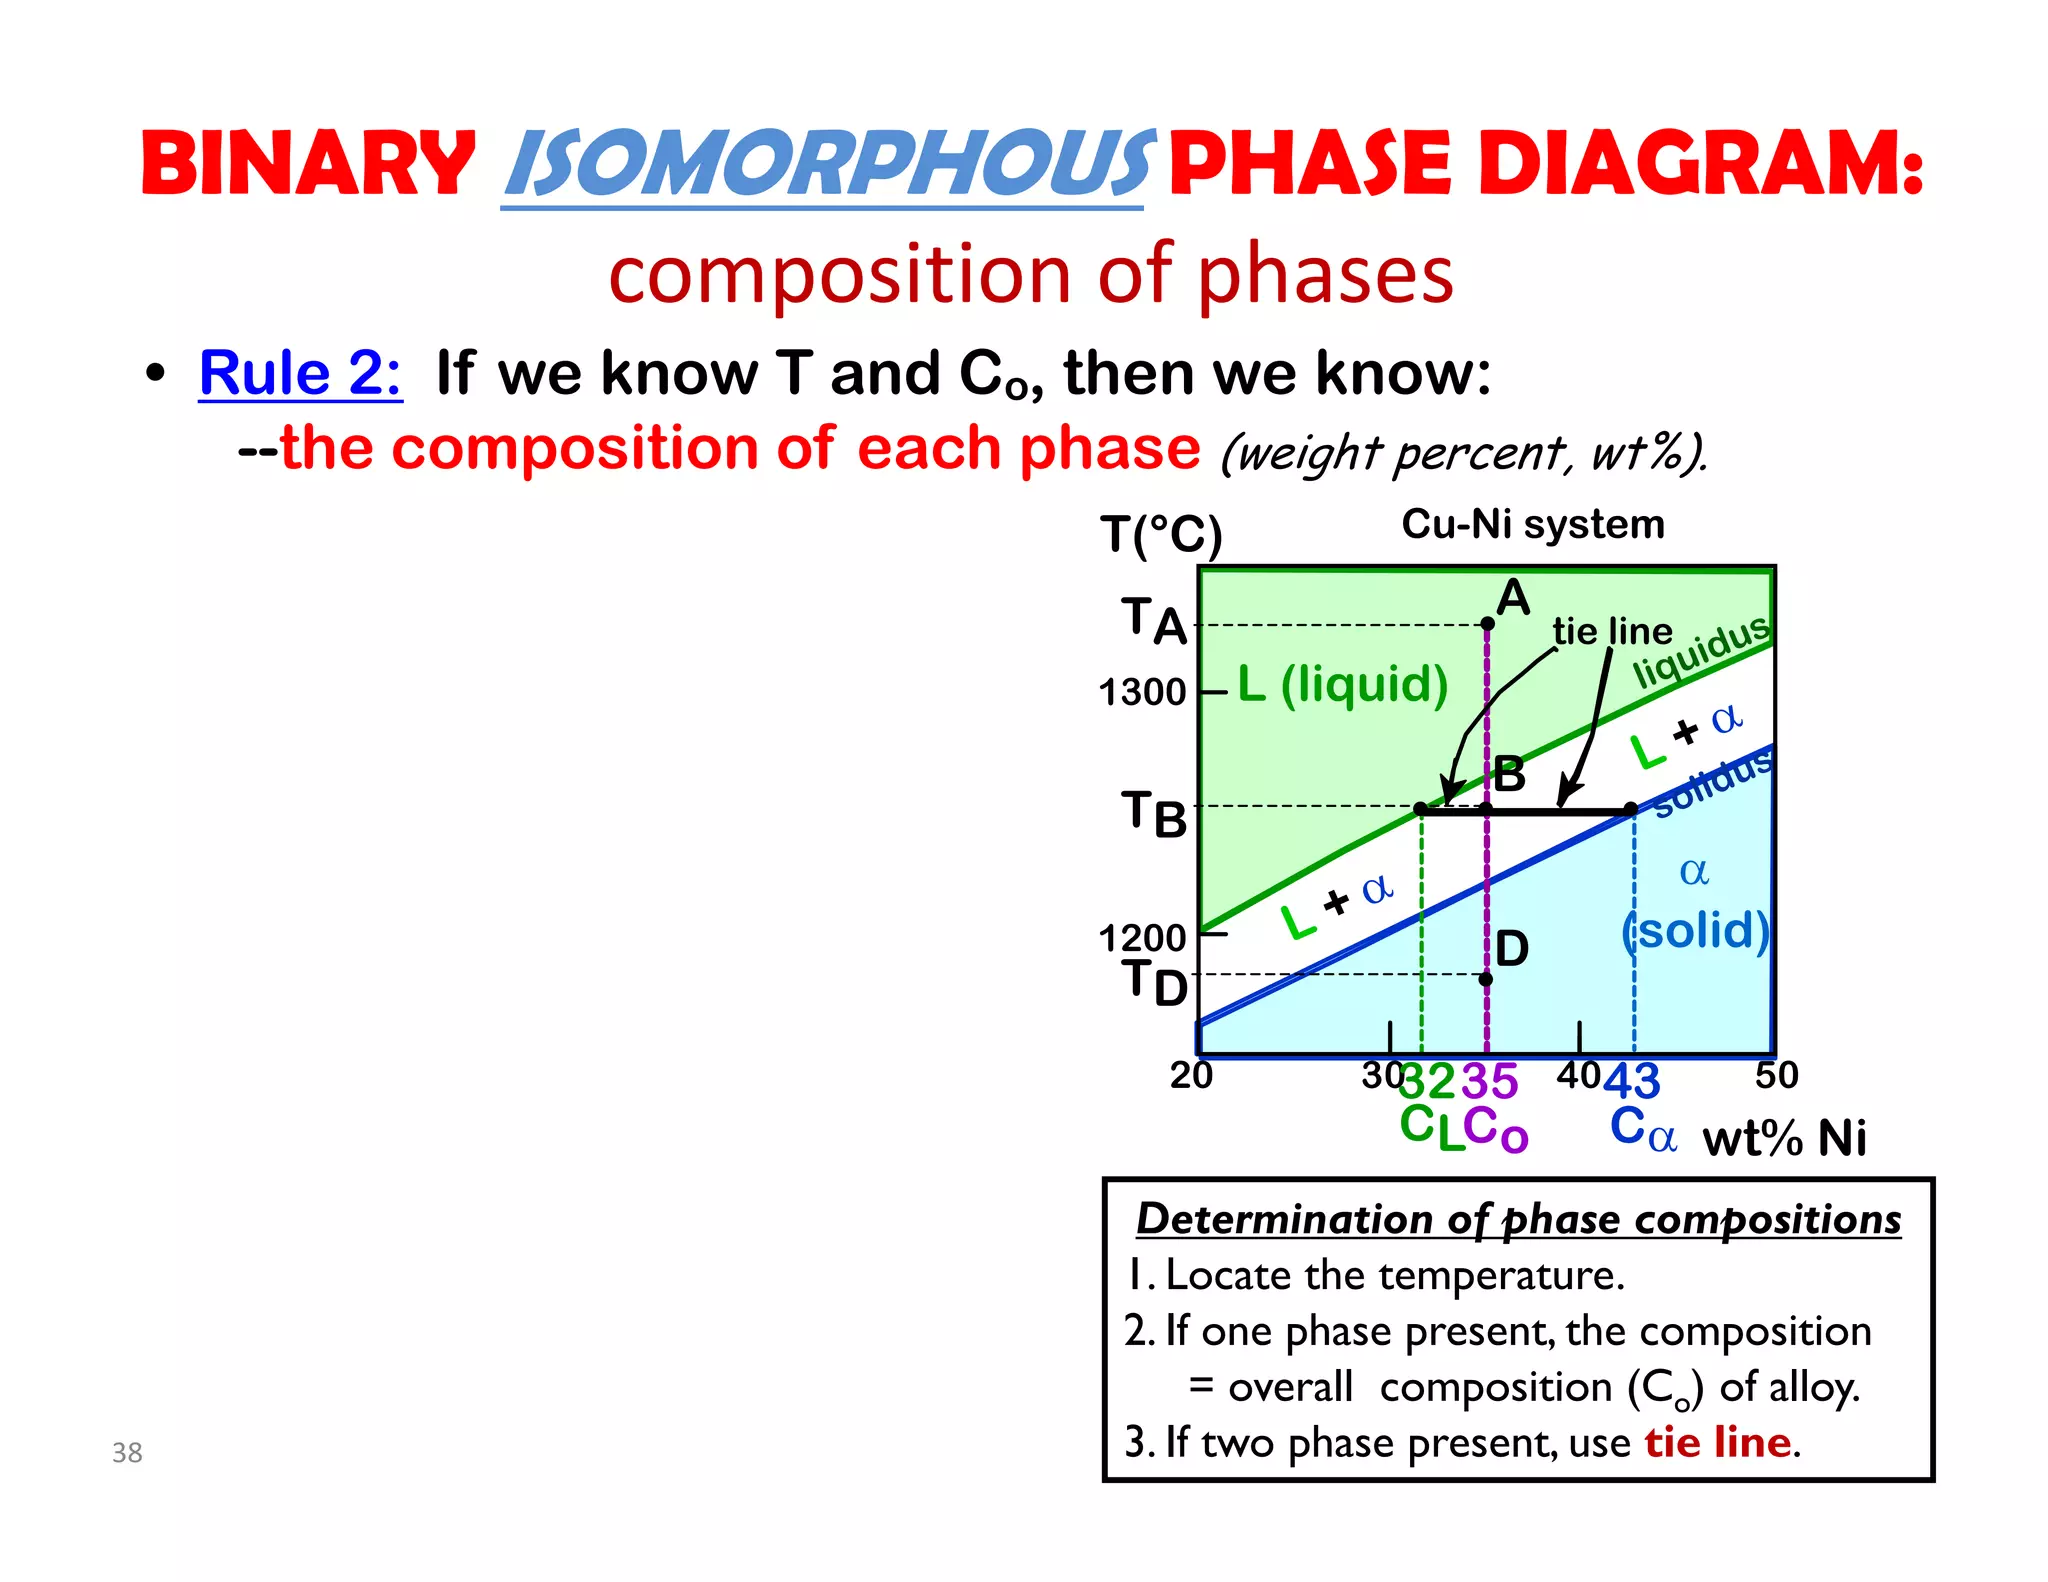
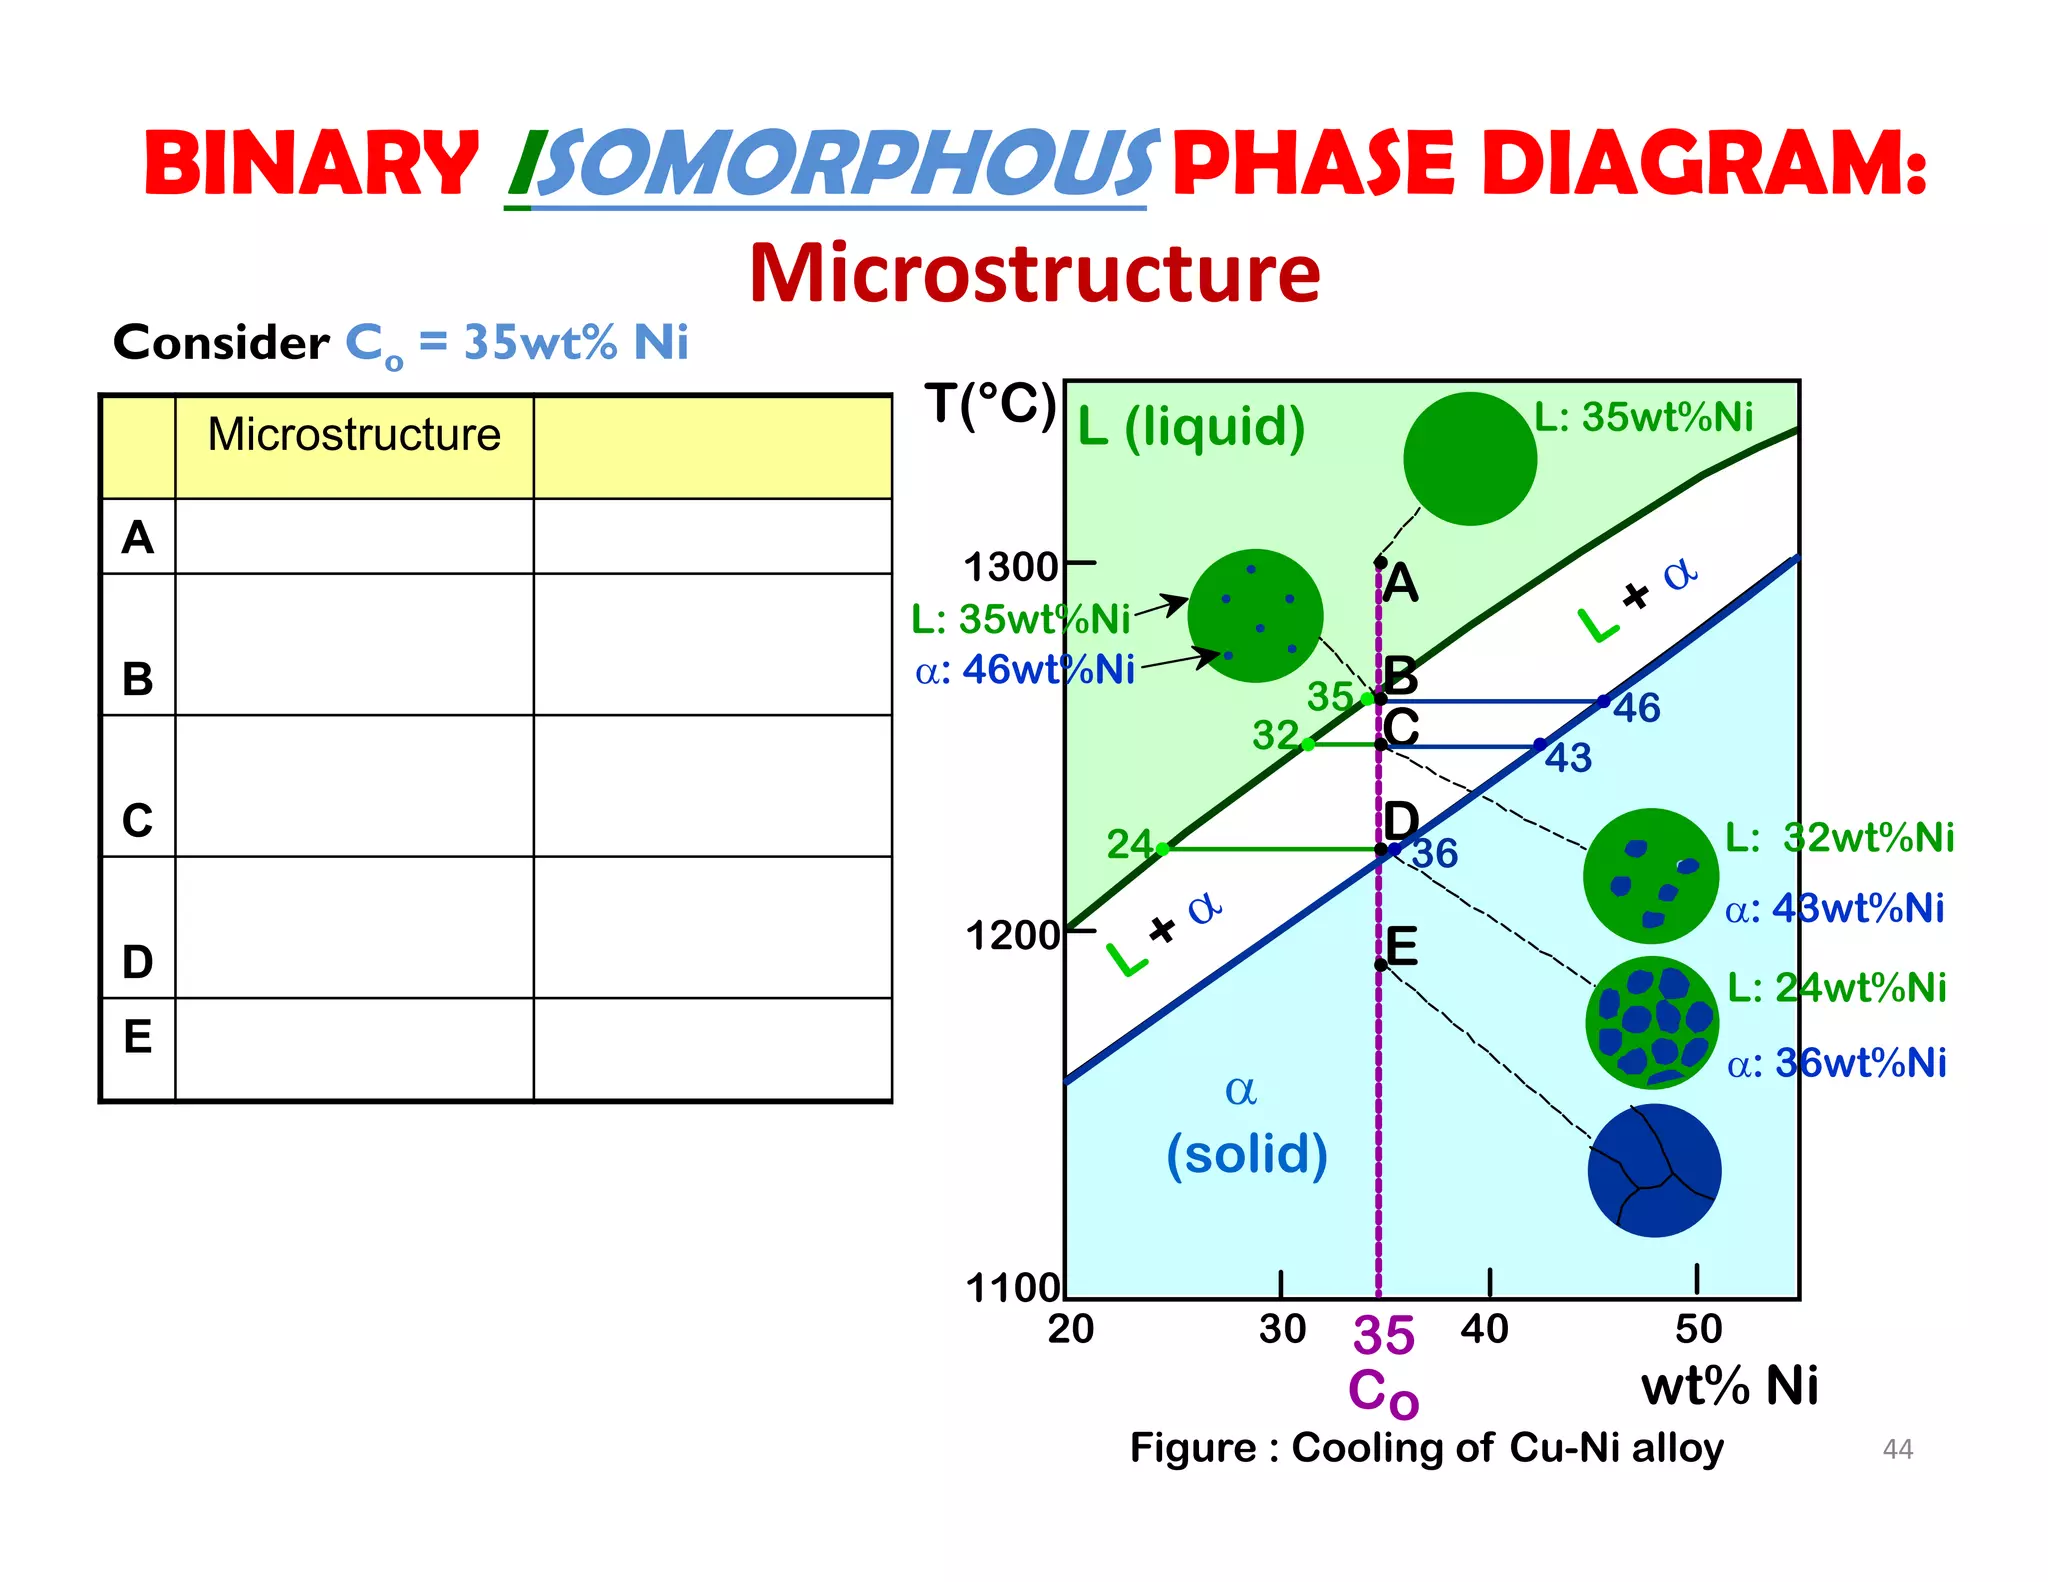
BINARY ISOMORPHOUS PHASE DIAGRAM:
weight fractions of phases
wt% Ni
20
1200
1300
T(°C)
L (liquid)
(solid)
L +
liquidus
solidus
30 40 50
TA
A
D
TD
TB
B
tie line
L +
433532
CoCL C
R S](https://image.slidesharecdn.com/9cztb0vaqk6kf4x1vwe8-signature-d98e614c44bb5d5fcfc79eb5ed8fdbf00bc1e22d961d7a0f5fed49408756051c-poli-140724113841-phpapp02/75/Mec281-lecture-198-2048.jpg)


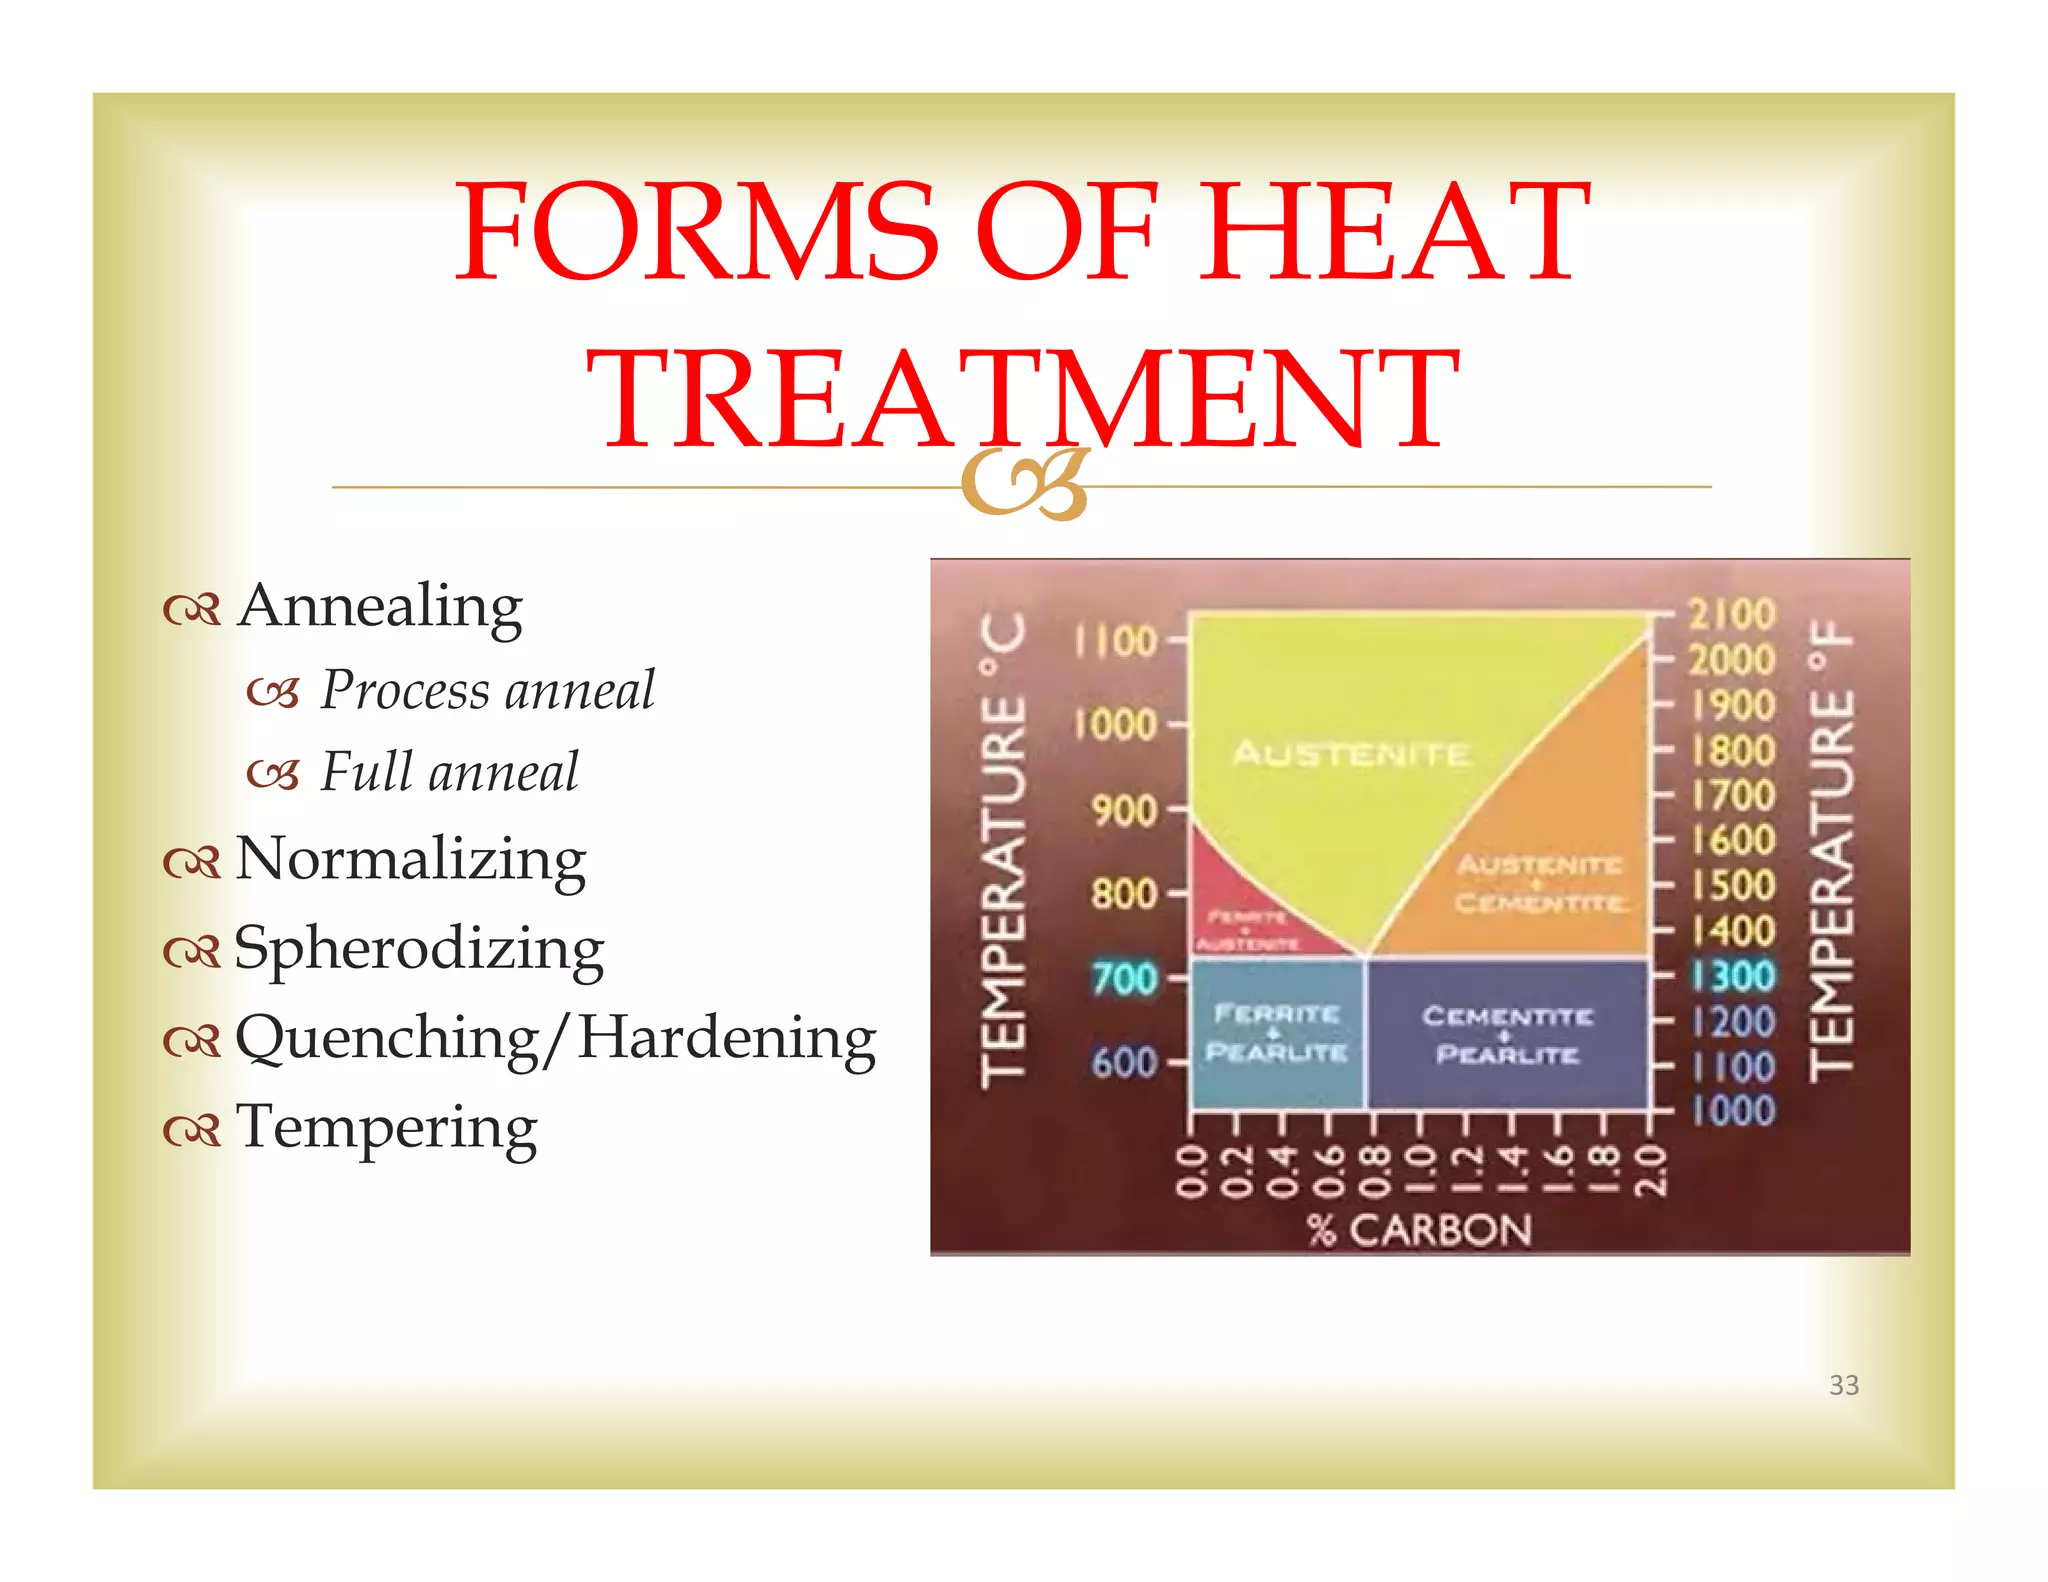
![
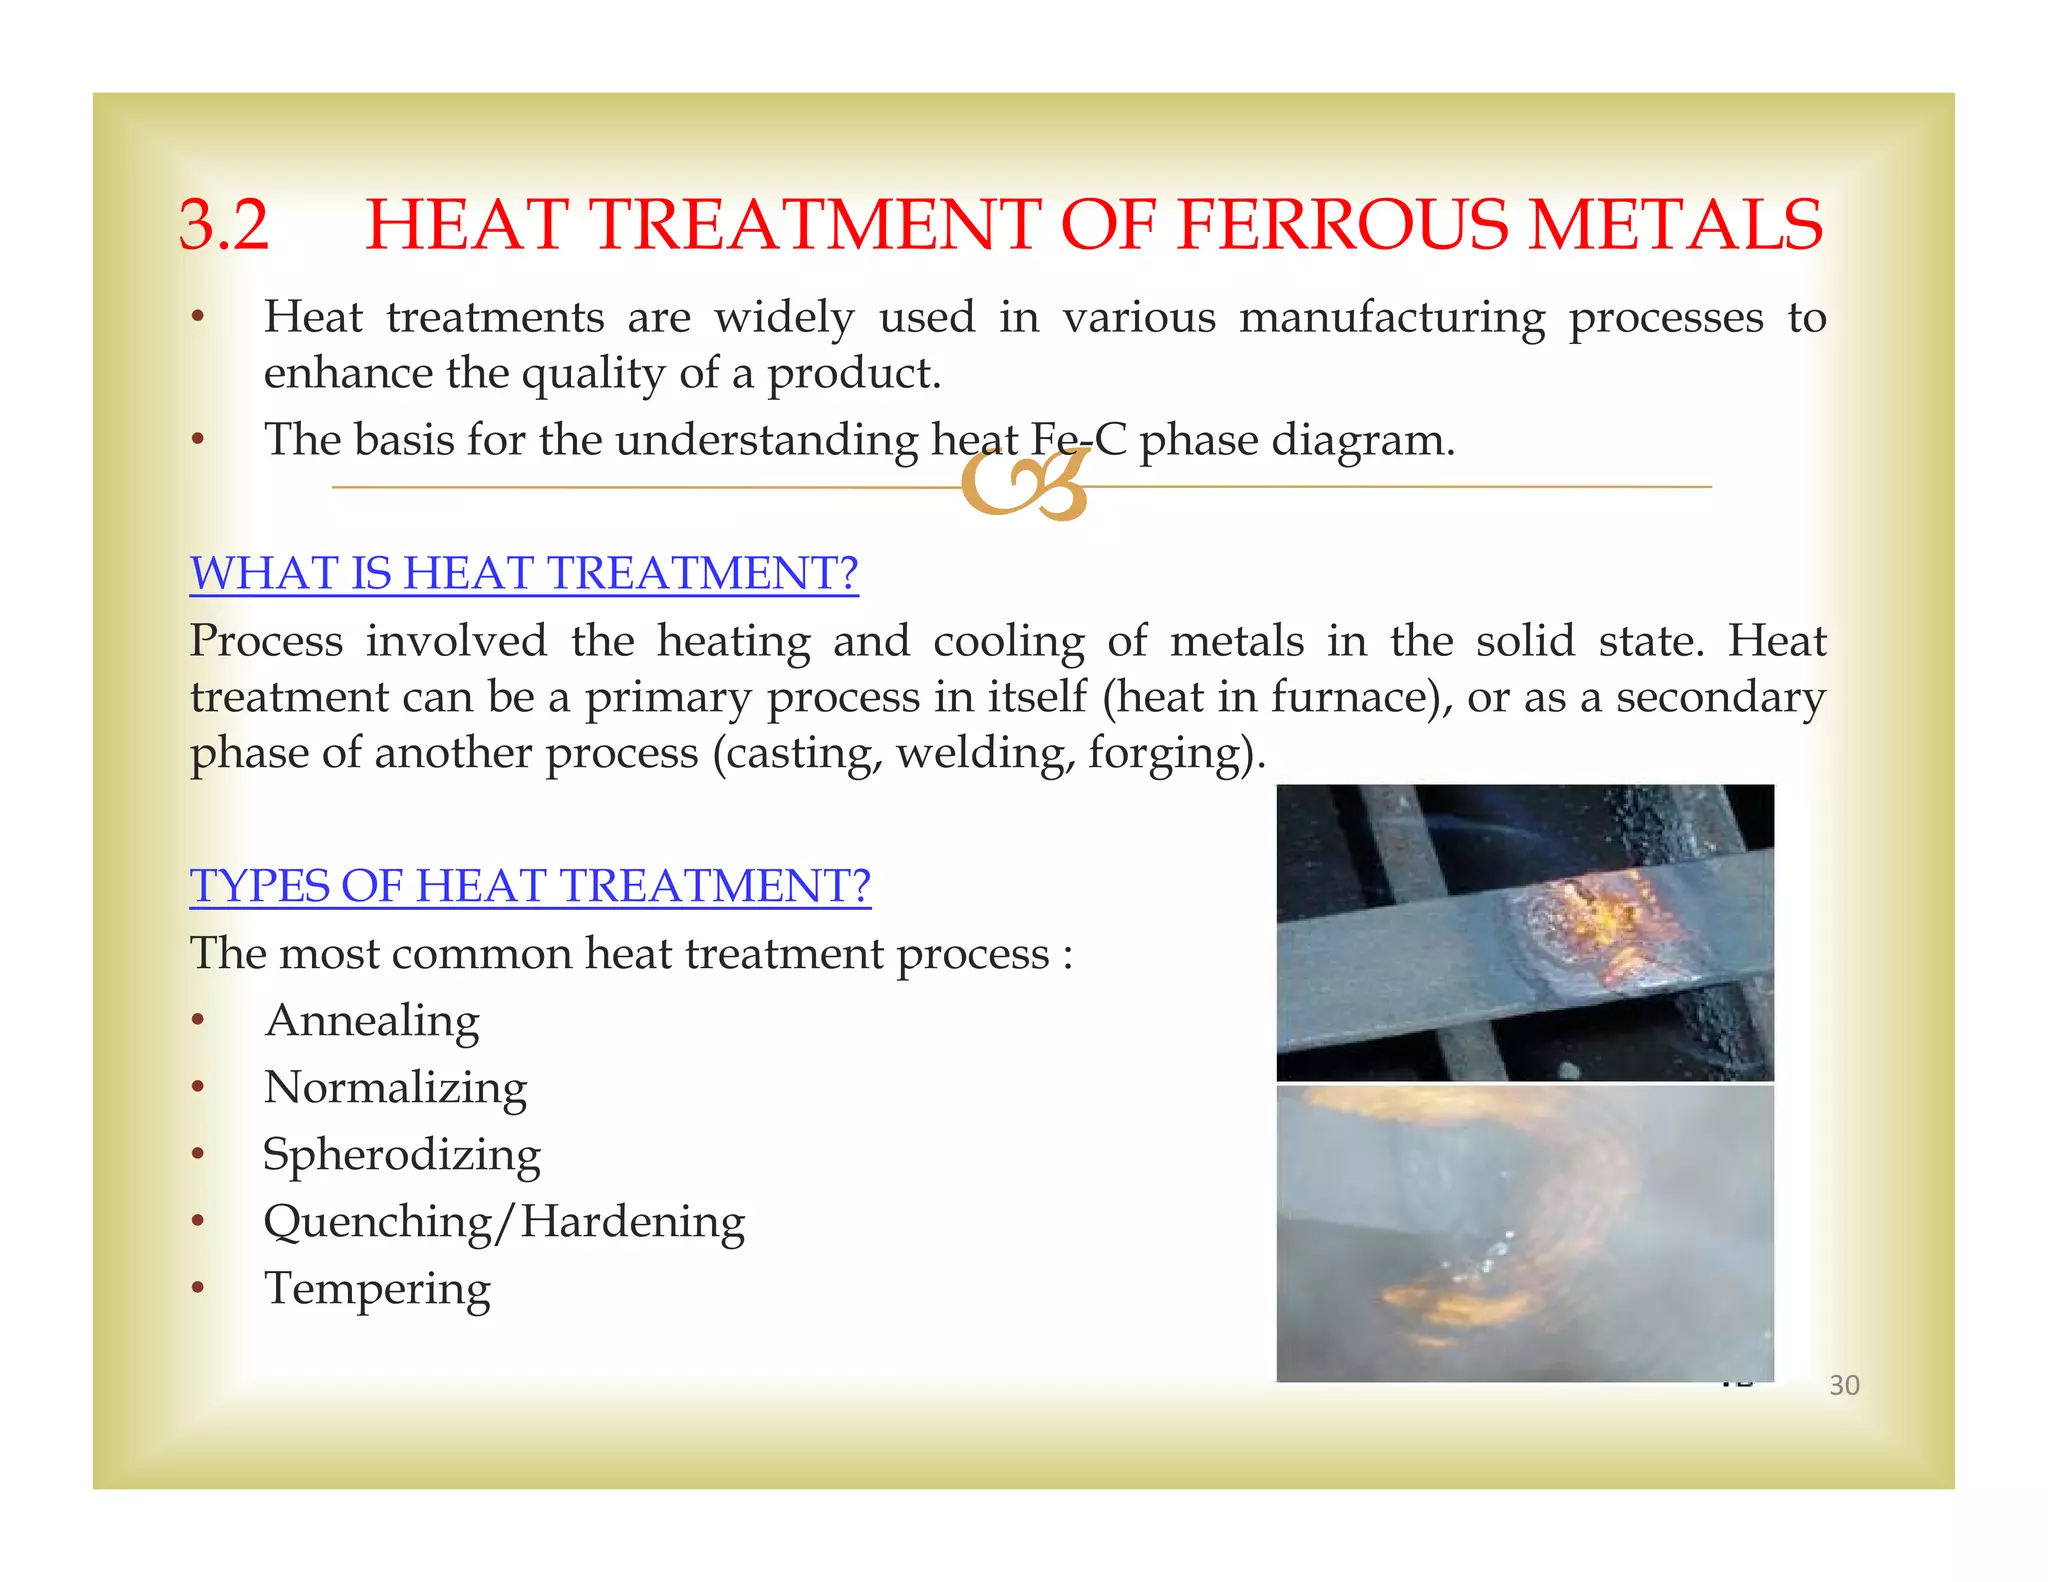
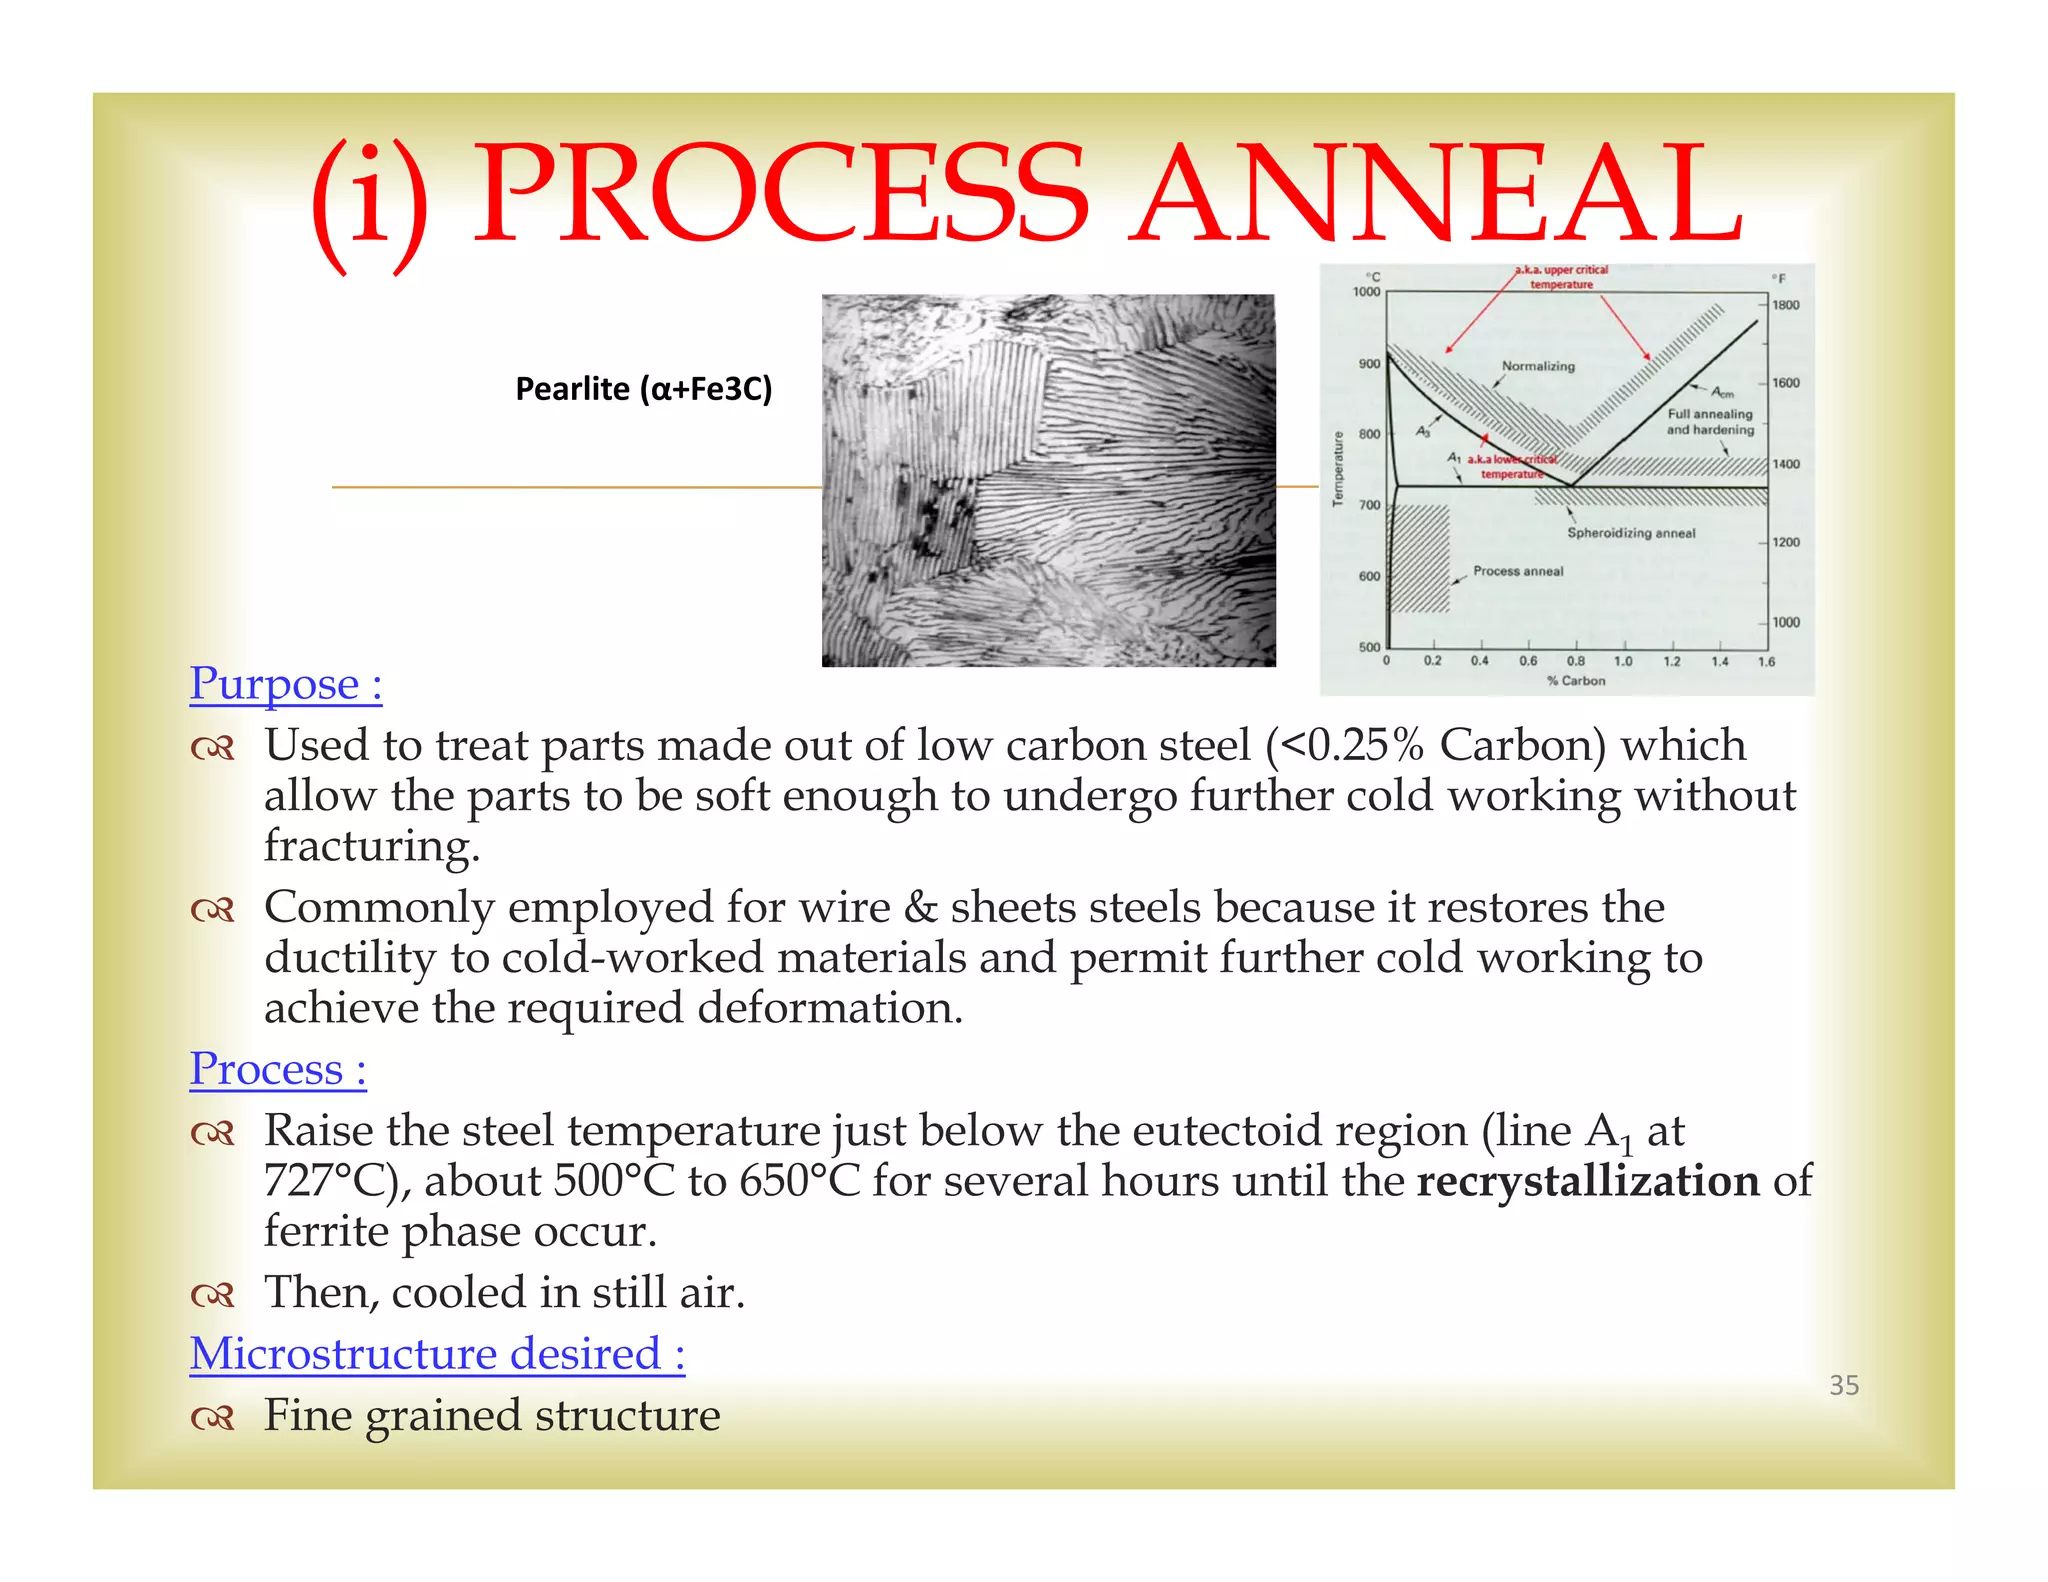
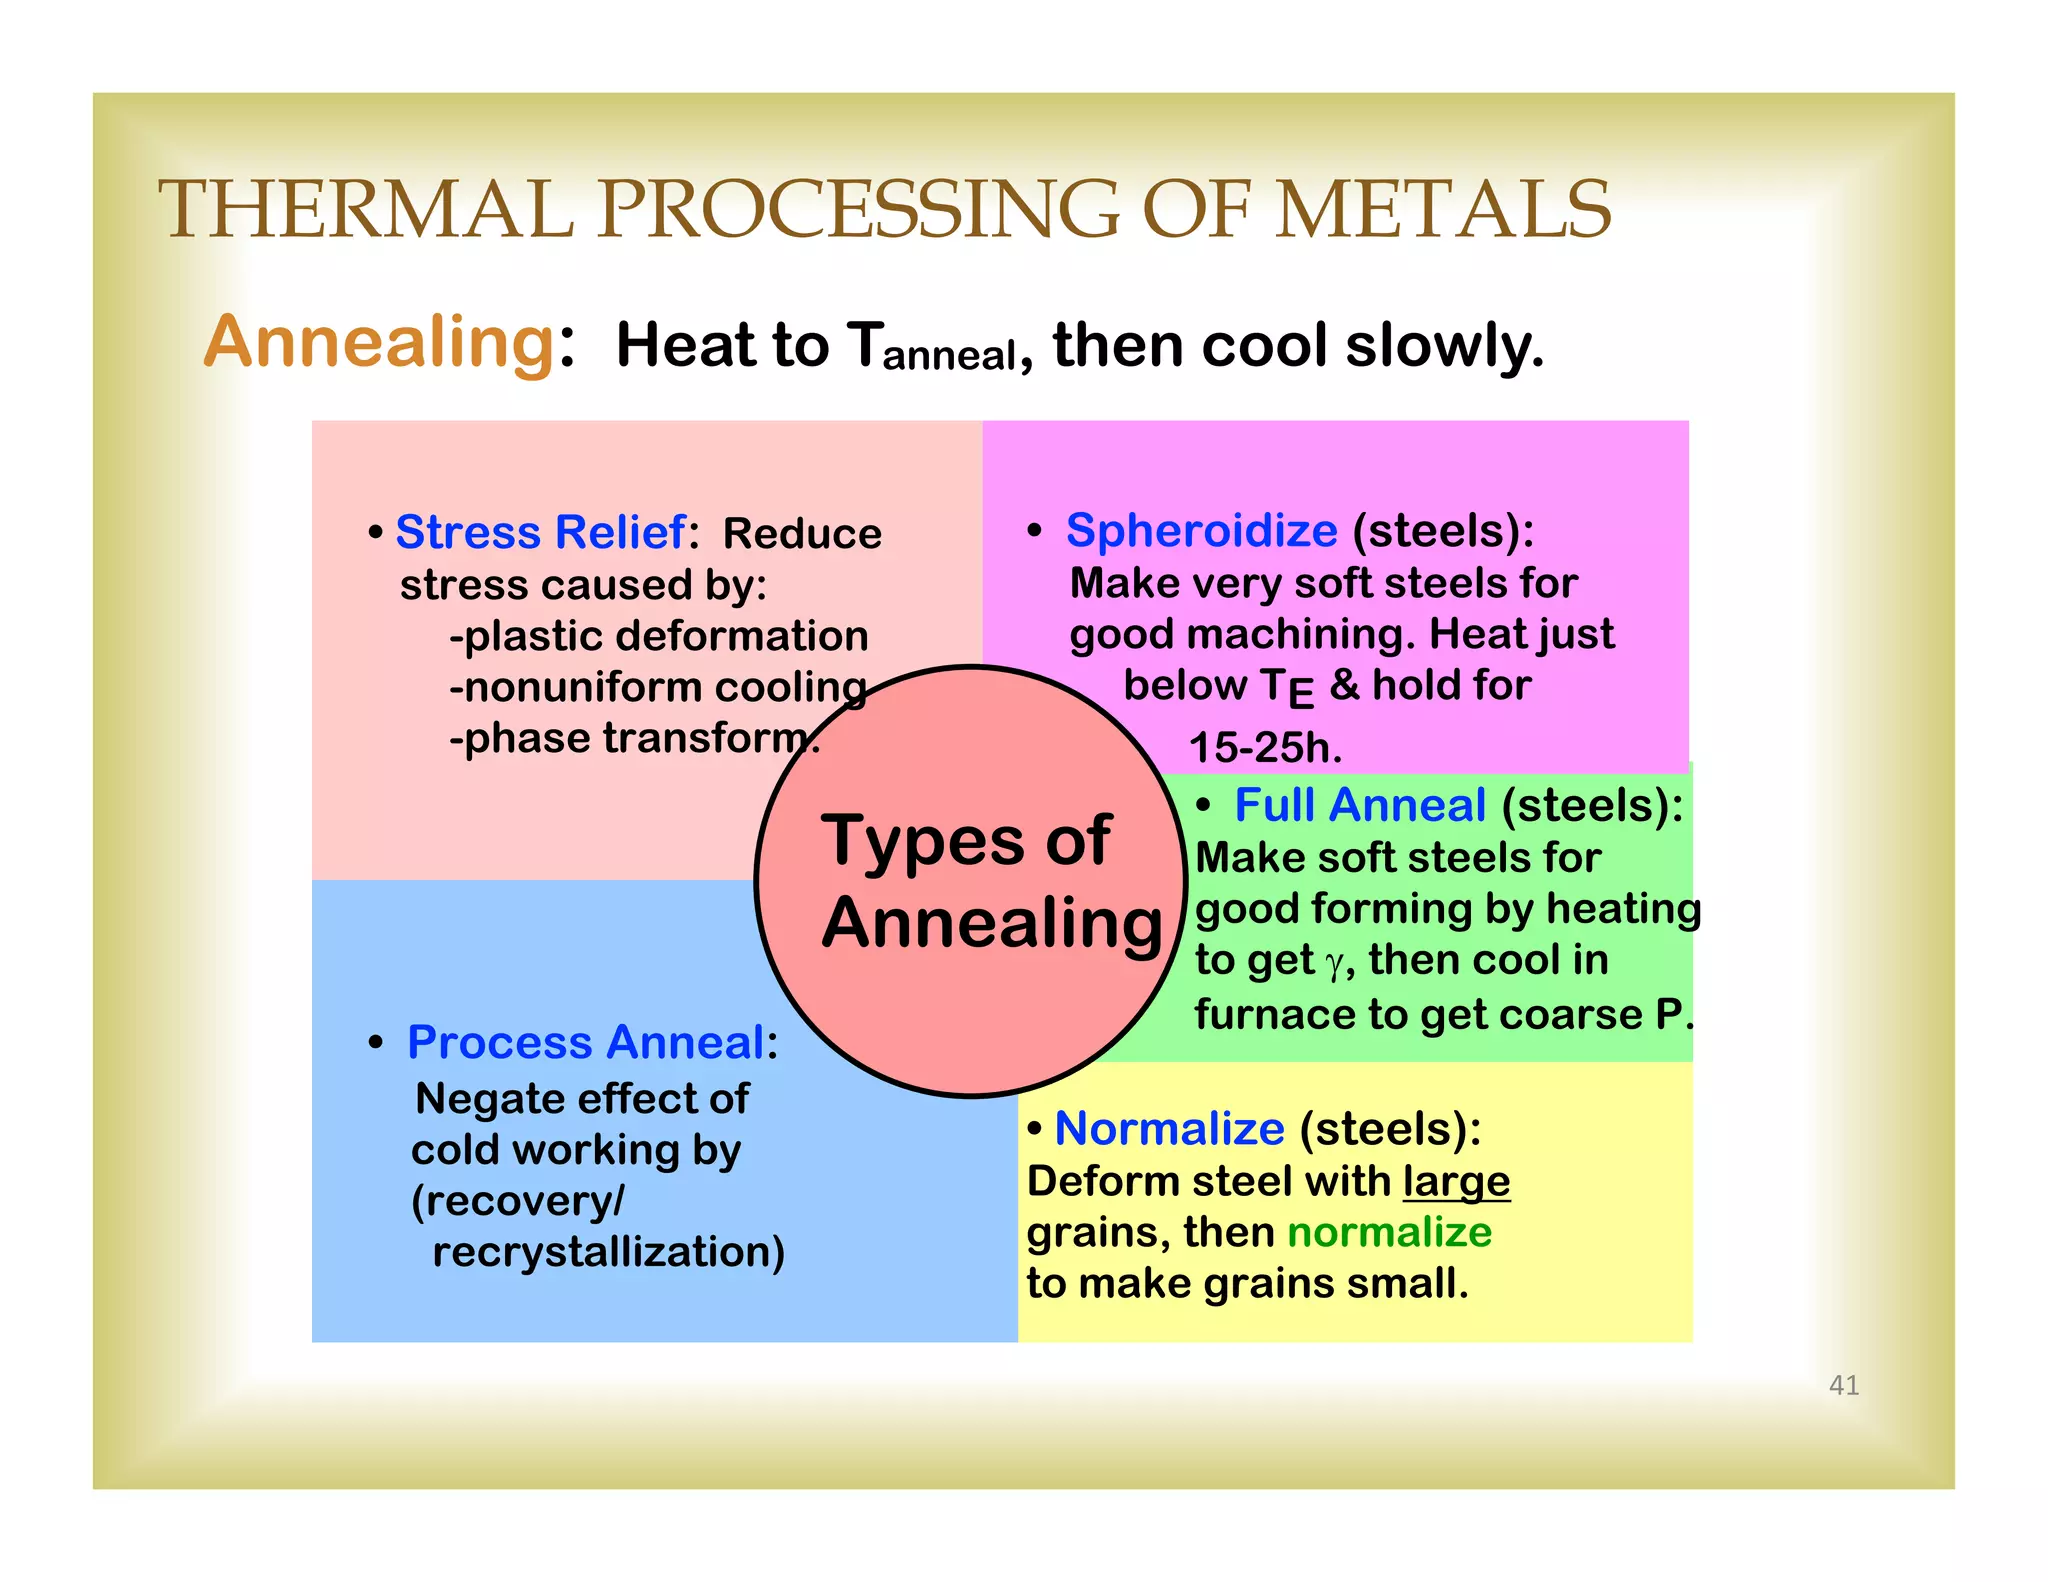
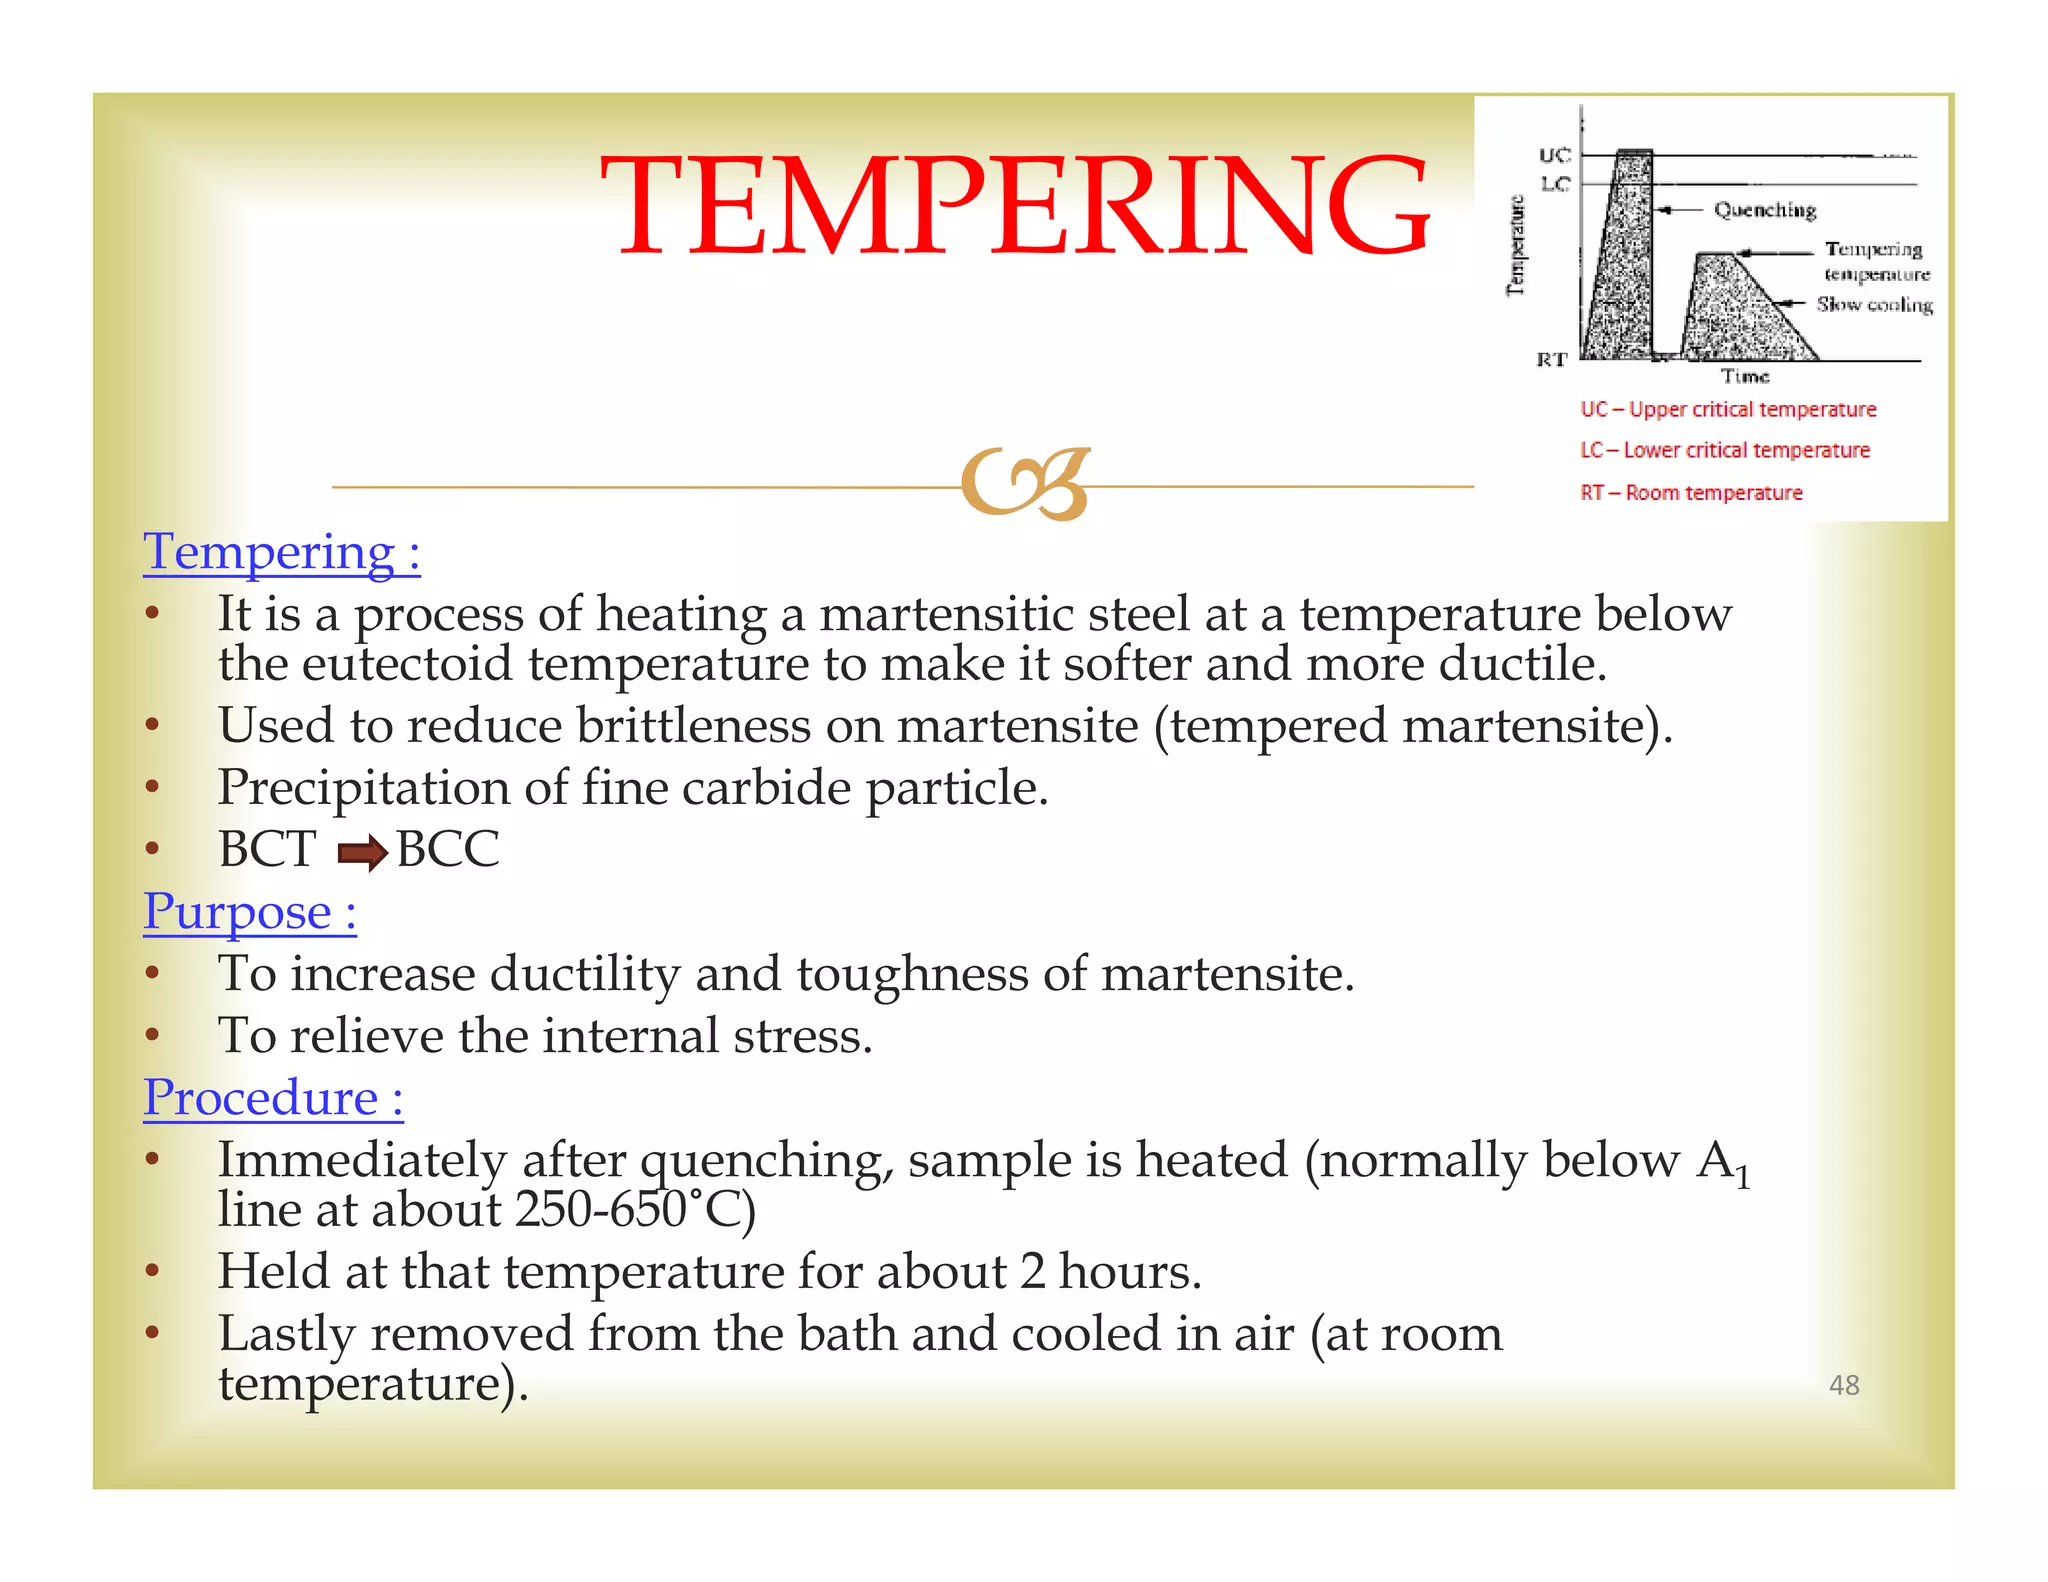
Purpose :
Utilized for low, medium & high carbon steels.
Full annealing is used to soften pieces which have been hardened by plastic
deformation, and which need to undergo subsequent machining/forming.
Process :
Heat the steel above the austenite temperature either 15-40˚C above line A3
[hypo] – to form austenite or line A1 [hyper] – to form austenite and
cementite phases.
Cool very slowly in furnace.
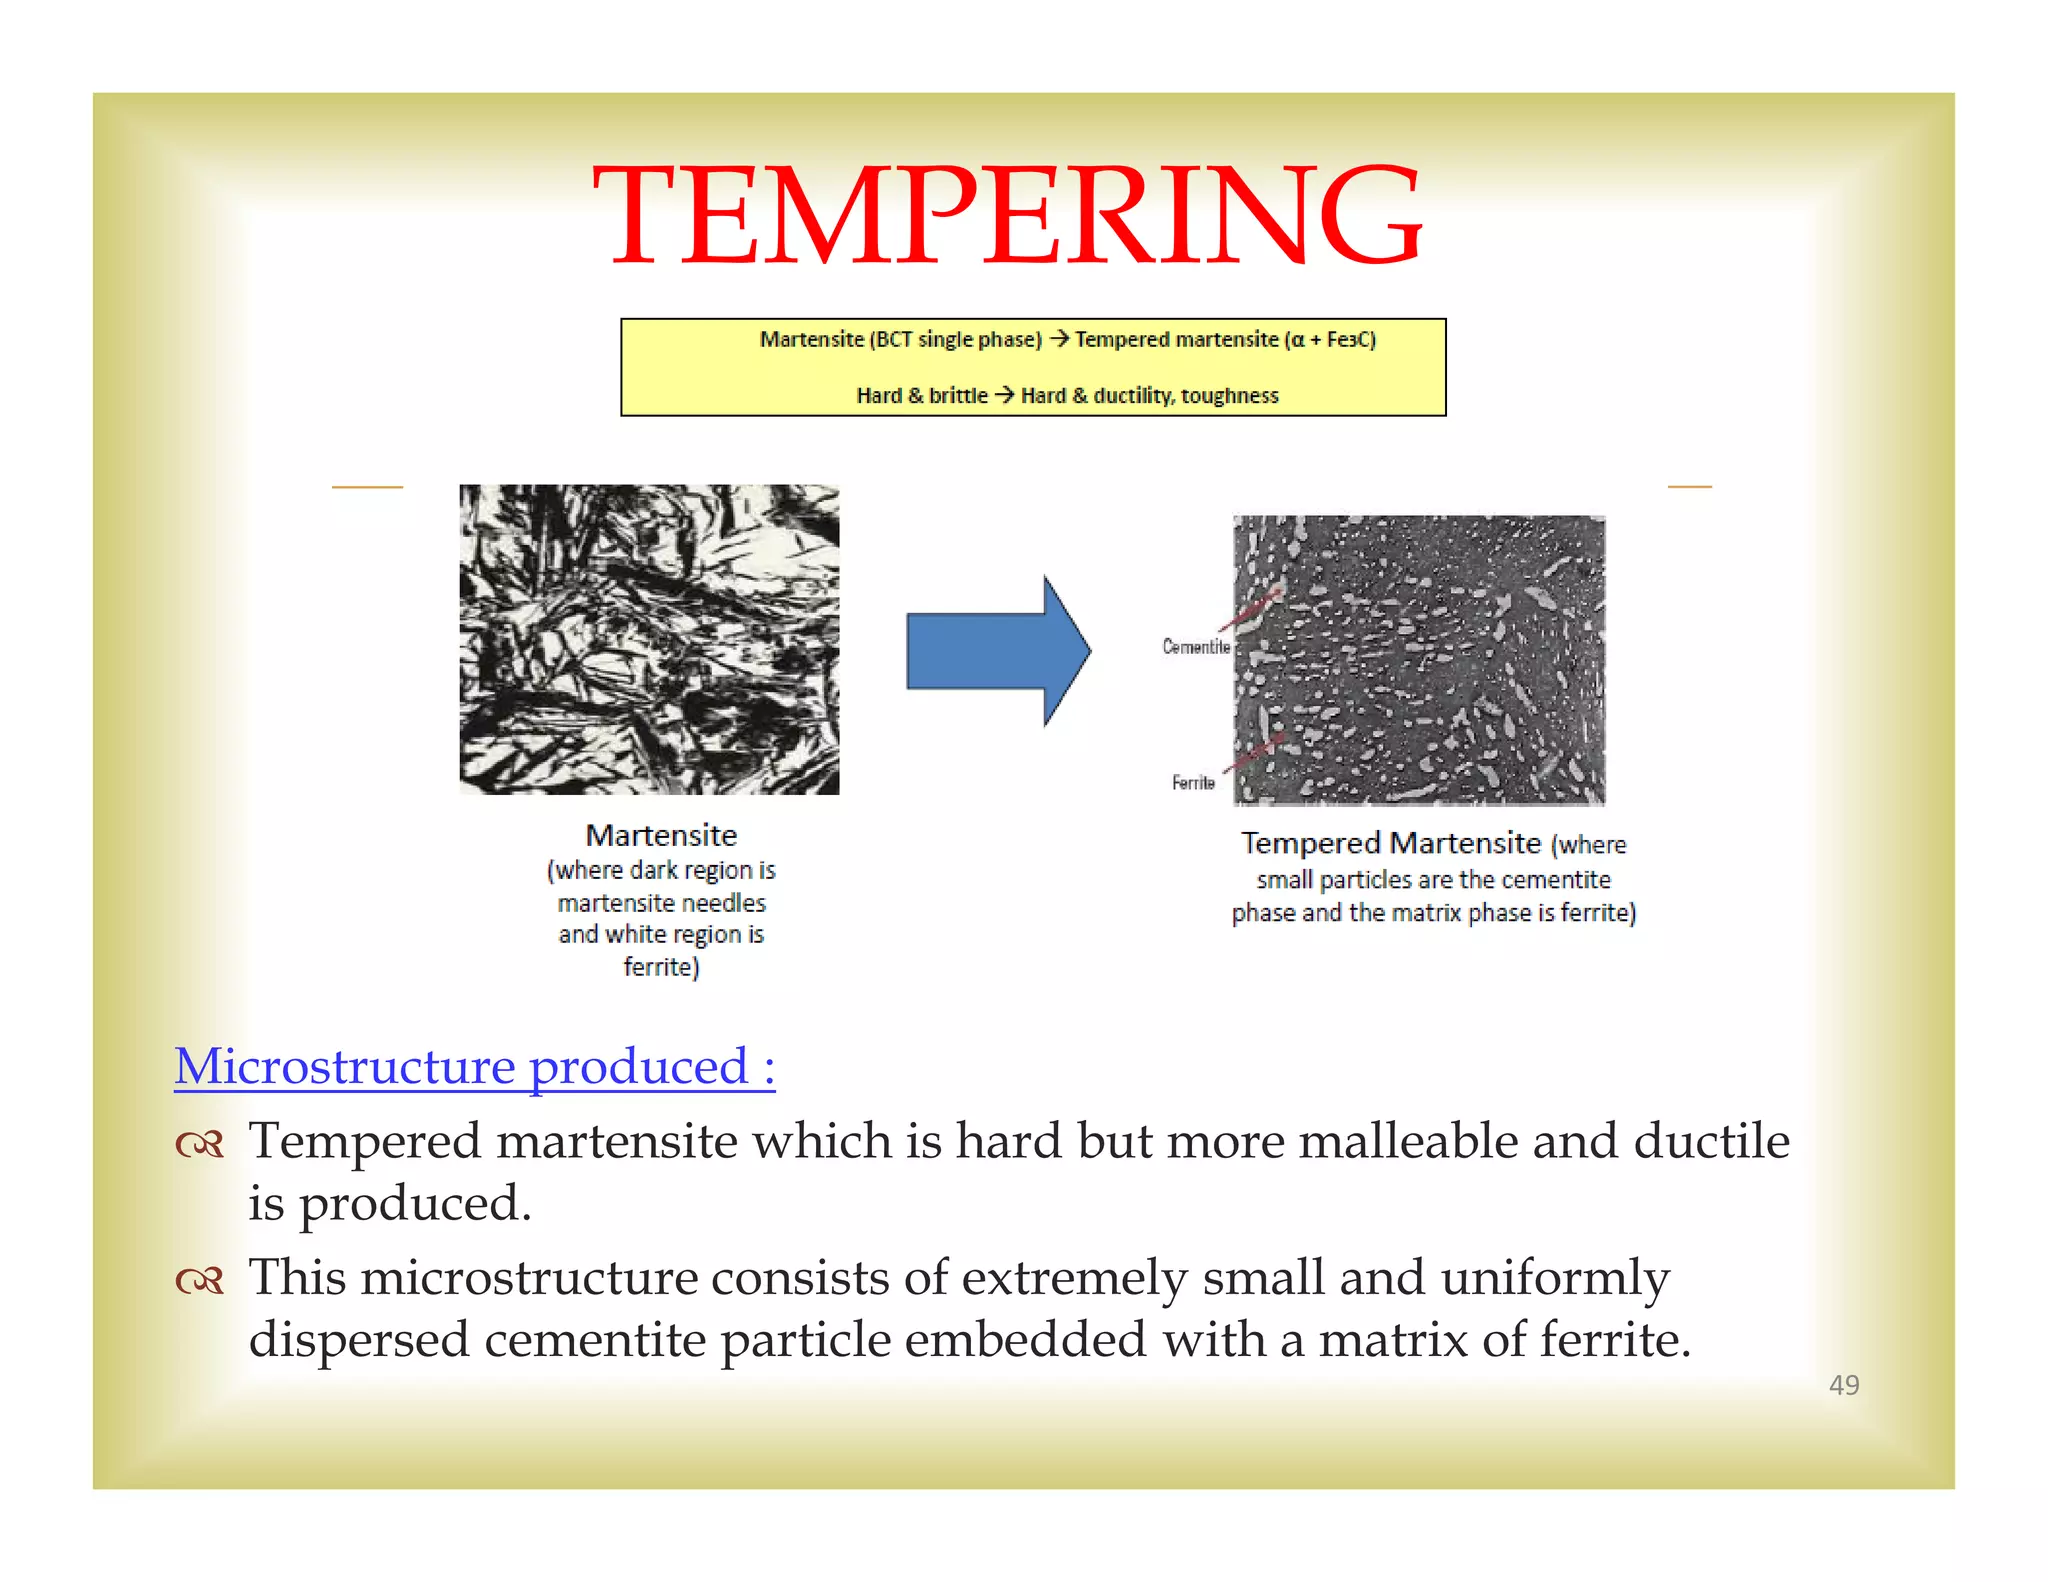
Microstructure produced :
Coarse pearlite that will give soft and ductility properties. 36
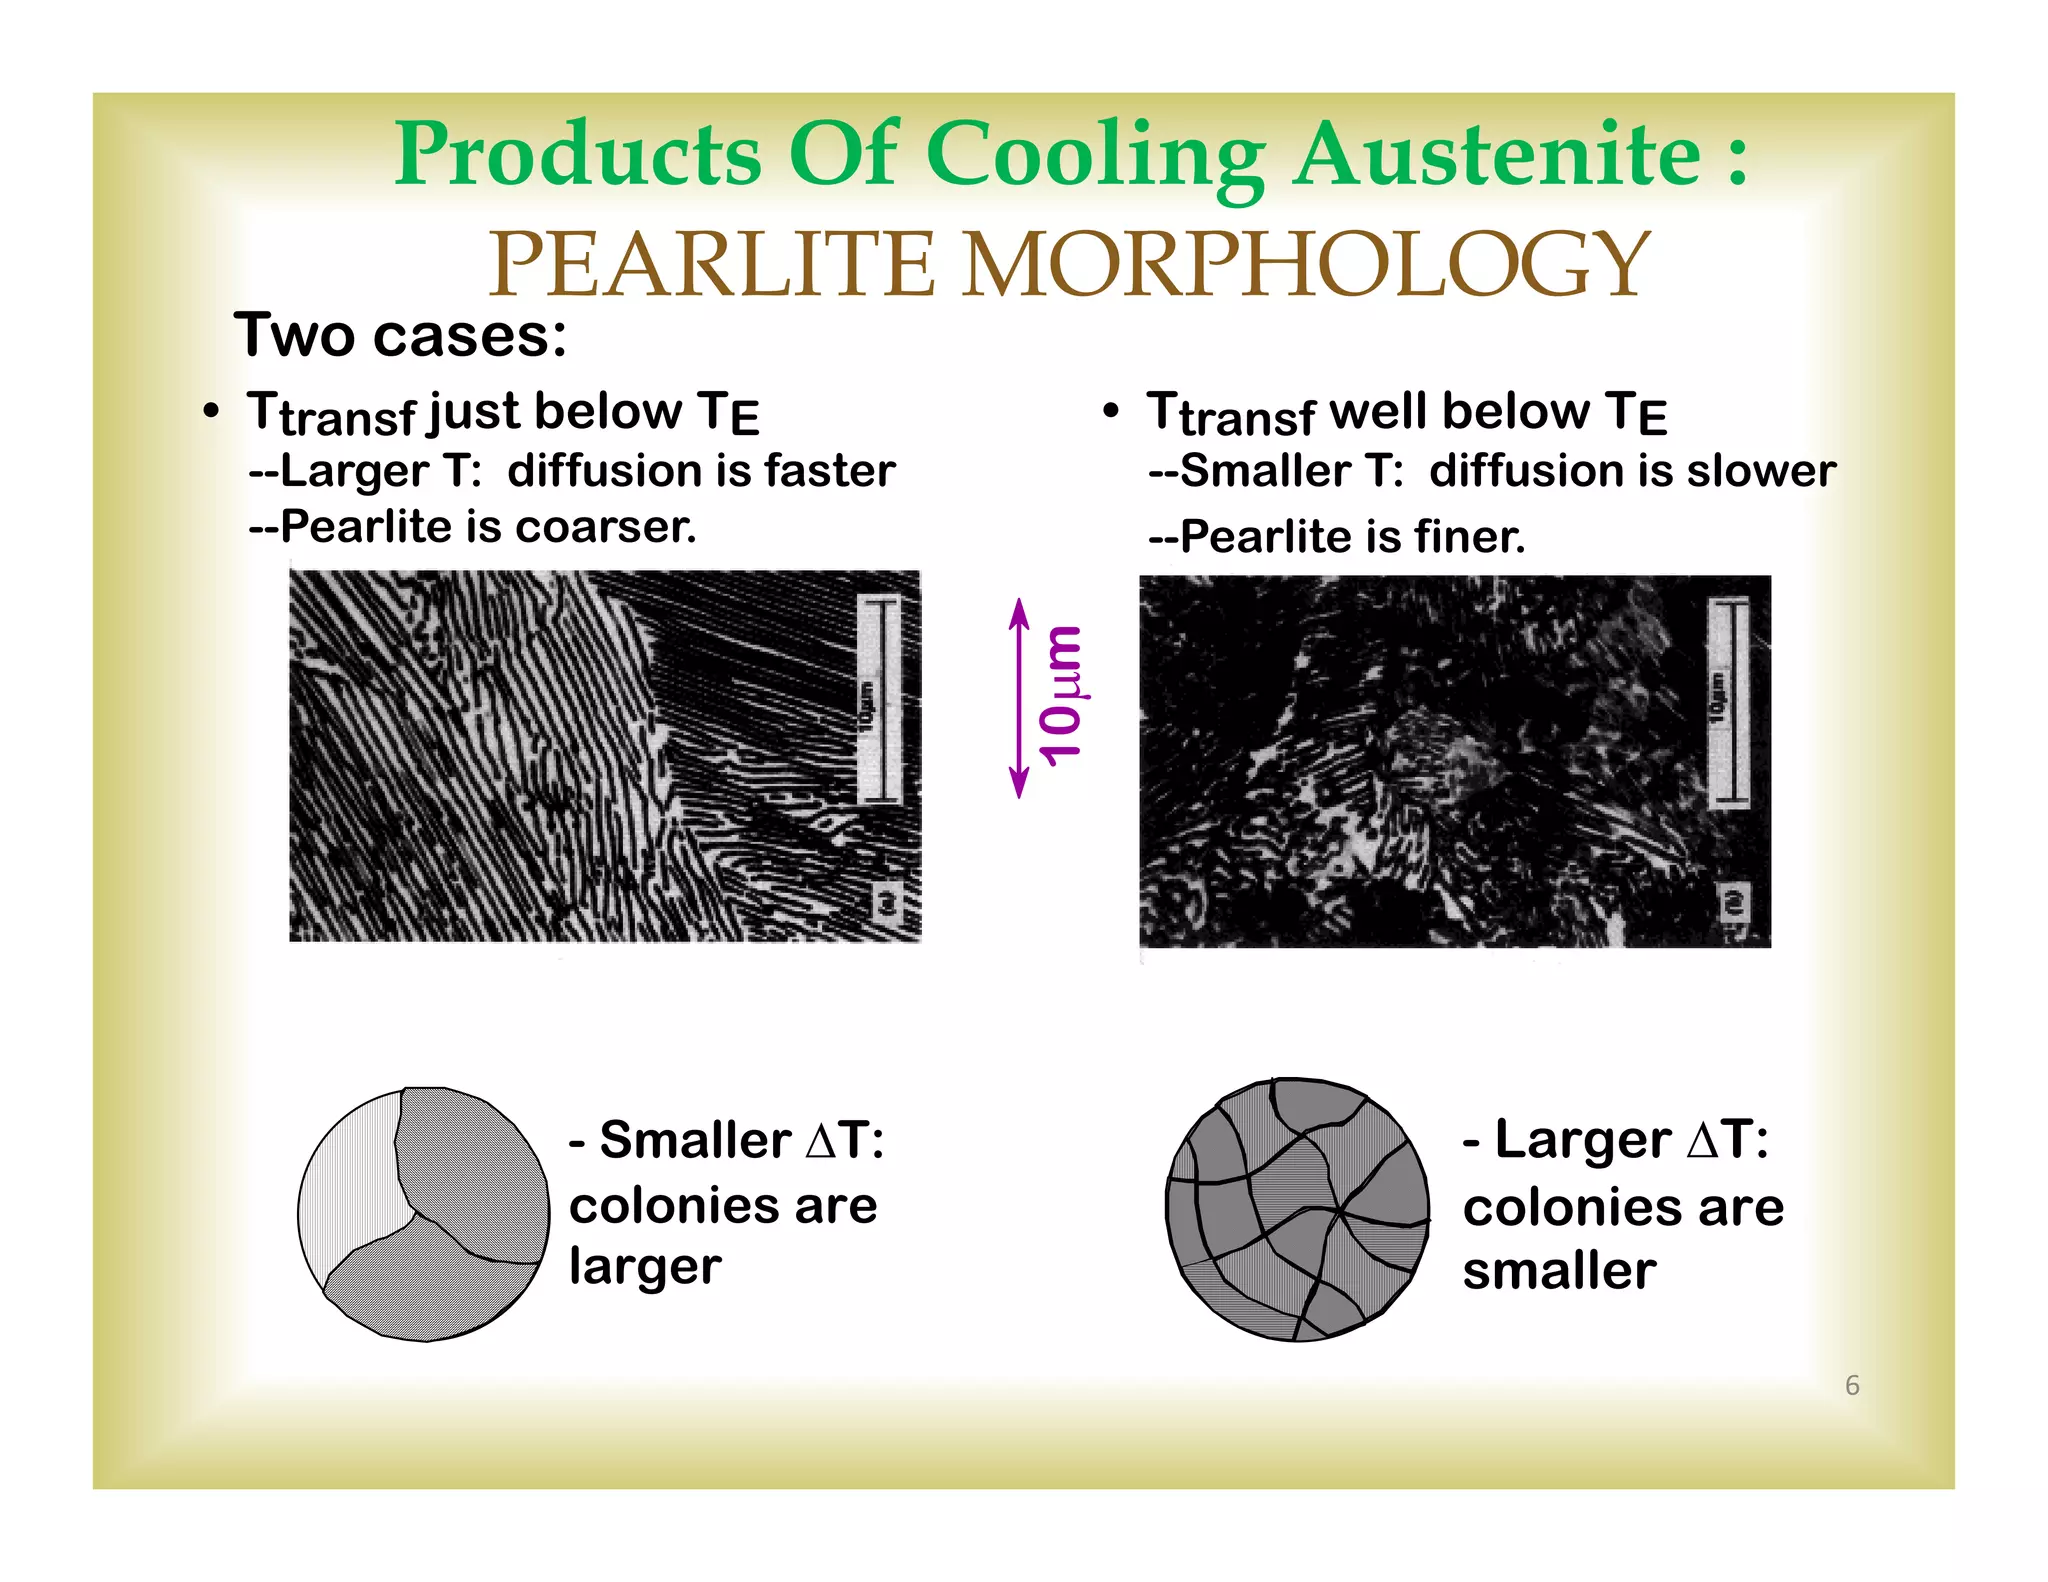
(ii) FULL ANNEAL](https://image.slidesharecdn.com/9cztb0vaqk6kf4x1vwe8-signature-d98e614c44bb5d5fcfc79eb5ed8fdbf00bc1e22d961d7a0f5fed49408756051c-poli-140724113841-phpapp02/75/Mec281-lecture-341-2048.jpg)
![
Process :
• Heat the steel above the austenite temperature (either 55-80˚C above line A3
[hypo] or line ACM [hyper]) .
• After sufficient time has been allowed for the alloy to completely transform
to austenite - austenitizing
• Removed from the furnace and cool it in air (at room temperature).
Microstructure produced :
Fine pearlite (due to faster cooling rate) will give toughness properties &
acceptable softness to the metal.
Properties :
Faster cooling provides higher strength and hardness but lower ductility if
compared to full annealing.
38
NORMALIZING
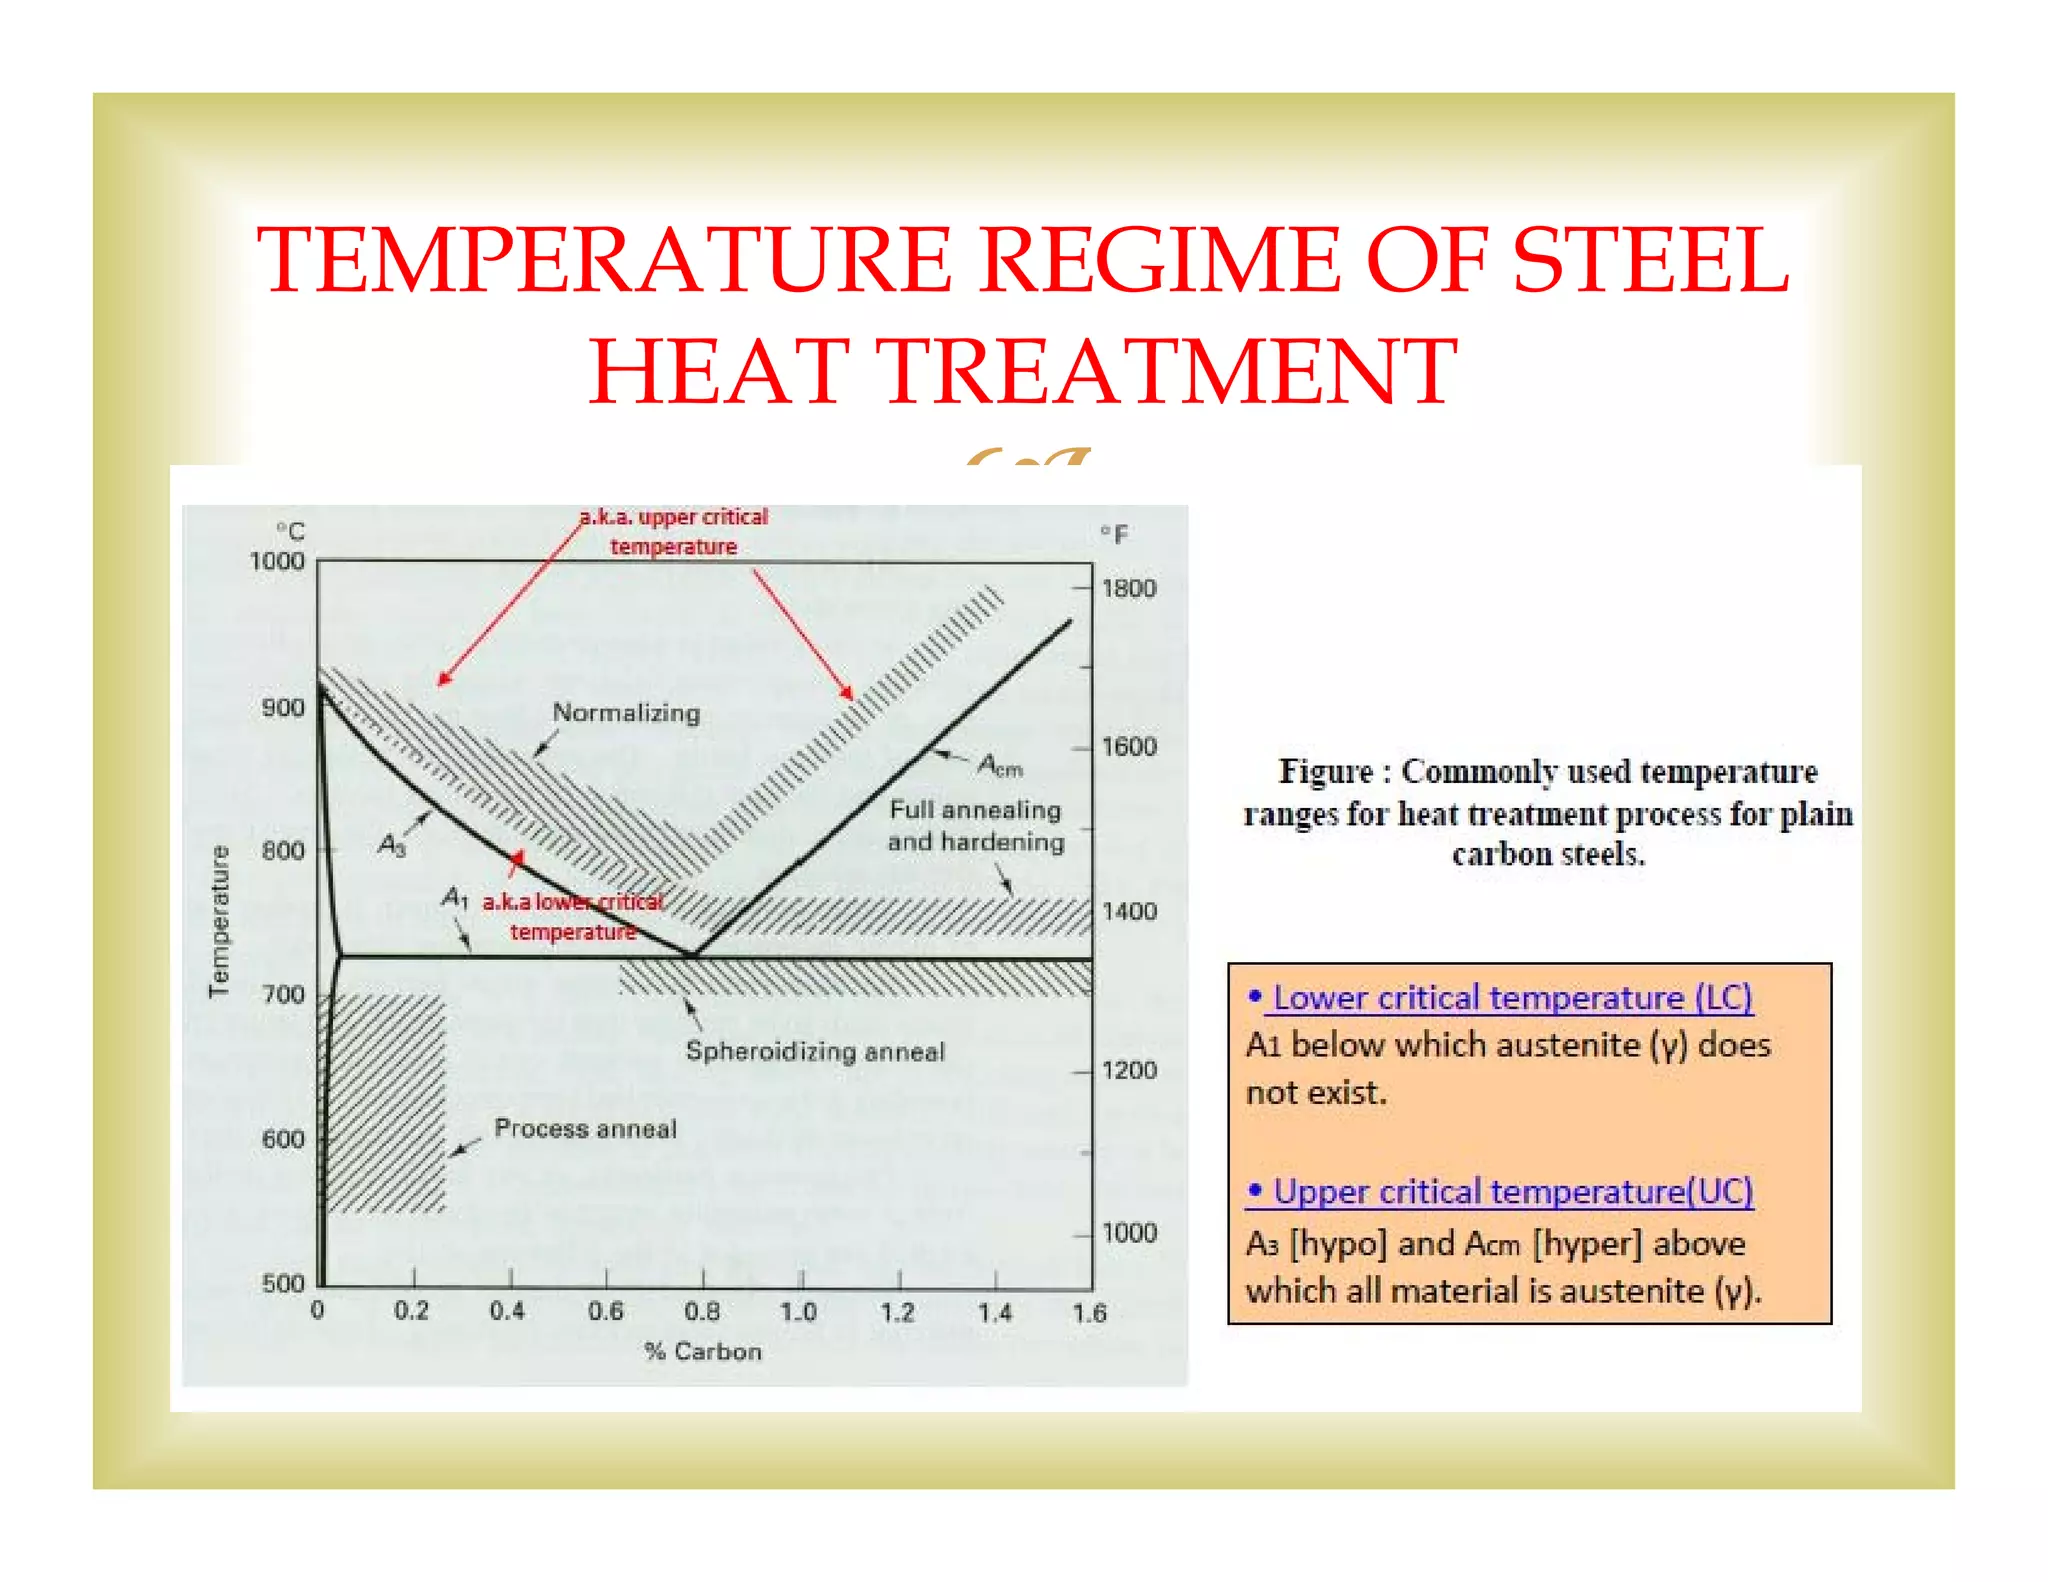
UC‐Upper critical temperature
LC‐Lower critical temperature
RT‐Room temperature](https://image.slidesharecdn.com/9cztb0vaqk6kf4x1vwe8-signature-d98e614c44bb5d5fcfc79eb5ed8fdbf00bc1e22d961d7a0f5fed49408756051c-poli-140724113841-phpapp02/75/Mec281-lecture-343-2048.jpg)
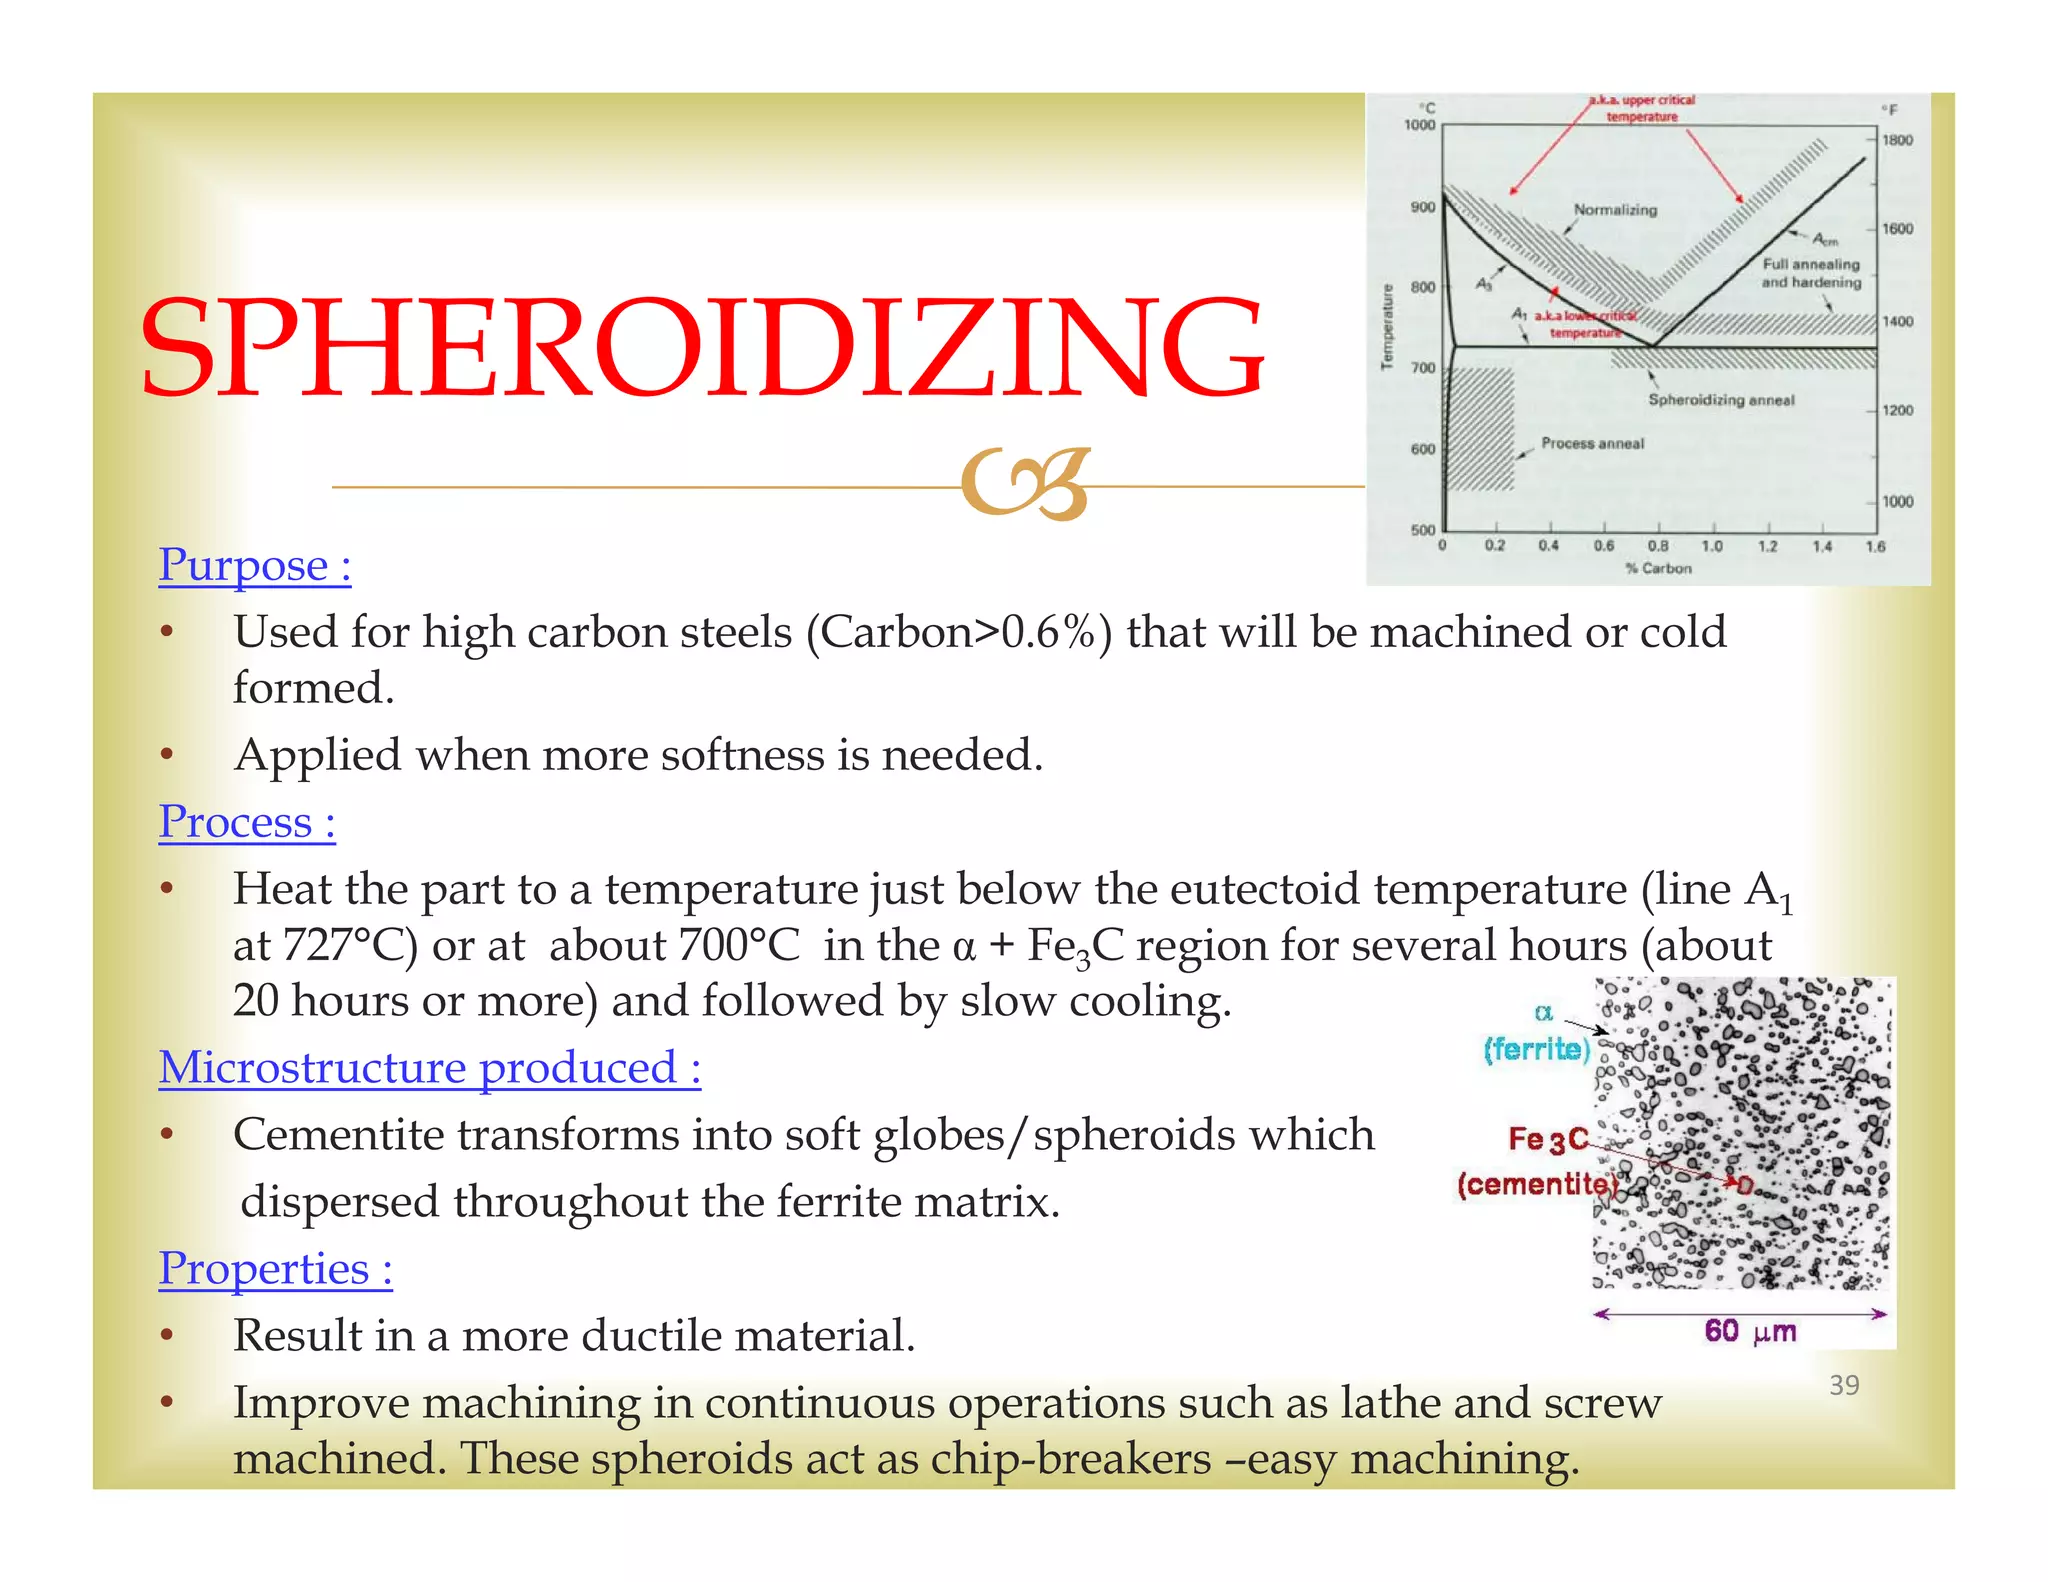
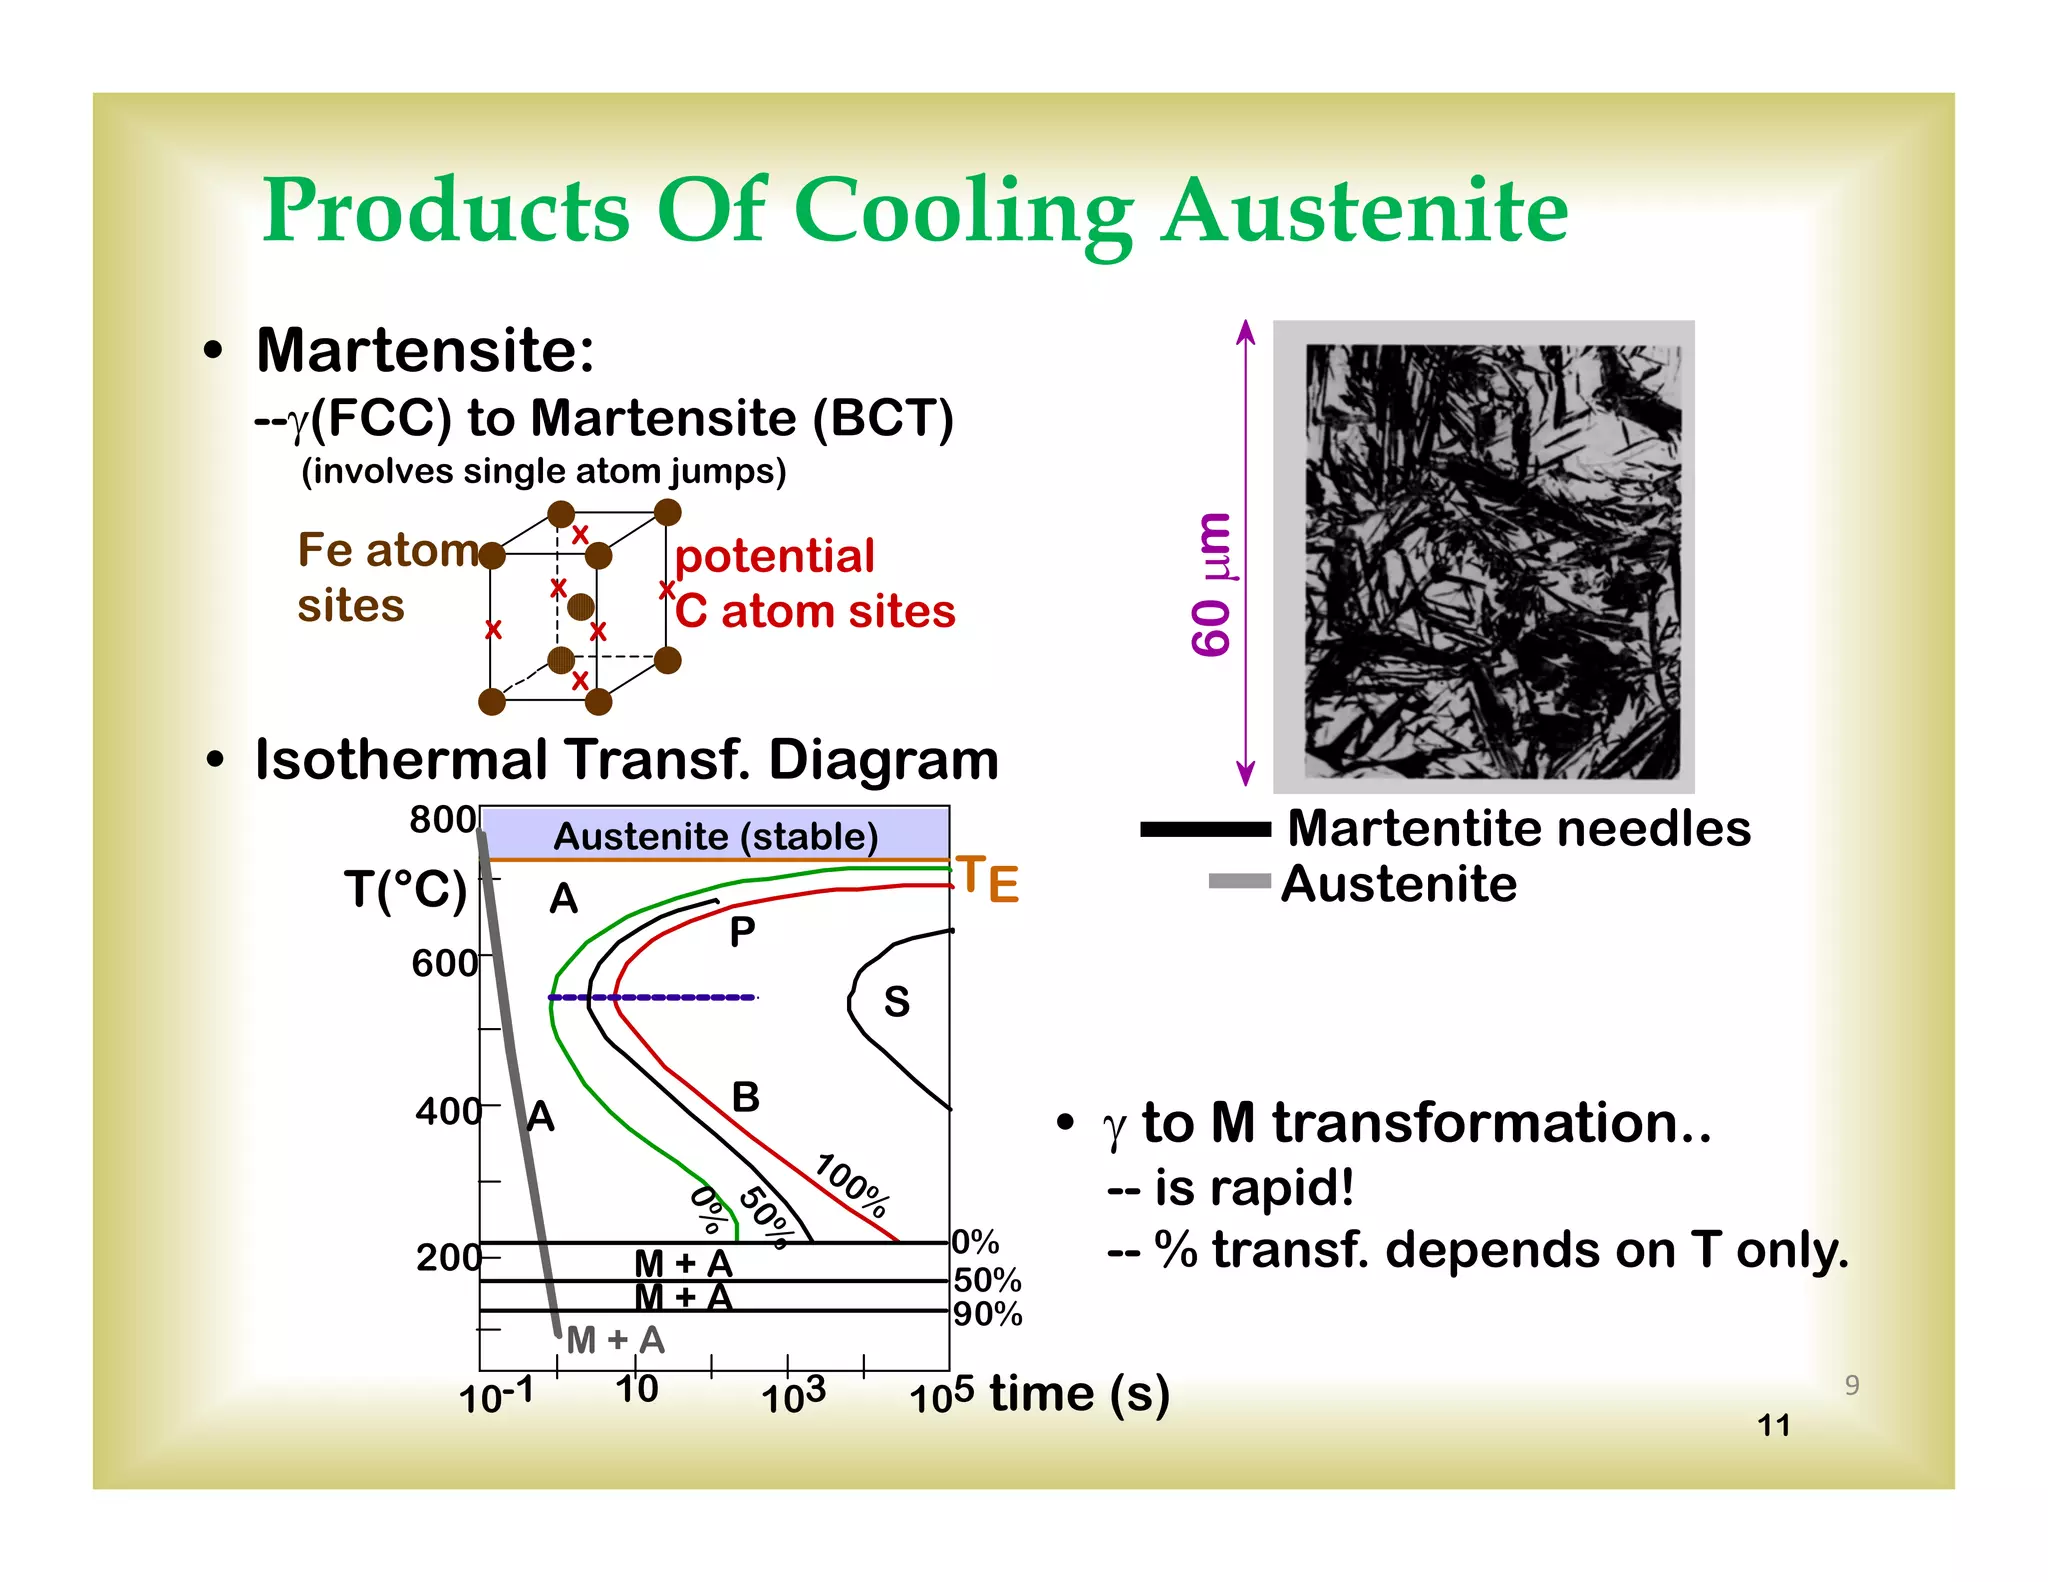
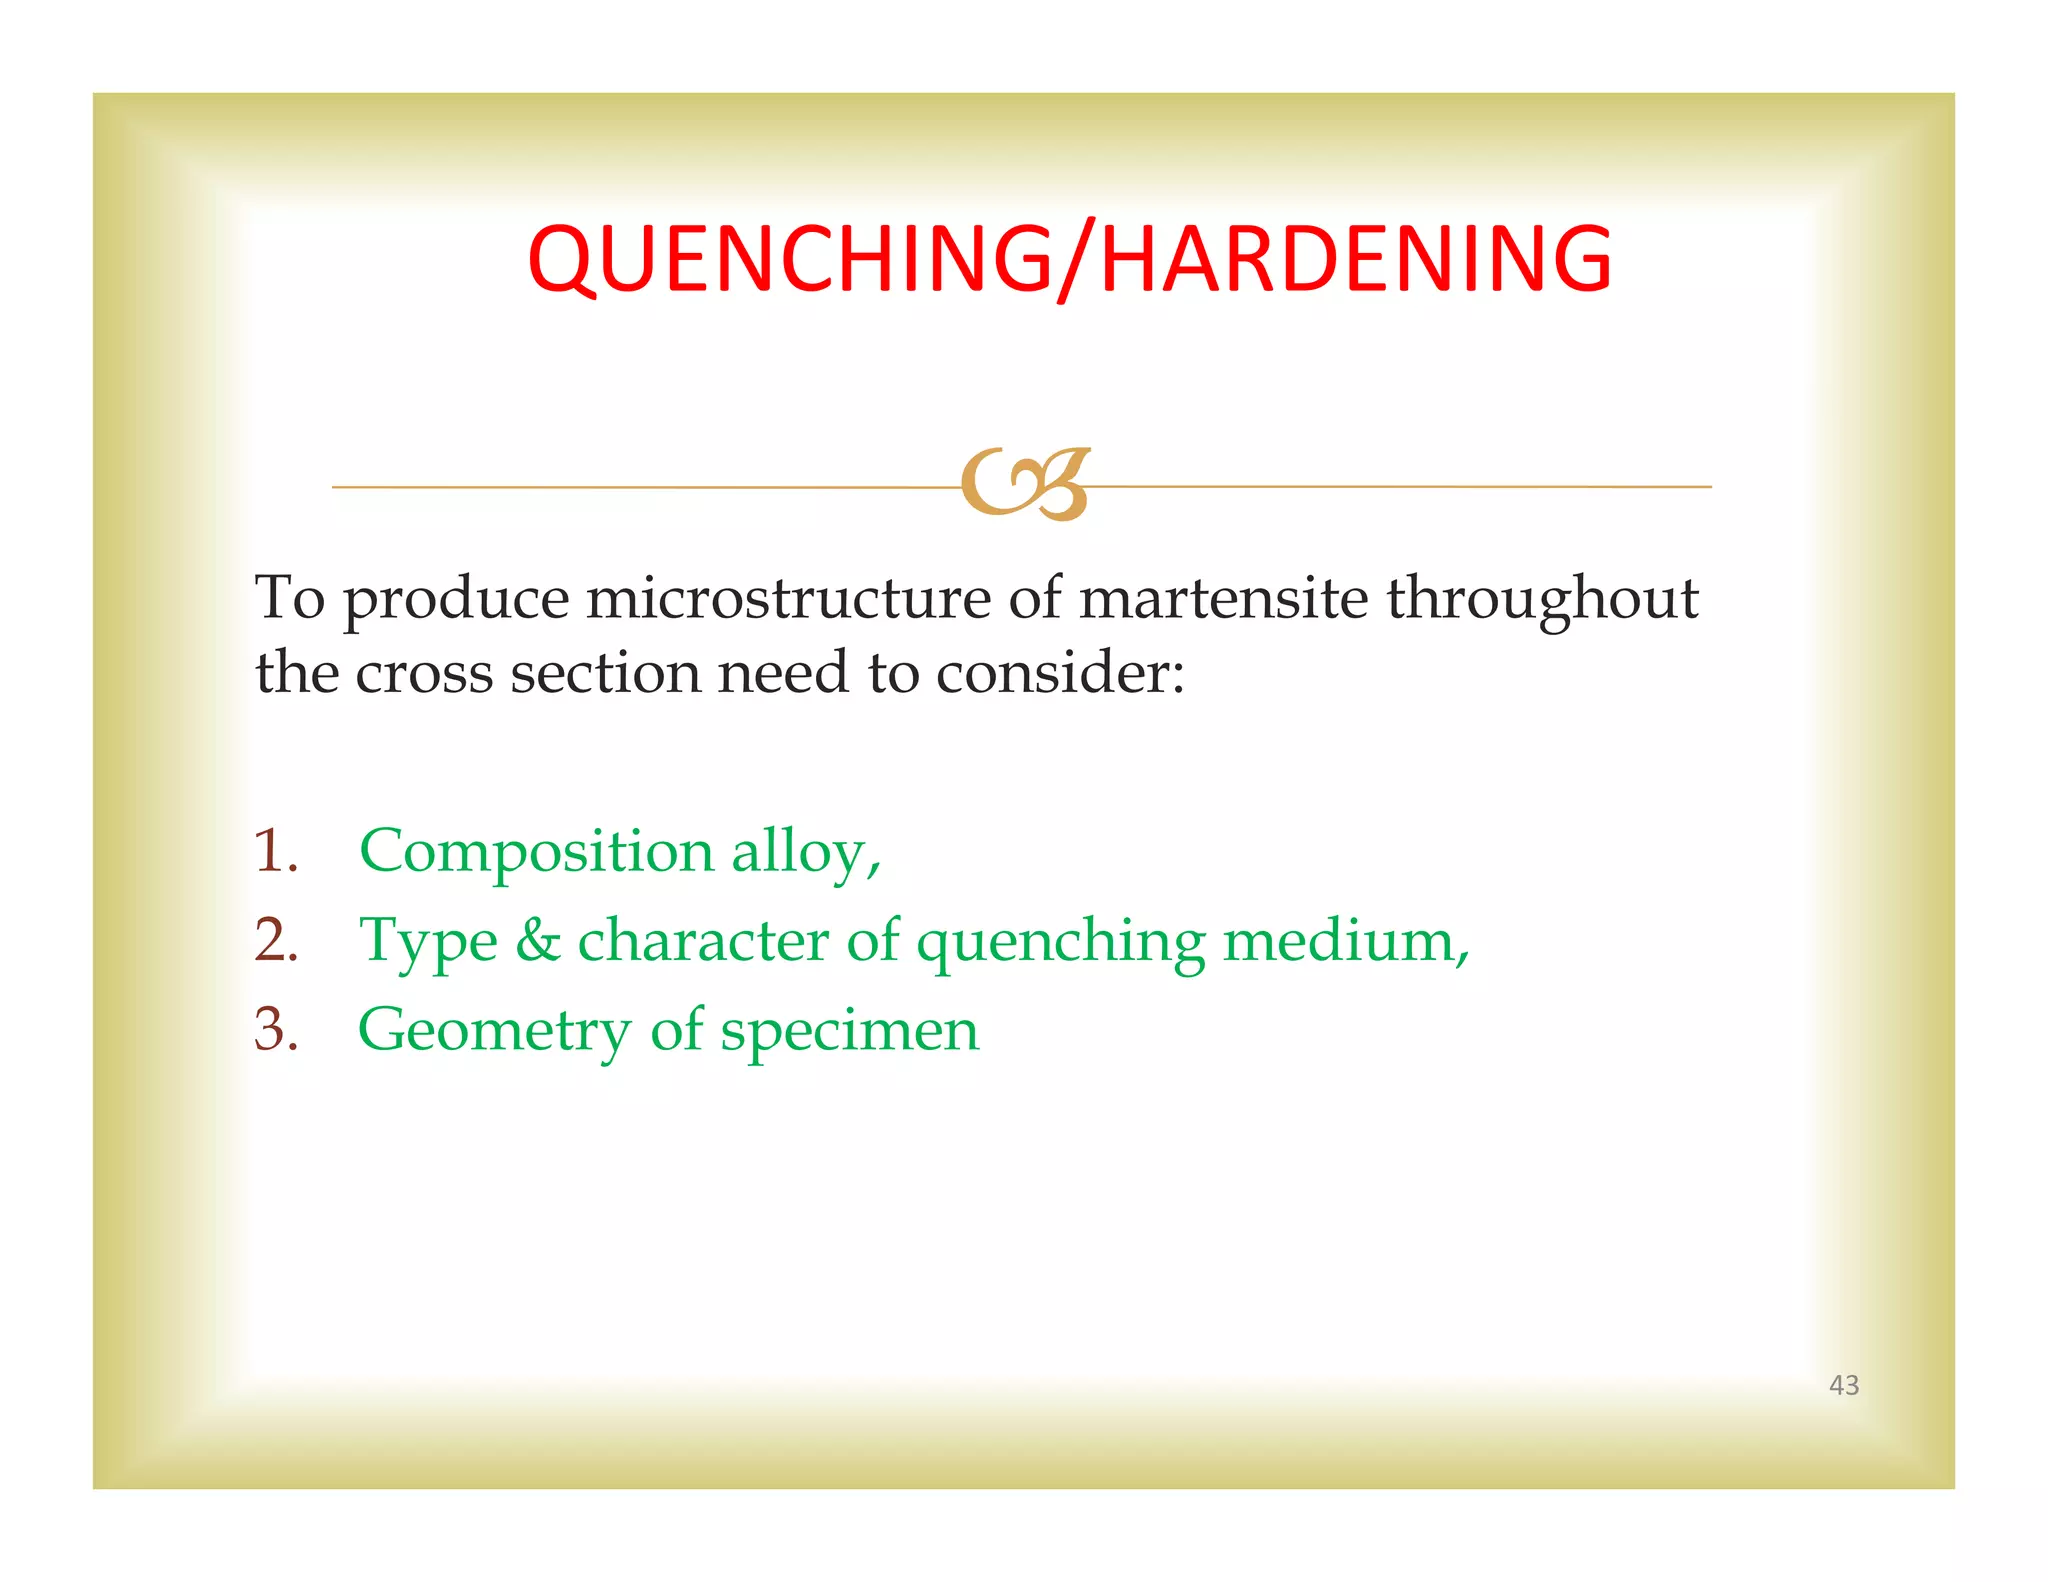
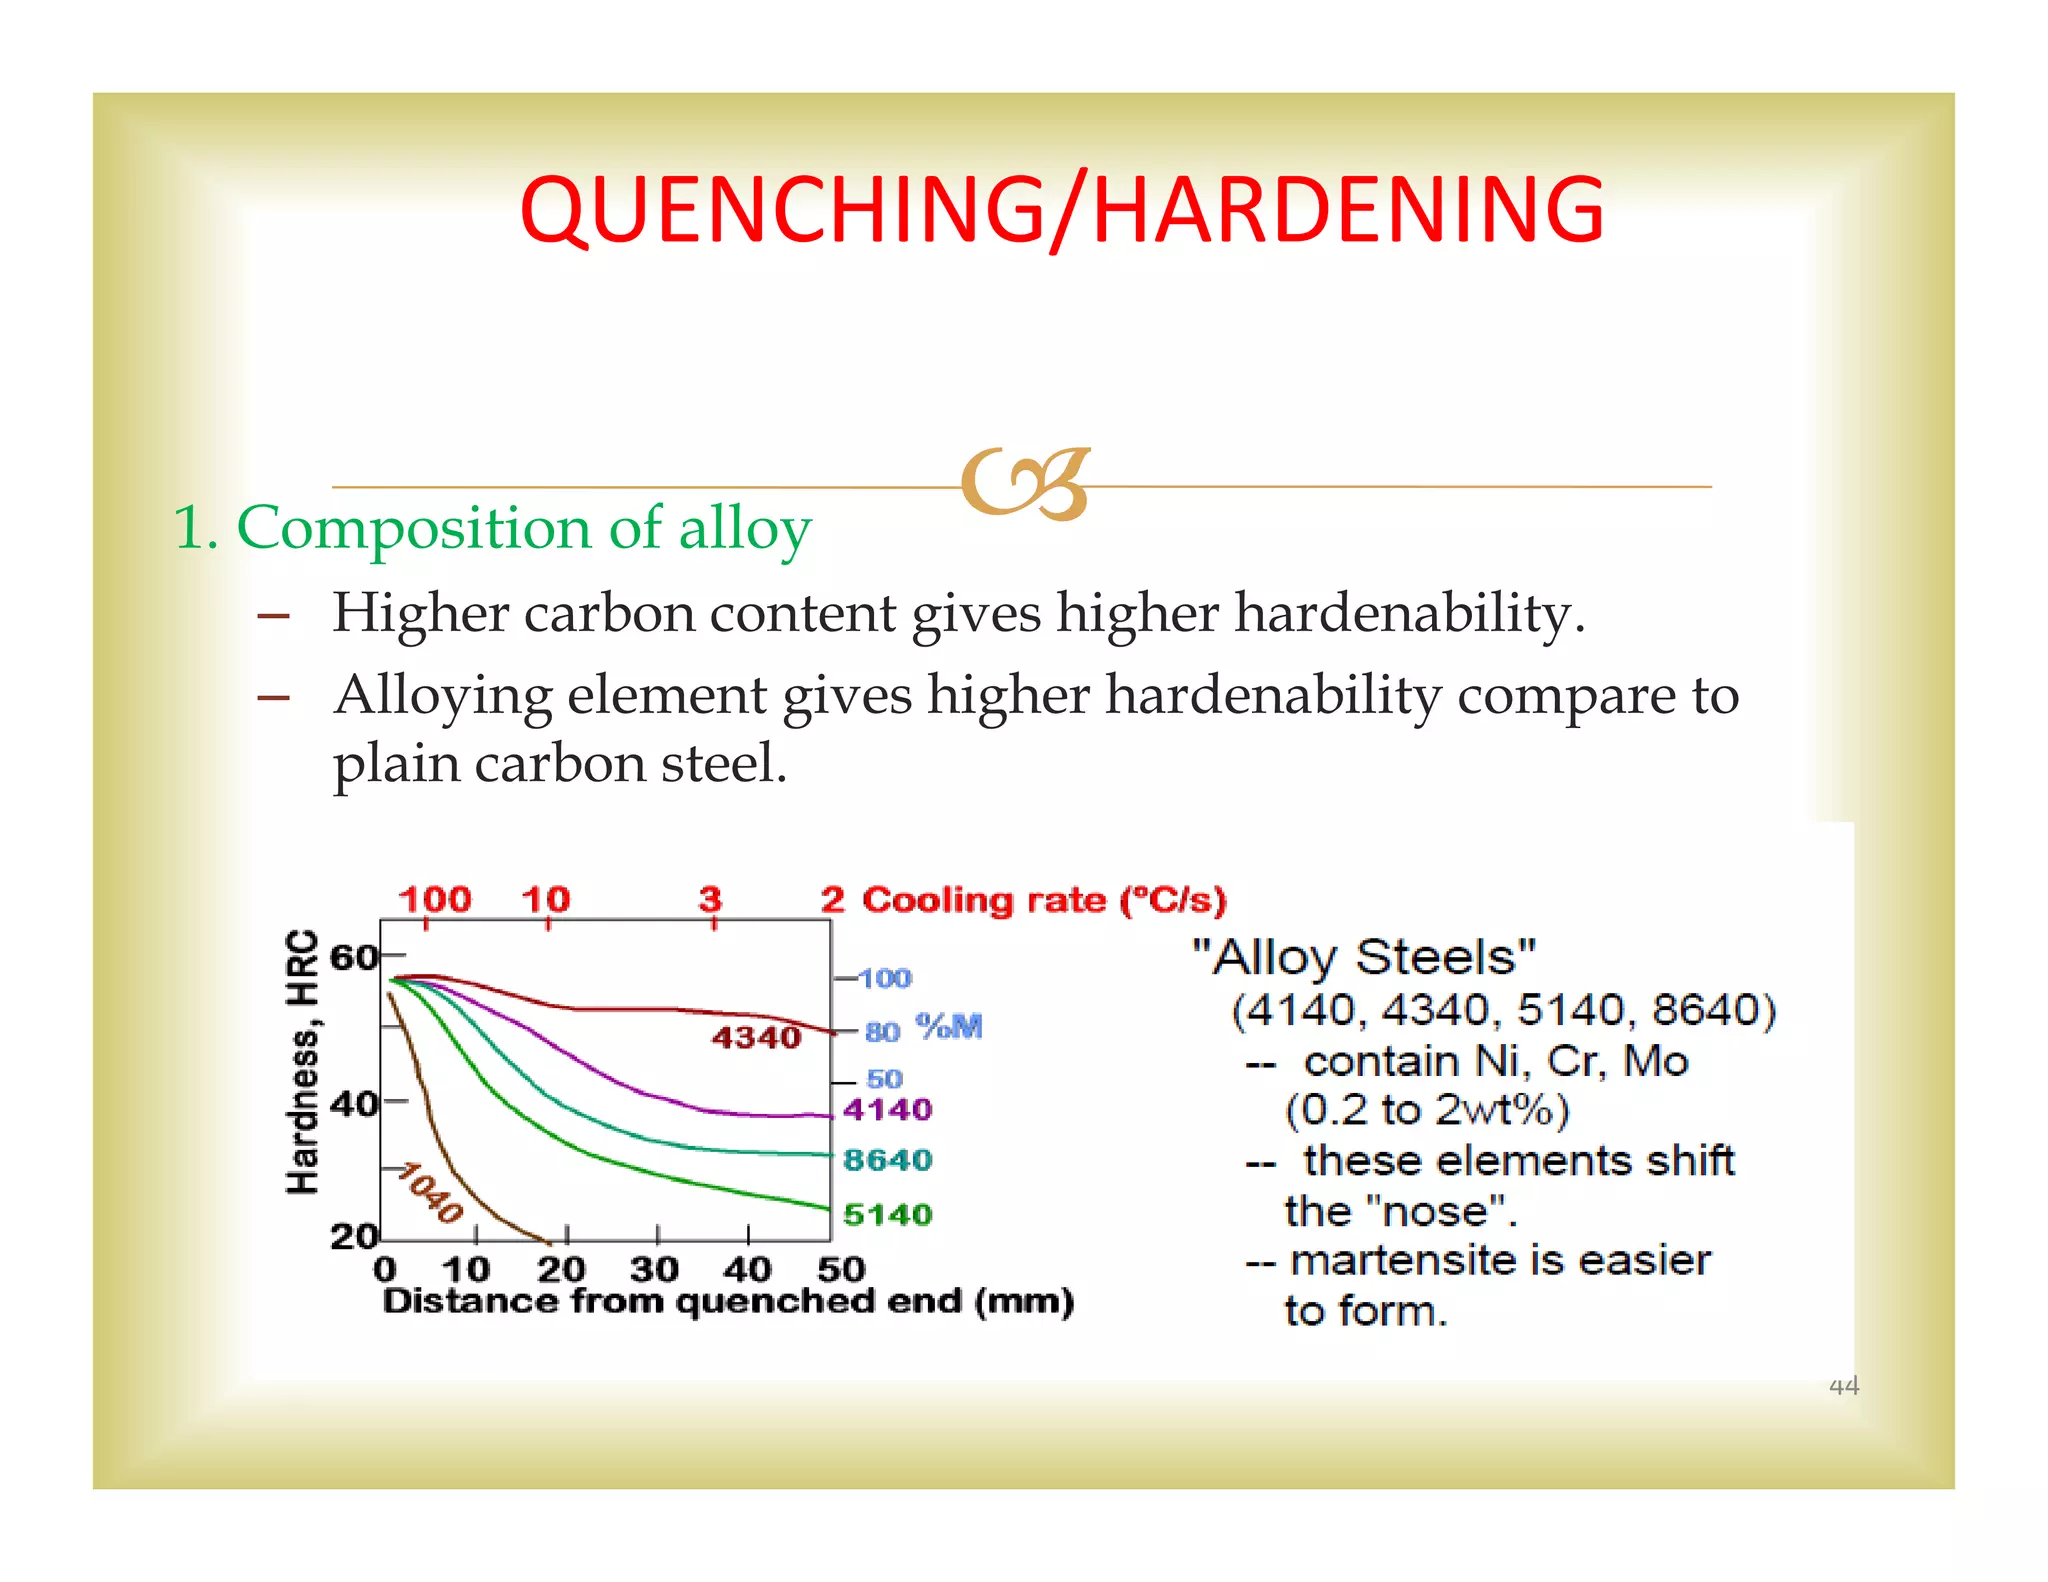
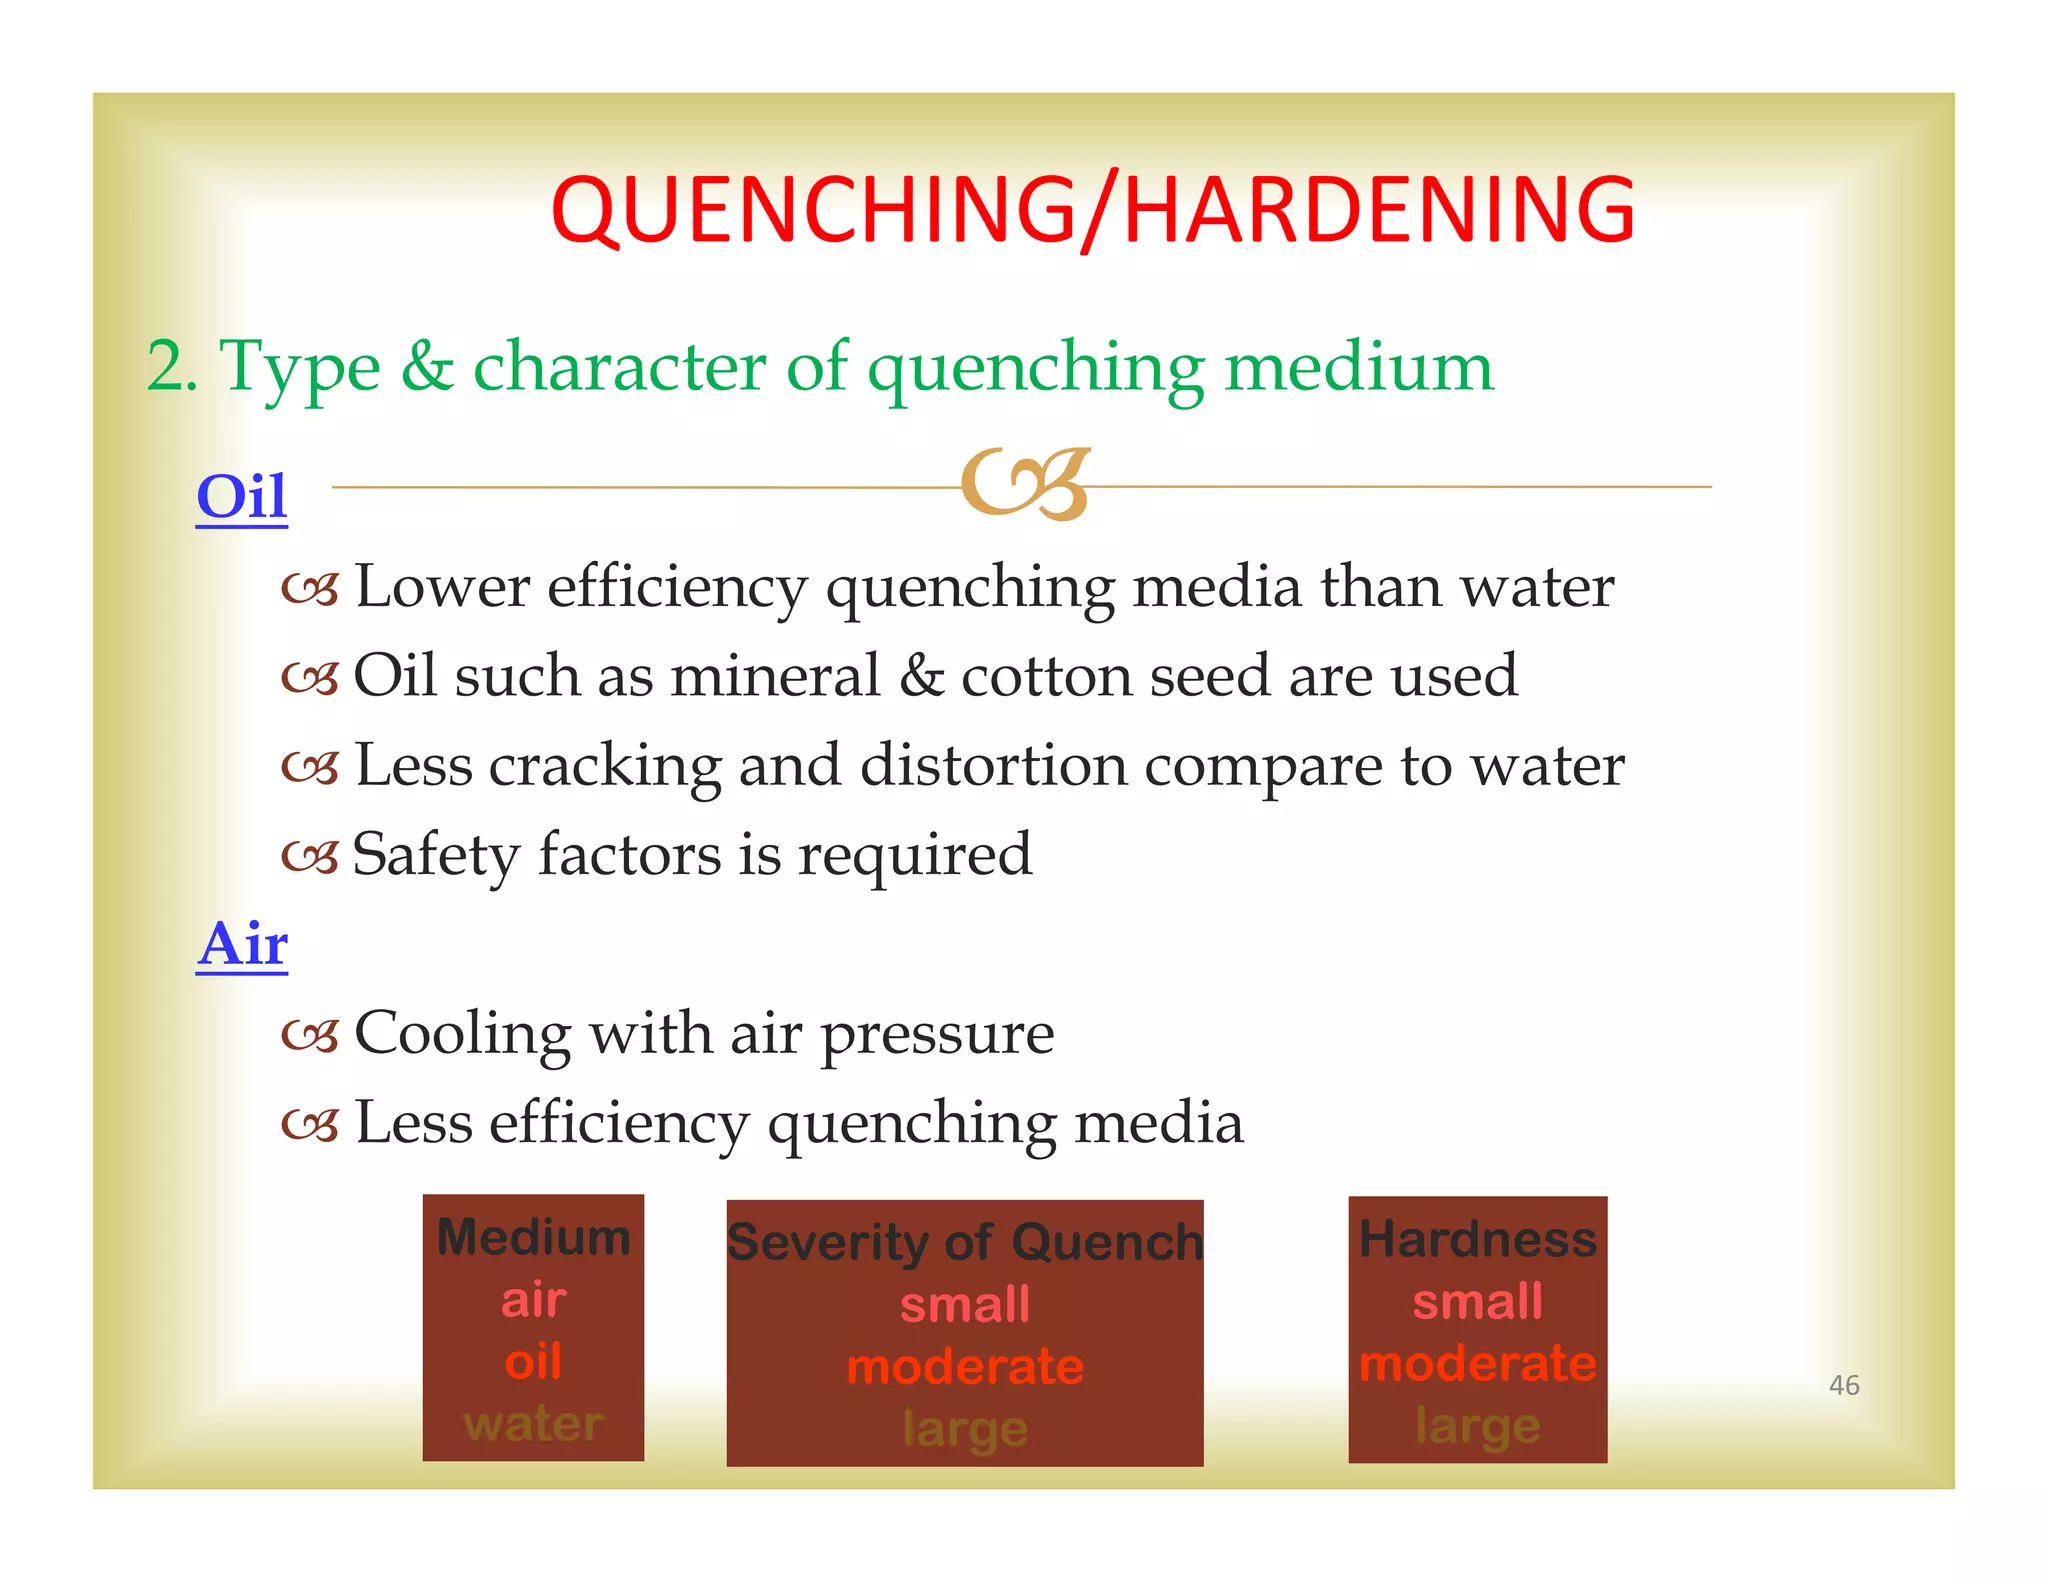
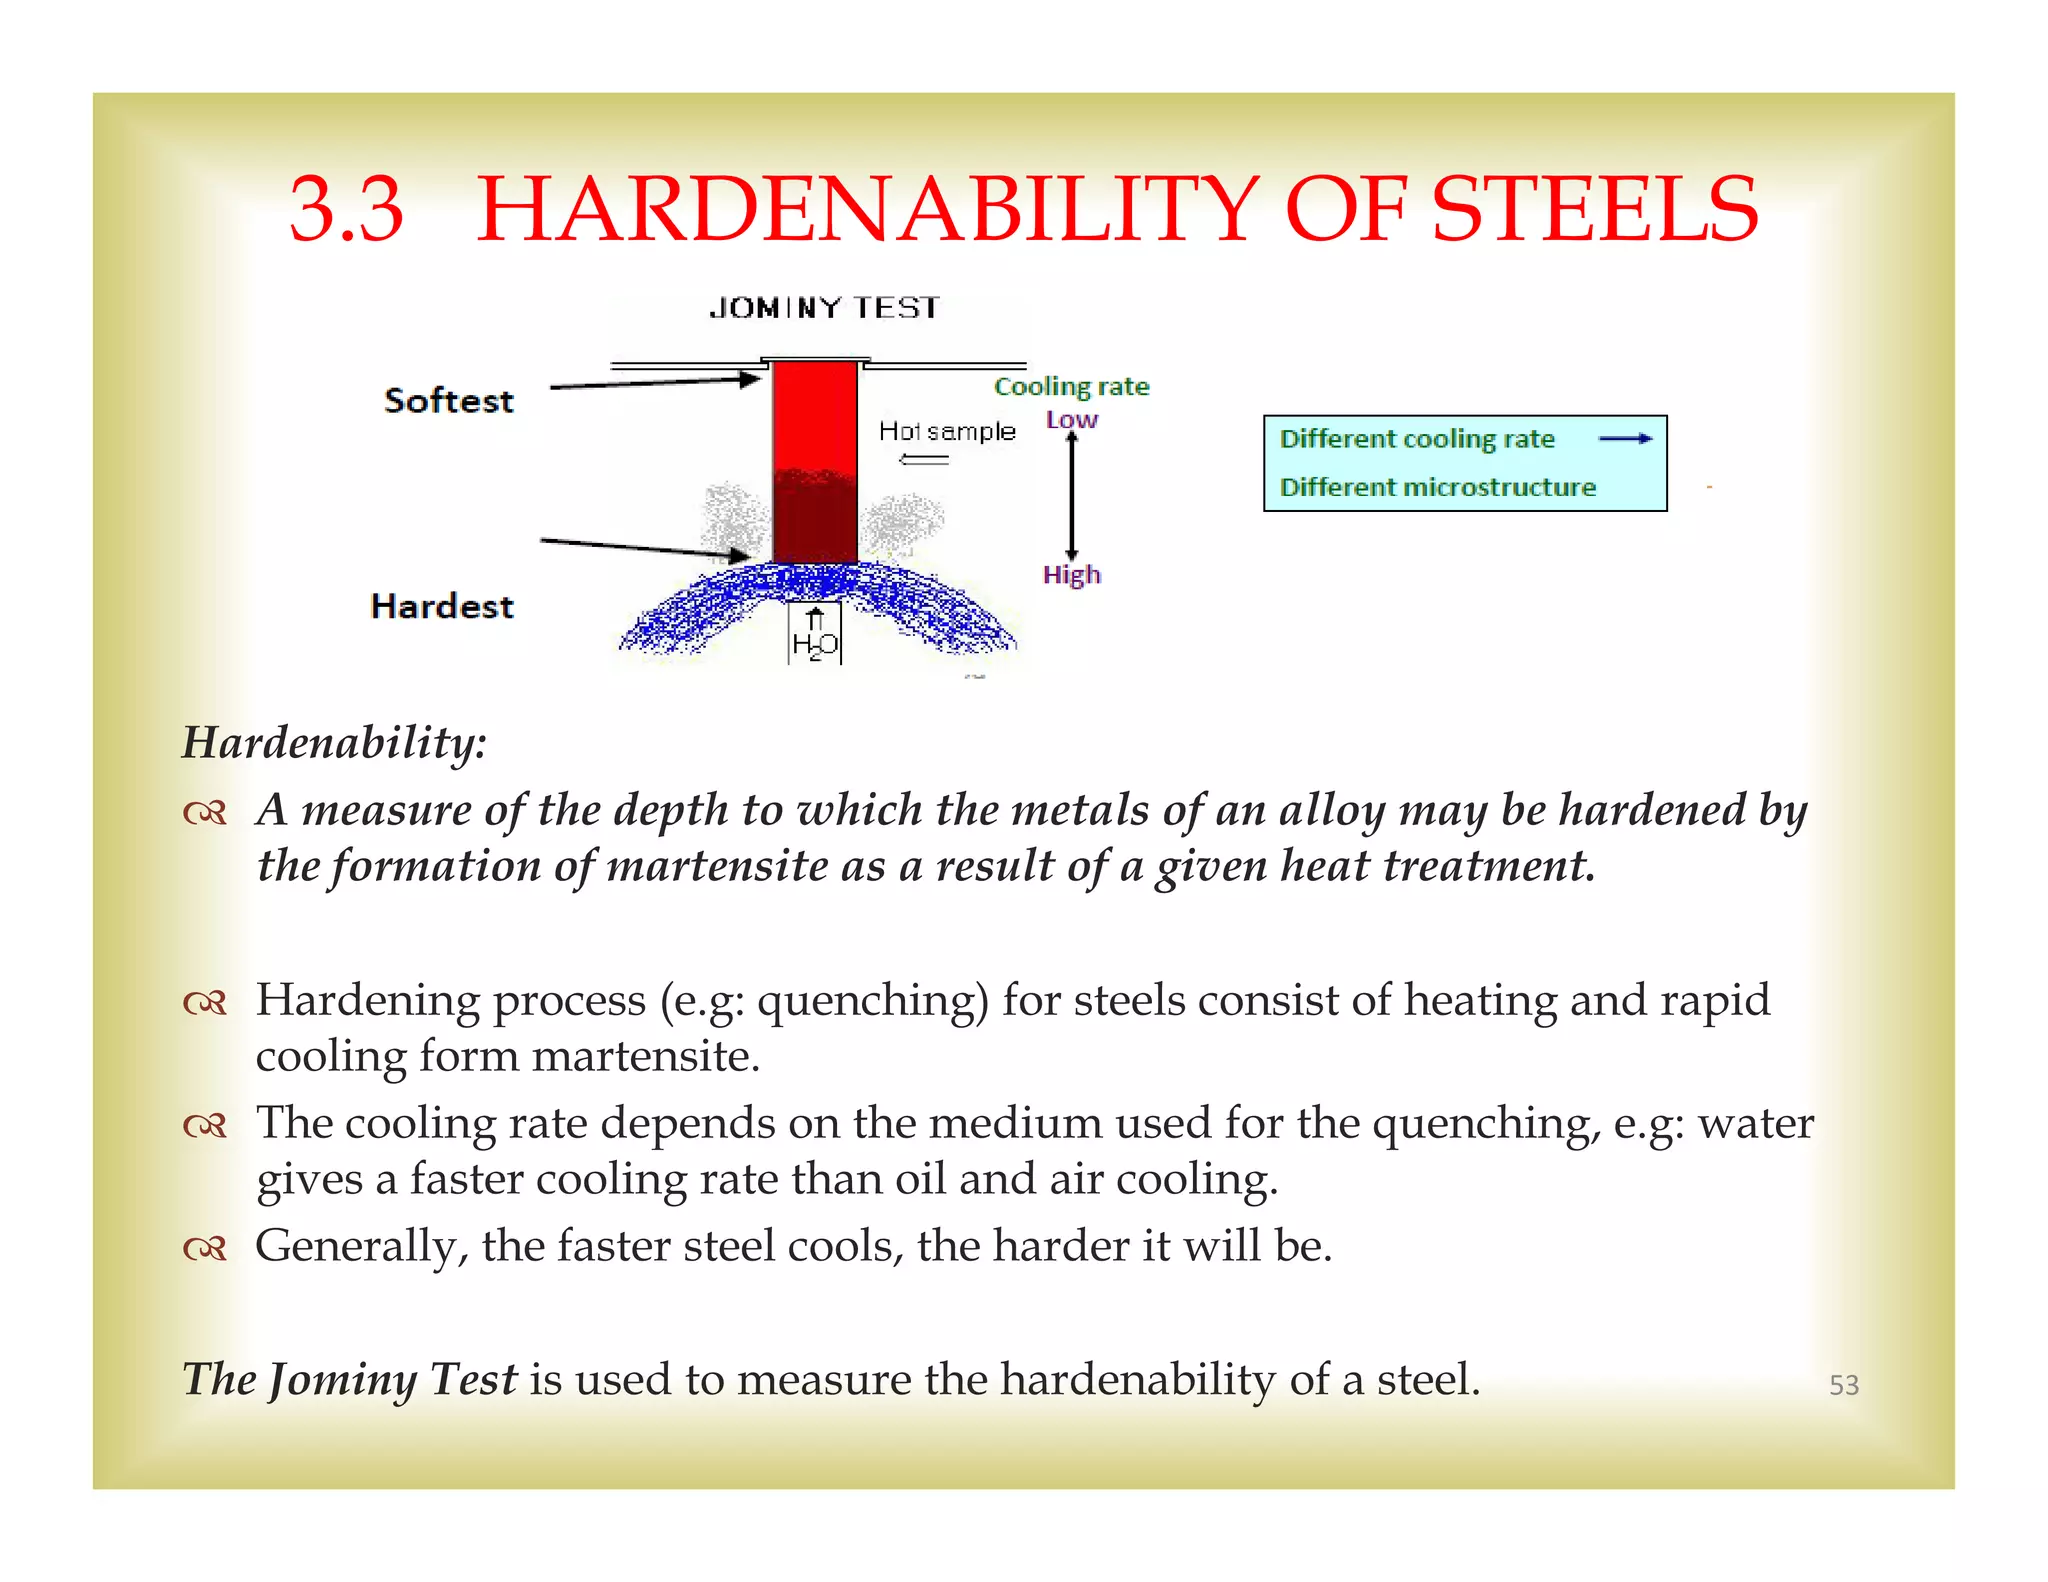
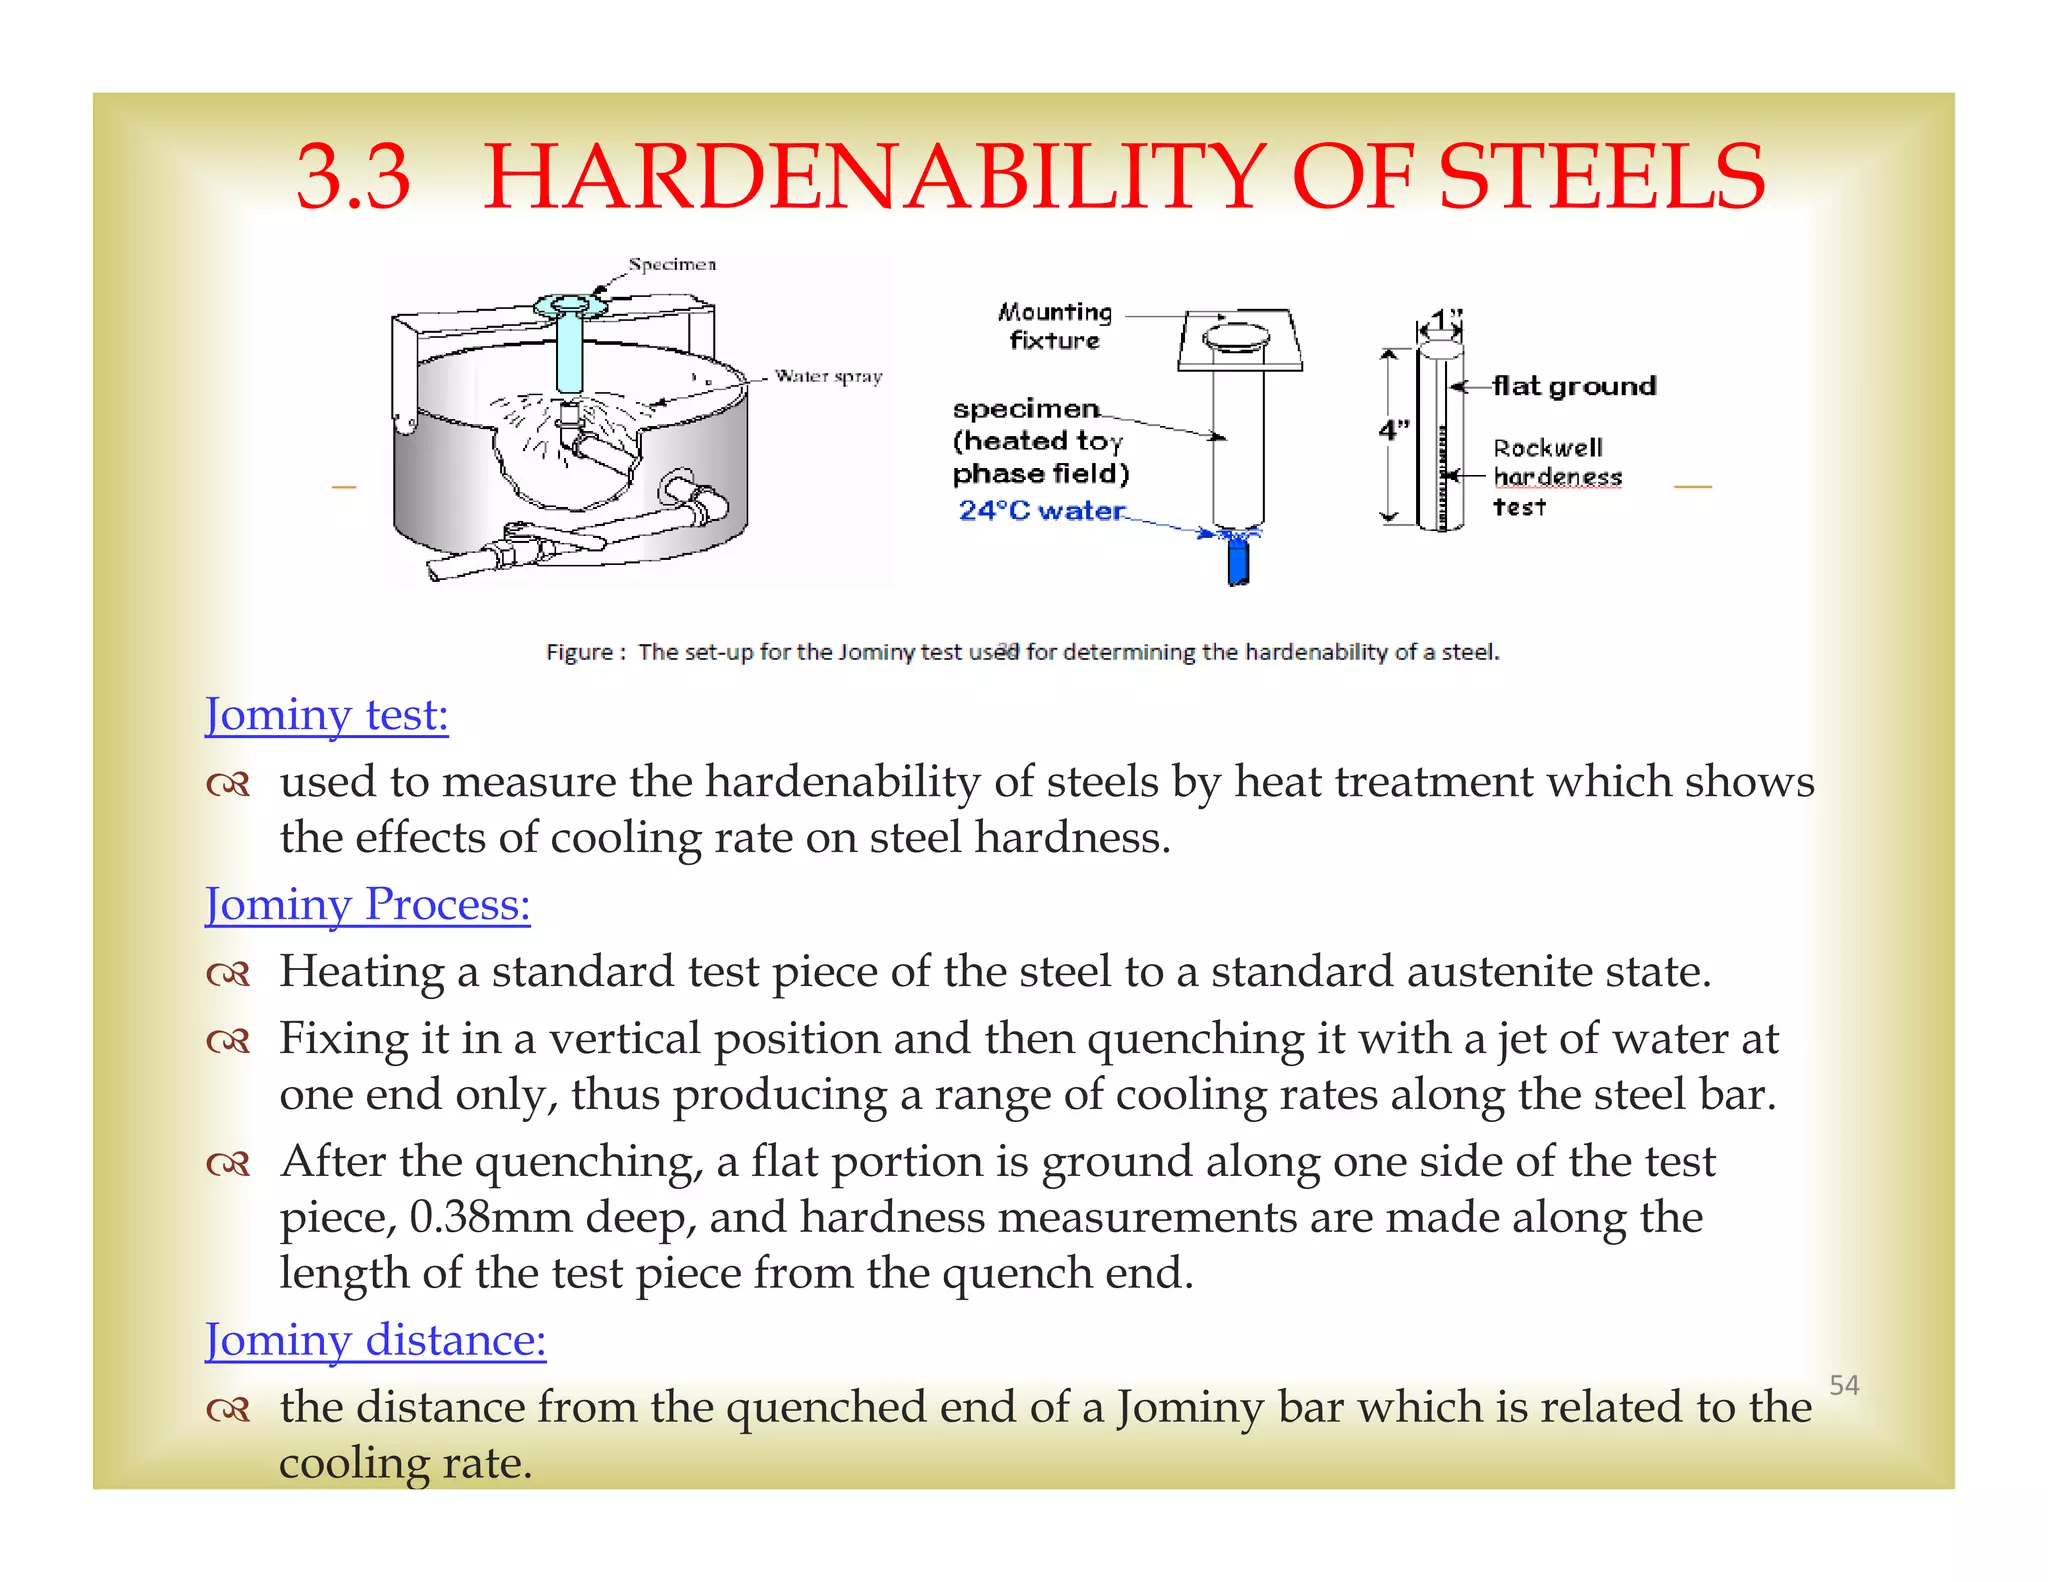
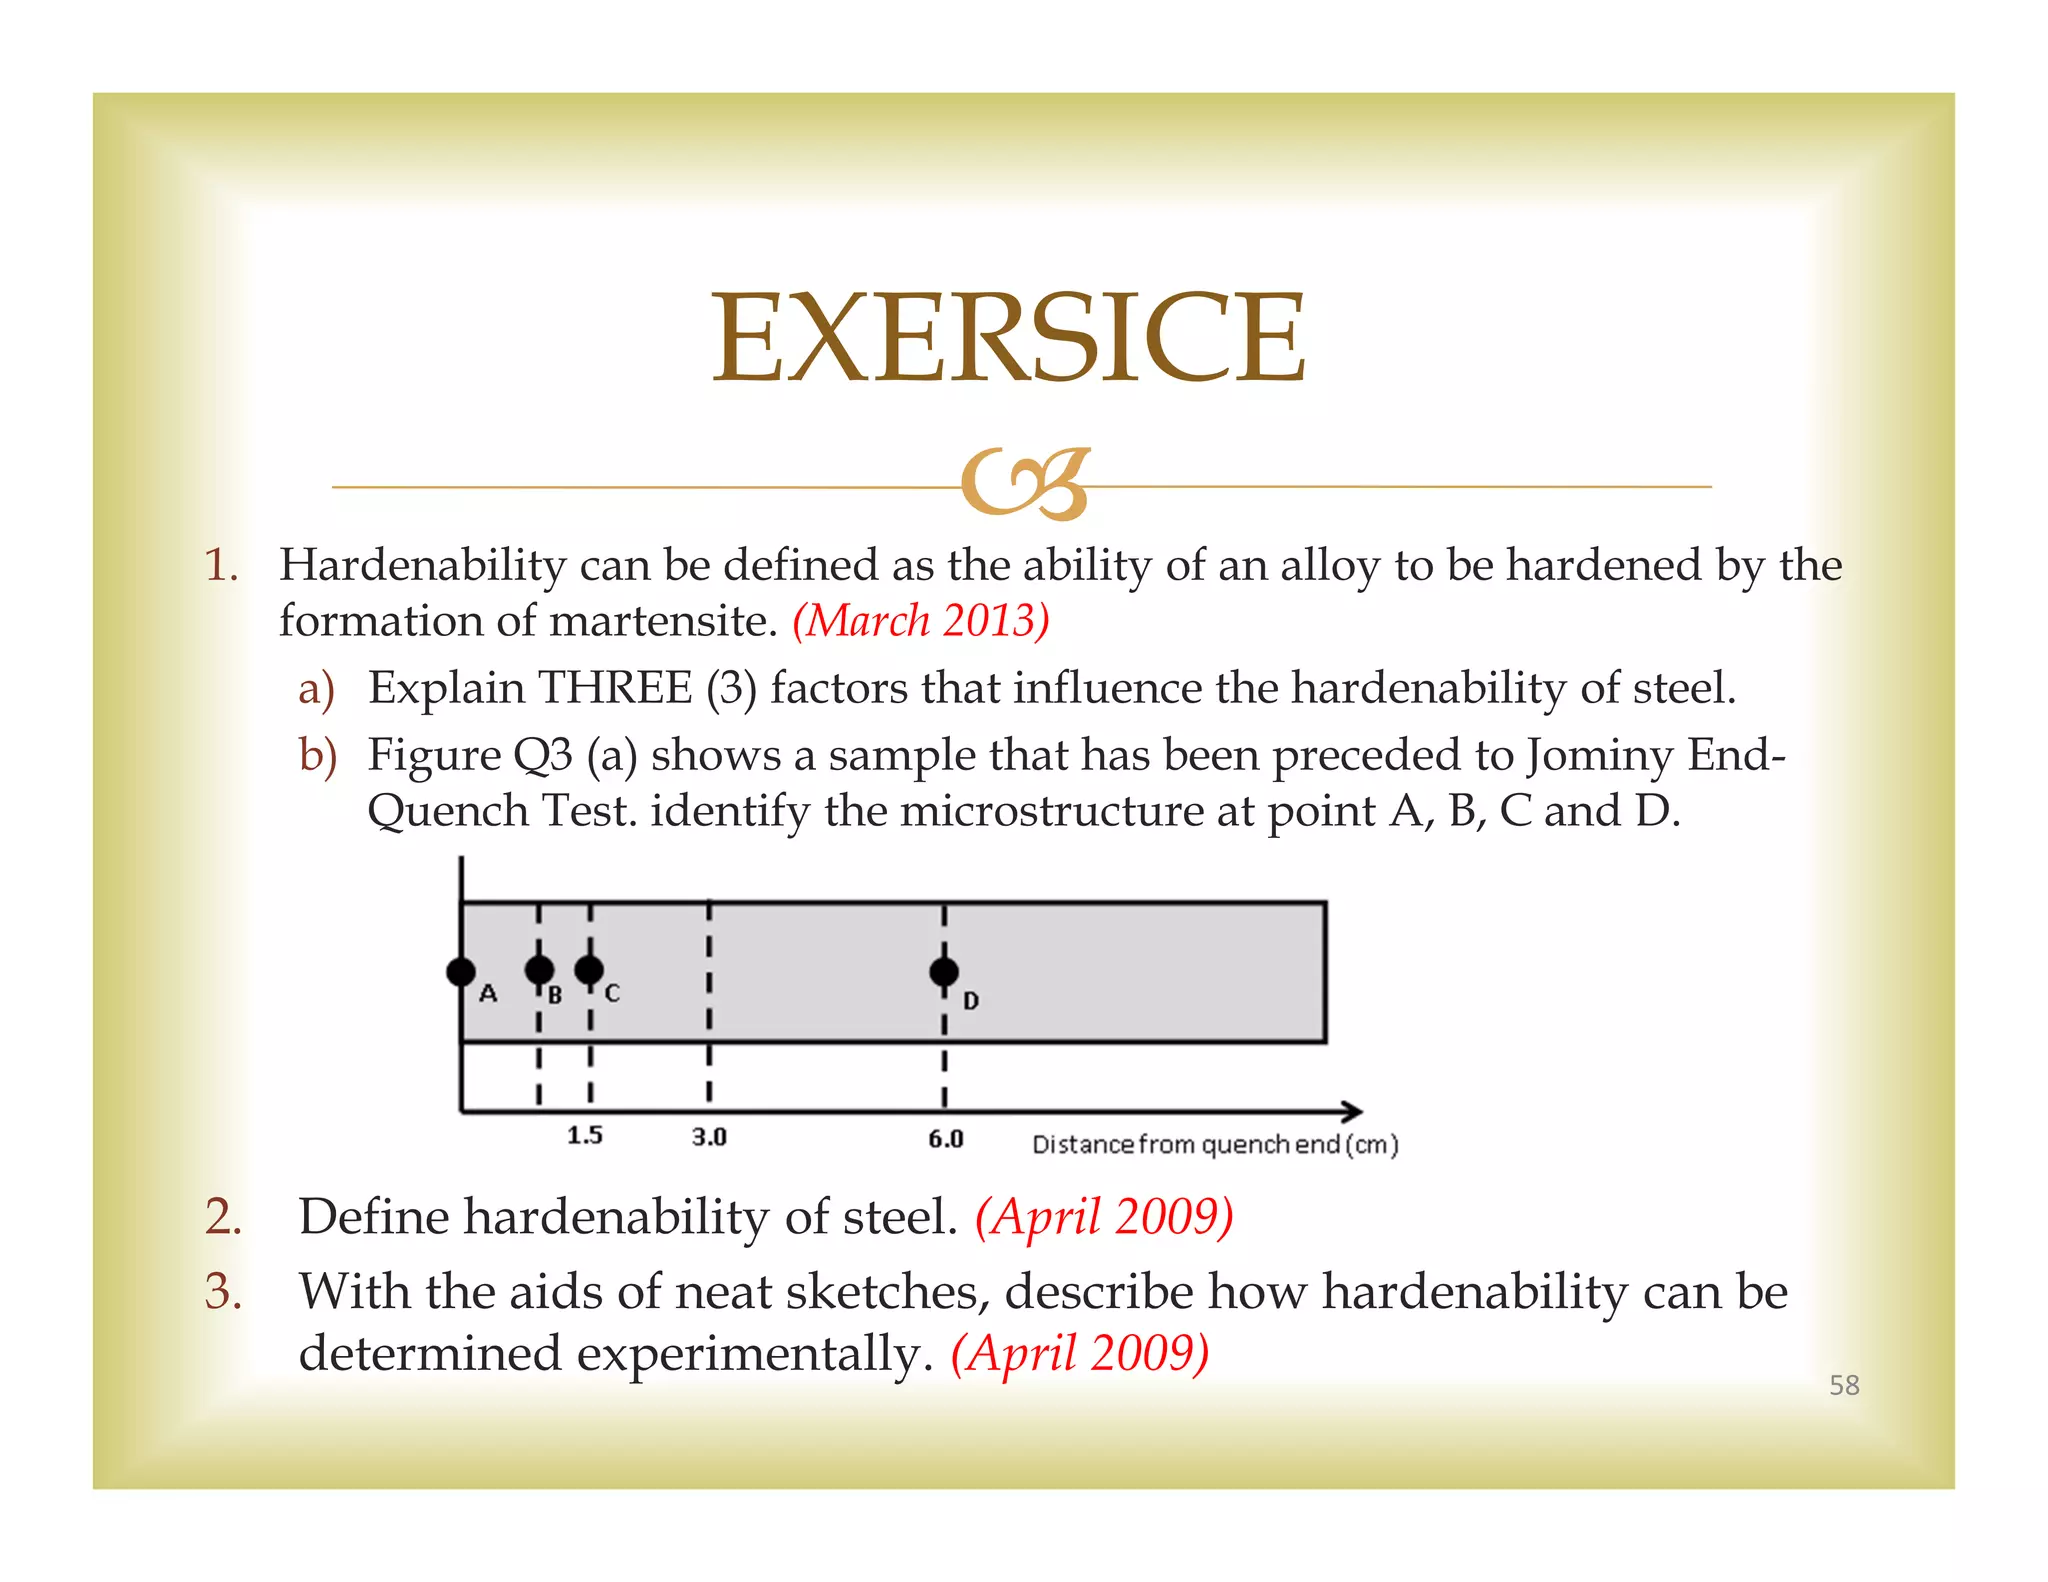
![Quenching : It is the act of rapidly cooling the hot steel to harden the steel.
Hardenability :
The ability of an alloy to be hardened by the formation of martensite as a
result of heat treatment.
A qualitative measure of the rate at which hardness drops of with distance
Purpose :
To increase strength and wear properties.
Process :
Heat the steel above the austenite temperature (either 15-40˚C above line A3
[hypo] or line A1 [hyper]) until the austenite composition is form and
cooled very rapidly in the quench media (a.k.a. cooling medium).
Microstructure produced :
Martensite (hard but brittle).
42
QUENCHING/HARDENING](https://image.slidesharecdn.com/9cztb0vaqk6kf4x1vwe8-signature-d98e614c44bb5d5fcfc79eb5ed8fdbf00bc1e22d961d7a0f5fed49408756051c-poli-140724113841-phpapp02/75/Mec281-lecture-347-2048.jpg)
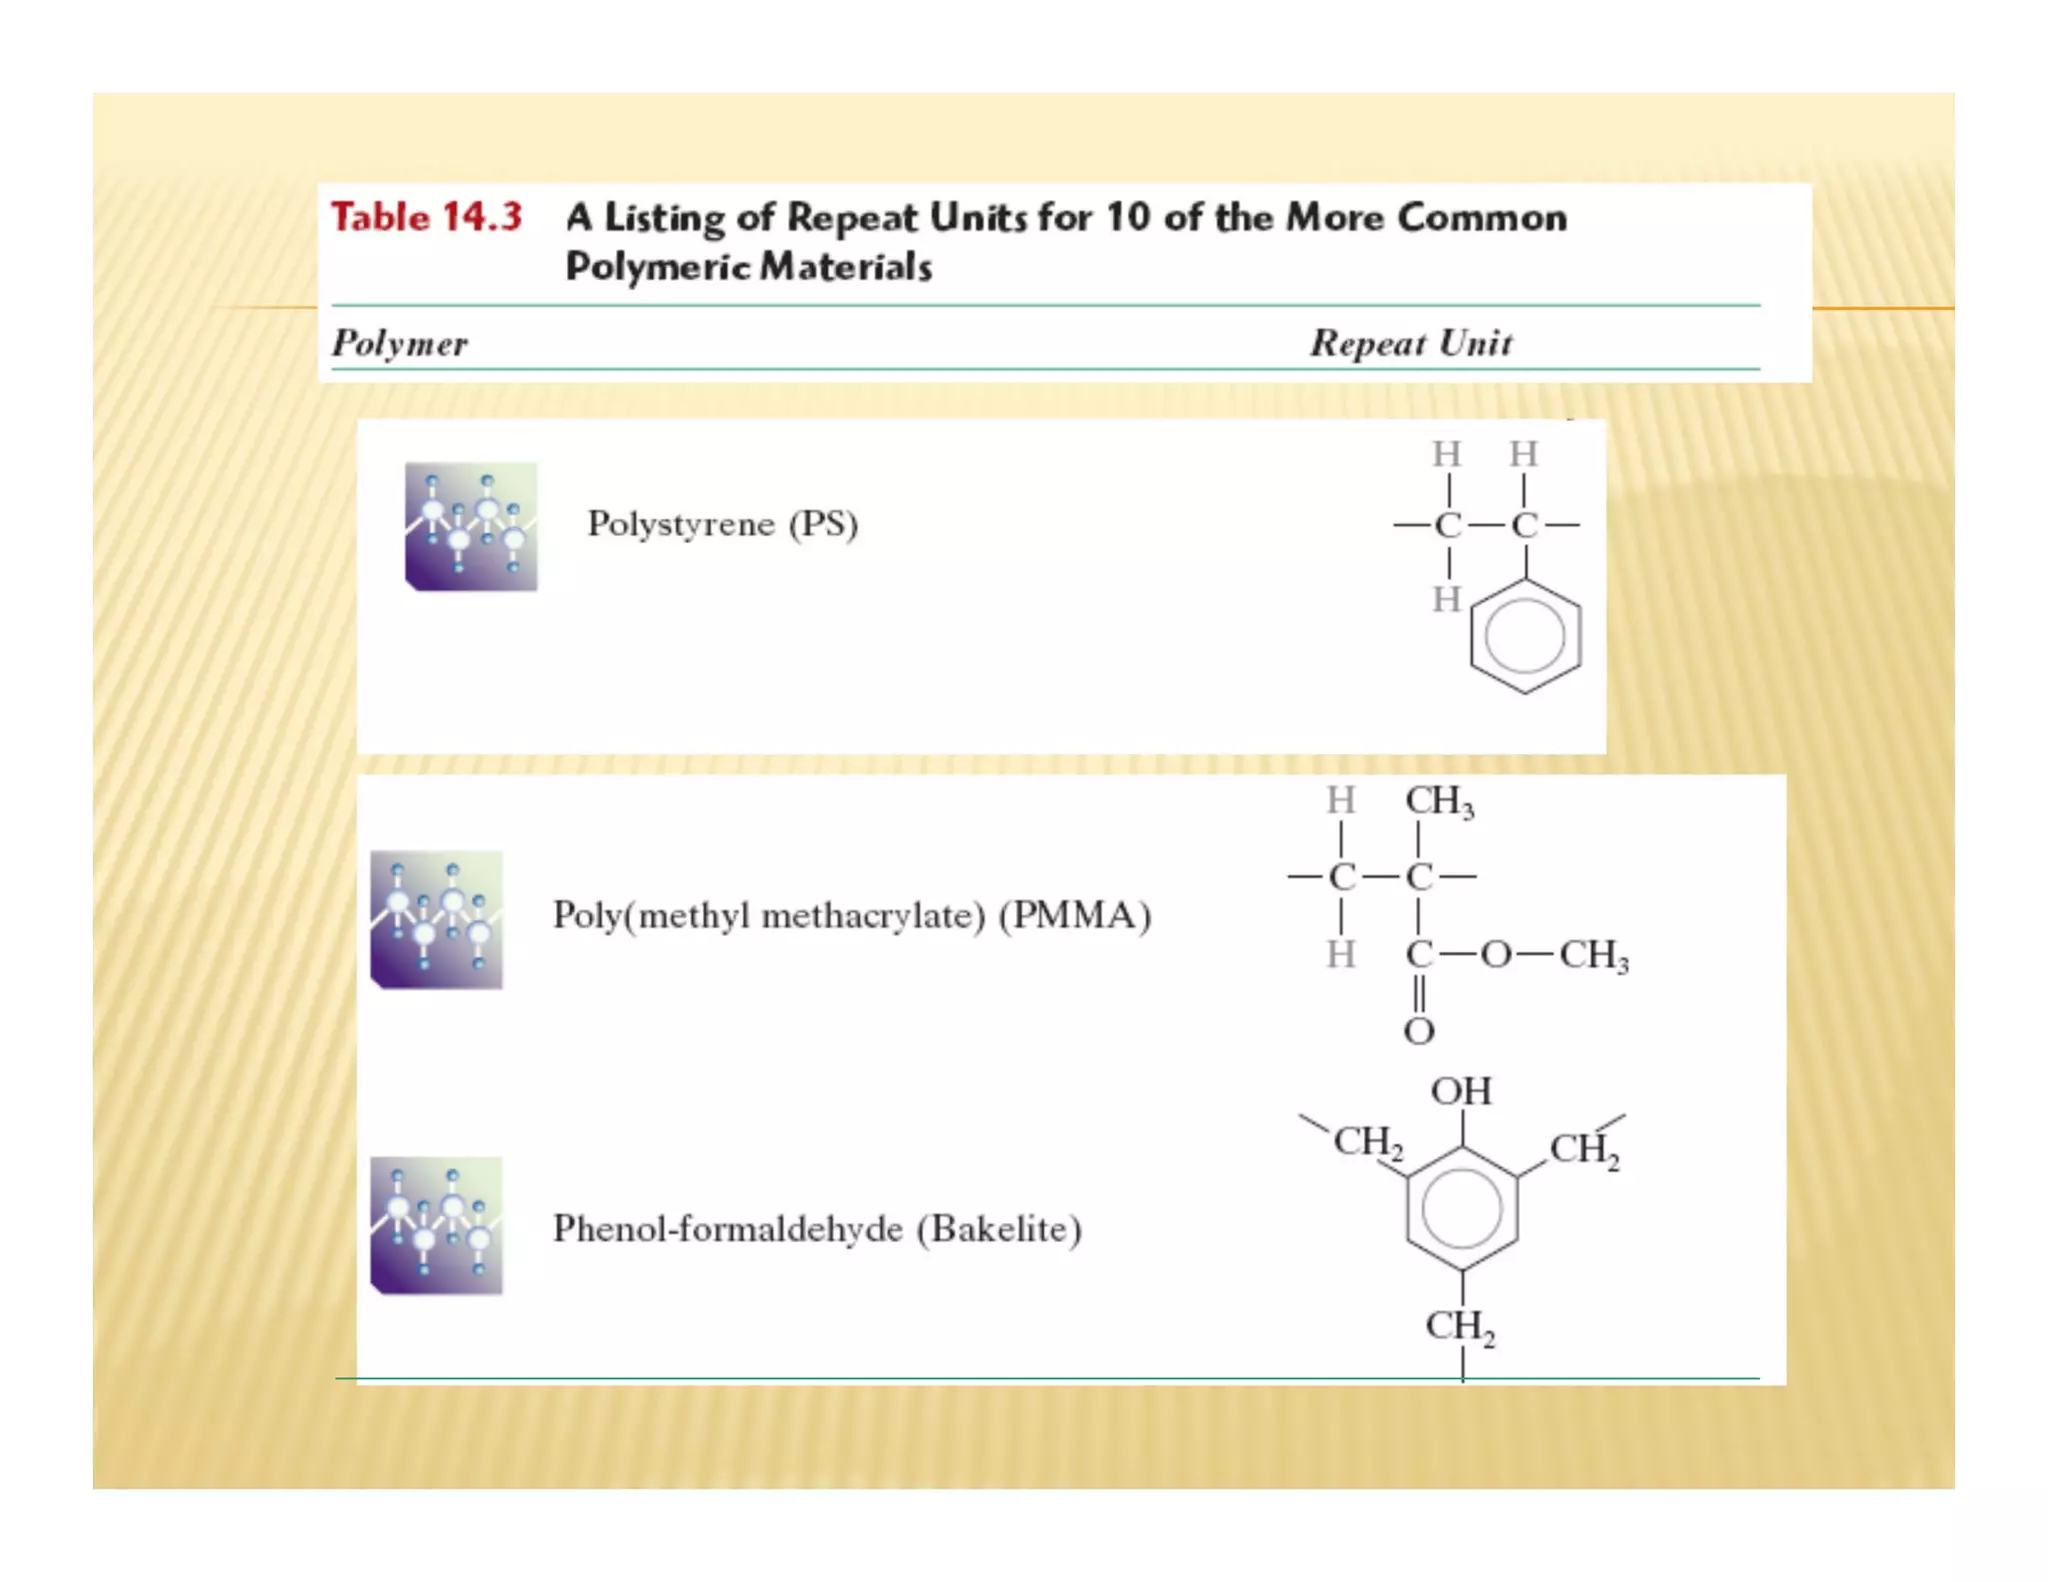
![Name(s)/Tradename Formula Monomer
Poly(vinylidene chloride)
(Saran A)
–(CH2-CCl2)n–
vinylidene chloride
CH2=CCl2
Polystyrene
(PS)
–[CH2-CH(C6H5)]n–
styrene
CH2=CHC6H5
Polyacrylonitrile
(PAN, Orlon, Acrilan)
–(CH2-CHCN)n–
acrylonitrile
CH2=CHCN
Polytetrafluoroethylene
(PTFE, Teflon)
–(CF2-CF2)n–
tetrafluoroethylene
CF2=CF2
Poly(methyl methacrylate)
(PMMA, Lucite, Plexiglas)
–[CH2-C(CH3)CO2CH3]n–
methyl methacrylate
CH2=C(CH3)CO2CH3
Poly(vinyl acetate)
(PVAc)
–(CH2-CHOCOCH3)n–
vinyl acetate
CH2=CHOCOCH3
cis-Polyisoprene
natural rubber
–[CH2-CH=C(CH3)-CH2]n–
isoprene
CH2=CH-C(CH3)=CH2
Polychloroprene (cis + trans)
(Neoprene)
–[CH2-CH=CCl-CH2]n–
chloroprene
CH2=CH-CCl=CH2](https://image.slidesharecdn.com/9cztb0vaqk6kf4x1vwe8-signature-d98e614c44bb5d5fcfc79eb5ed8fdbf00bc1e22d961d7a0f5fed49408756051c-poli-140724113841-phpapp02/75/Mec281-lecture-388-2048.jpg)


![• CMCs: Increased toughness • PMCs: Increased E/
• MMCs:
Increased
creep
resistance
20 30 50 100 200
10-10
10-8
10-6
10-4
6061 Al
6061 Al
w/SiC
whiskers (MPa)
ss (s-1)
E(GPa)
G=3E/8
K=E
Density, [Mg/m3]
.1 .3 1 3 10 30
.01
.1
1
10
102
103
metal/
metal alloys
polymers
PMCs
ceramics
fiber-reinf
un-reinf
particle-reinf
Force
Bend displacement
COMPOSITE BENEFITS](https://image.slidesharecdn.com/9cztb0vaqk6kf4x1vwe8-signature-d98e614c44bb5d5fcfc79eb5ed8fdbf00bc1e22d961d7a0f5fed49408756051c-poli-140724113841-phpapp02/75/Mec281-lecture-488-2048.jpg)

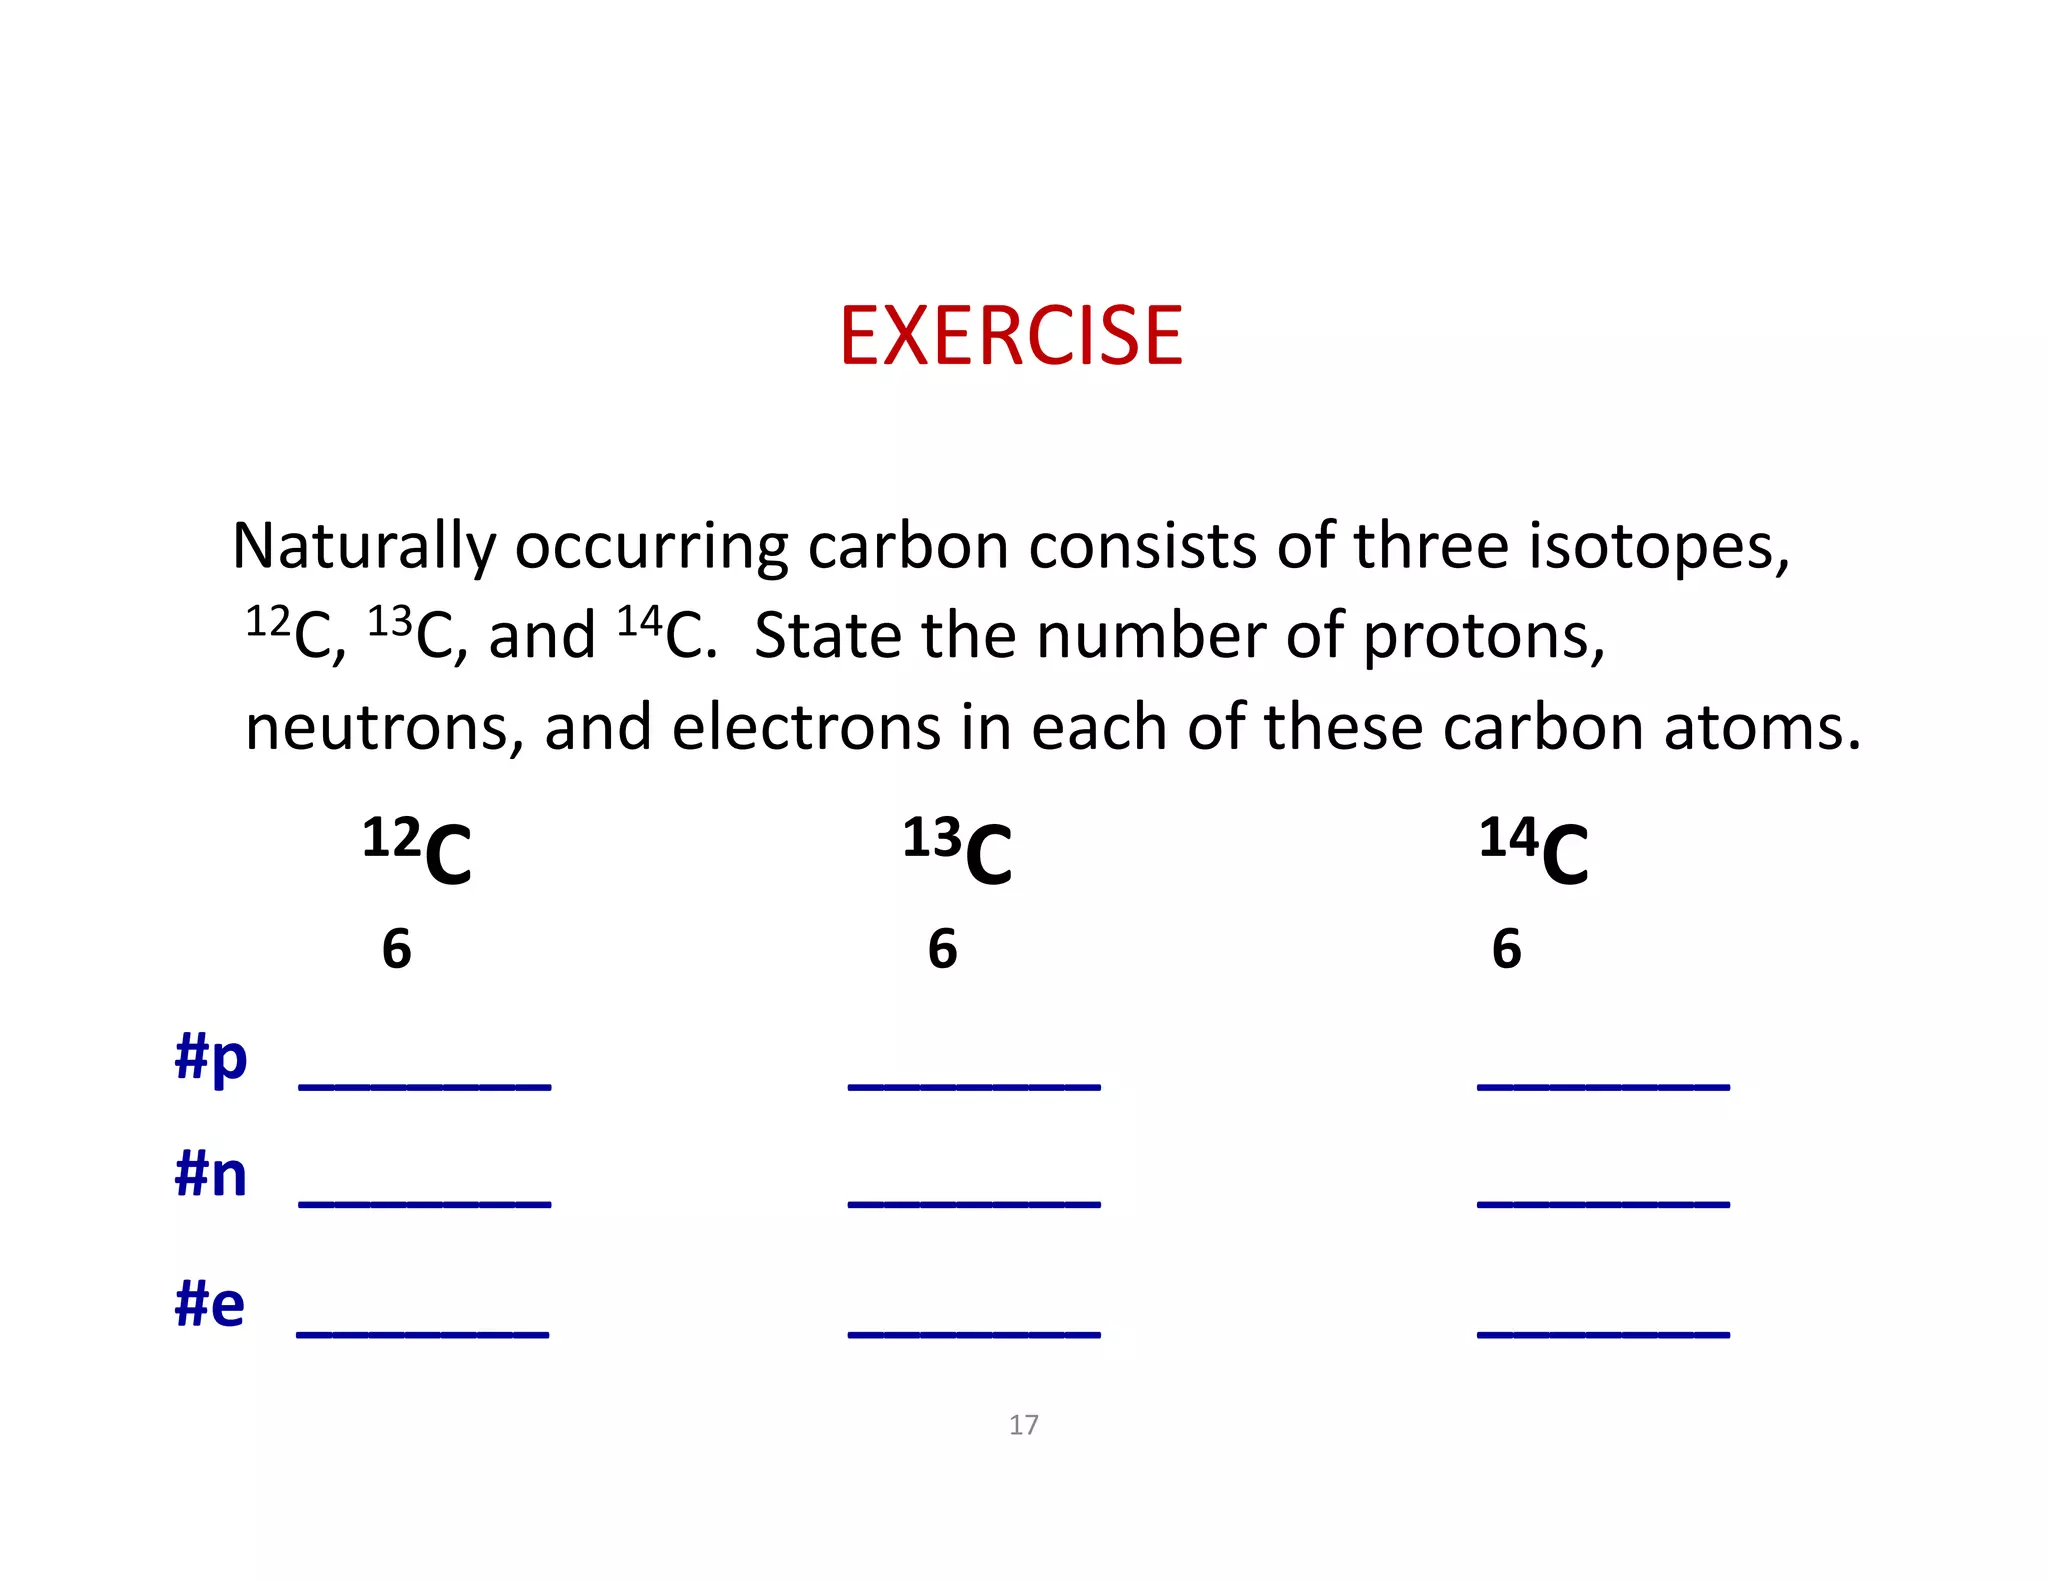
Here are the electron configurations for the given elements: 1. Carbon: 1s2 2s2 2p2 2. Oxygen: 1s2 2s2 2p4 3. Aluminum: 1s2 2s2 2p6 3s2 3p1 4. Copper: 1s2 2s2 2p6 3s2 3p6 4s1 3d10 5. Gold: 1s2 2s2 2p6 3s2 3p6 4s2 3d10 4p6 5s2 4d10 5p6 6s1